Modern Developments in X-Ray and Neutron Optics Episode 4 potx
Bạn đang xem bản rút gọn của tài liệu. Xem và tải ngay bản đầy đủ của tài liệu tại đây (2.35 MB, 40 trang )
102 S. Lagomarsino et al.
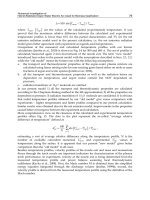
Fig. 6.5. (a) Intensity distribution in monomodal regime for the first mode in
front of and along a front coupling WG, (b) Intensity profile along 0Y of the same
waveguide calculated with computer code (full line) and with (6.17) (open circles)
The distribution of intensity for the first mode in free space close to the WG
exit coincides with the diffraction pattern of a confined wave with amplitude
given by (6.17) by a slit with size d corresponding to the WG gap. In the near
field zone, i.e., Δx<x
dif
∼ d
2
/4λ =1.6 × 10
4
nm, where Δx is the distance
from the WG end, the beam cross section is practically constant (∼d). At
Δx = x
dif
it is possible to note a focusing effect (see Fig. 6.7a) with a clear
narrowing of the cross section. In the far field zone x>x
dif
the beam diverges
with the divergence ≈λ/d.
6.3.2 Radiation from an Incoherent Source at Short Distance
As mentioned before, the WG accepts and transmits the coherent part of
radiation. WGs are used mostly with synchrotron radiation sources, but it
has been demonstrated that they can provide useful intensity also with table-
top laboratory sources [15,44]. For the latter we have to investigate the effect
of the illumination of the waveguide entrance with spatially incoherent radi-
ation on the properties of the exiting beam. This may enable us to derive
the geometrical condition for optimized coupling. For excitation of indepen-
dent modes in the front coupling waveguide the next condition, based on the
definition of the transverse coherence length, L
c
, should be fulfilled:
2d ≤ L
c
= λX/s, (6.18)
where X is the distance between source and waveguide, d is the thickness of the
guiding layer, 2d is the spatial acceptance of the waveguide, s is the size of the
source, and λ is the wavelength of the incoming radiation. If the equality sign
holds in (6.18), the distance X can be considered as X
min
, the minimum dis-
tance for coherent illumination. If d = 100 nm,s=15μm, and λ =0.154 nm
then X
min
= 20 mm. An incoherent source of radiation in computer code
is considered as a set of N radiators with random initial phases distributed
6 Theoretical Analysis of X-Ray Waveguides 103
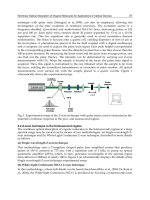
Fig. 6.6. Intensity distribution in front of and inside a WG illuminated by an
extended source. Case (a)isforadistanceX
min
= 20 mm, which corresponds to
the lower limit for spatially coherent illumination for a gap d = 100 nm, a source
size s =15μm, and λ =0.154 nm (Pt cladding). In case (b)atX =10mmthe
illumination is spatially incoherent under the same conditions
within the interval [−π, π]. The elementary radiator gives rise to a spherical
wave with the origin positioned randomly within the source area s.
Figure 6.6a, b illustrates the intensity distribution calculated following the
code described above, in front and inside a planar WG with Pt cladding layer,
for a distance X = X
min
and X
min
/2, respectively. The gap was d = 100 nm,
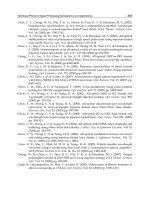
the source size s =15μm, and λ =0.154 nm. Figure 6.7a, b shows in more
detail the distribution at the exit of the WG, and Fig. 6.7c, d the cross-section
profiles just at the WG exit at a distance x = x
dif
for X = X
min
and X =
X
min
/2, respectively. As can be seen, for X = X
min
the WG can provide
a single mode coherent beam, whilst for X = X
min
/2 a clear mode mixing
takes place.
6.3.3 Material and Absorption Considerations
In the front coupling mode with an air or vacuum gap, absorption losses
are due only to the penetration of the tails of the intensity distribution into
the cladding material. Rigorous calculations should involve physical optical
considerations, but simple ray-tracing can give very good approximate values
for the estimation of absorption losses.
In the case of independent mode propagation, the variation of power along
the WG length X (θ<<θ
c
) is given by [45]
W (X)=W
0
R
Fr
N
(θ
m
) ≈ W
0
exp(−
β
δ
3/2
X
d
√
2
θ
2
m
), (6.19)
W
0
is the energy of radiation coupled by the waveguide, R
Fr
is the Fresnel
coefficient of reflection for the vacuum–cladding layer boundary, N = Xθ
m
/d
104 S. Lagomarsino et al.
Fig. 6.7. The intensity distribution in the vicinity of the exit of the waveguide
illuminated by an incoherent source located at the distance X
min
=20mm(a)and
X =10mm(b). The vertical intensity distribution just at the exit of the WG and at
a distance from the waveguide end corresponding to x
dif
for X =20mm(c)and
X =10mm(d)(seetext)
is the number of reflections that the ray undergoes. The same function W (X)
can be calculated using the computer code. A very good correspondence is
found between the calculated X
abs
according to (6.19) and the result of a
computer simulation based on the solution of parabolic wave equation.
6.4 Direct Front Coupling
When the incoming beam is directly coupled to the waveguide (see Fig. 6.1b),
the interaction of the beam with the cladding layers must be considered in
detail, especially if the cladding material for the photon energy considered
is weakly absorbing. This analysis, which reveals several interesting diffrac-
tion and refraction phenomena, substantially modify the wave field in the
waveguide. For a more complete treatment see [46].
6 Theoretical Analysis of X-Ray Waveguides 105
6.4.1 Diffraction from a Dielectric Corner
Let us have an S-polarized plane wave of wavelength λ =0.1nm incident
at right angles to the side of a planar hollow X-ray waveguide. The gap d is
limited by two cladding walls with refractive index n = ε
1/2
=(1− δ − iβ).
In the following, silicon is considered as the material constituting the walls.
At the given photon energies in this paper β<<δ. We start by considering a
single dielectric corner (half of the waveguide in our case). In this case Kopylov
and Popov [47] have shown that the diffracted field U(x, y) can be expressed,
in the paraxial approximation, as
U(x, y)=
F (η)+M (η,ν), vacuum
(F (ν)+M(η, iν))exp(−ν
2
), material
(6.20)
M(η, ν)=(πi)
−1
∞−ia
−∞−ia
exp(−t
2
− 2tη
√
i)/
t
2
− ν
2
dt
≈ M
1
(x, y)+M
2
(x, y)
η = |y|
k/(2x),ν=
kx(β +iδ),k=2π/λ,
where F (x, y) is the Fresnel integral and M (x, y) is a new special function
whose influence is more significant for weakly absorbing materials. In the
approximation of relatively large distances, x, from the WG entrance (x>>
1/(kθ
c
2
)withθ
c
=(2δ)
1/2
the critical angle for total reflection), the function
M(x, y) can be expressed asymptotically as a sum of two terms
M
1
(x, y) ≈
2x
πk
exp
i
ky
2
2x
− i
π
4
θ
2
c
x
2
− y
2
,
M
2
(x, y) ≈
2x
πk
exp
ik(θ
c
y −
θ
2
c
2
x)+i
π
4
θ
c
x(θ
c
x − y).
(6.21)
The first one, M
1
(x, y), is a correction to the Fresnel edge diffraction term
due to the material of the wall, and the second one, M
2
(x, y), represents a
lateral plane wave propagating in the wall material along the material–vacuum
interface 0X, with the enhanced phase velocity V
p
= c/ε
1/2
and entering into
the vacuum at the critical angle θ
c
[47]. In (6.20) and (6.21), the origin of the
y coordinate is at the vacuum–wall interface.
The superposition of the direct and diffracted beams with the lateral wave
gives rise to an interference pattern of successive maxima and minima (see
Fig. 6.2 in [46]). Coordinates of maxima in the spatial intensity distribution
can be found from the condition for constructive interference of wave fields
described in (6.20) and (6.21). The comparison between the spatial distribu-
tion of intensity calculated analytically using the above equations, and the
result of a computer simulation based on the parabolic wave equation (PWE)
numerical solution [43], reveals a very good agreement between the two [46].
106 S. Lagomarsino et al.
6.4.2 Diffraction in a Dielectric FC Waveguide
We extended the same formalism to the analysis of the field at the entrance
aperture of the waveguide. In the following, the origin of the y coordinate is in
the middle of the gap d, and the cladding walls are at ±d/2. An approximate
solution in the far field zone (x>(d/2)
2
/λ) is the superposition of the field
Φ(x, y) ≈
˜
Φ(kθ)exp
−iπ/4+ikθ
2
x/2
/
√
λx,
where
˜
Φ(kθ) ≈ d
sin(kθd/2)
kθd/2
+
cos(kθd/2)
(kd/2)
θ
c
2
− θ
2
,
(6.22)
with two lateral plane waves, M
2
(x, y) (see (6.21)), entering into the vacuum
gap from the opposite boundaries y = ±d/2 of waveguide. In (6.22) θ = y/x.
The spatial spectral amplitude
˜
Φ(kθ) in (6.22) includes the sin function of
(kθd/2), corresponding to the Fraunhofer diffraction of a plane wave from a
thin slit and a correction term due to thematerialofthewalls. The correction
term shifts the positions of the angular spectrum maxima towards smaller
angles. It is easy to show that the spectral amplitude
˜
Φ(kθ) in (6.22) is equal to
˜
Φ(kθ) ≈
+∞
−∞
ϕ(y)dy, where (6.23)
ϕ(y)=
cos(kθy), |y| <d/2
cos(kθd/2) exp[−kμ(|y|−d/2)] , else,
where μ =(θ
c
2
−θ
2
)
1/2
.Forθ values equal to the waveguide resonance angles
θ
m
, the function ϕ(θ
m
)=ϕ
m
corresponds exactly to the expression of guided
modes. Taking the orthogonal modes {ϕ
m
} of the waveguide as a basis, the
projection of the field Φ(x, y) on the guided modes at distances x>x
min
=
(d/2)
2
/λ is given by [26]
Φ(x, y)=
m=m
max
m=0
c
m
(θ
m
)ϕ
m
(y), (6.24)
where the coefficients c
m
are given by
c
m
(θ
m
)=ϕ
m
−1
+∞
−∞
ϕ
m
(y)dy. (6.25)
θ
m
are the resonance angles, μ
m
≈ (θ
c
2
−θ
m
2
)
1/2
,andm
max
is the maximum
number of allowed resonance modes. Taking into account the propagation
factor exp(−iχ
m
x) for each mode, where in the parabolic approximation
(θ<<θ
c
)χ
m
≈ θ
2
m
[k/2 − i(β/δ
3/2
)/(2
1/2
d)] [45], the wave field Φ(x, y)at
any point of the waveguide is given by
Φ(x, y)=
m=m
max
m=0
c
m
(θ
m
)ϕ
m
(y)exp(−iχ
m
x). (6.26)
6 Theoretical Analysis of X-Ray Waveguides 107
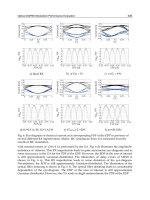
Fig. 6.8. Total field in a waveguide with Si walls and a 30 nm gap (wavelength
= 0.1 nm) with a plane wave at the entrance: (a) analytical solution; (b)com-
puter simulation; (c) computer simulation, with a step function field (U =1inthe
gap, 0 elsewhere) at the entrance (from Bukreeva et al. [46] with permission of the
publisher)
The total field U(x, y) is therefore given by the superposition of prop-
agating modes (6.26) and function, which represents a sum of two lateral
waves M
2
(x, y) (see (6.21)) entering into the vacuum gap from the opposite
boundaries, y = ±d/2, of the waveguide
Ψ(x, y) ≈
d
√
λx
exp
iπ/4 − ikθ
2
c
x
2
cos (kθ
c
y)
kθ
c
d/2
exp (ikθ
c
d/2) . (6.27)
In Fig. 6.8 the global intensity distribution in the vacuum guiding layer
for a 30-nm gap waveguide with Si walls and photon wavelength λ =0.1nmis
shown. The waveguide supports only one mode. Figure 6.8a depicts the ana-
lytical solution given by (6.26) and (6.27), and Fig. 6.8b represents the result
of the computer simulation based on the numerical solution of the parabolic
wave equation (6.14). The agreement is very good. Figure 6.8c shows the
intensity distribution when the field at the waveguide entrance is a step func-
tion (U(0,y)=1fory ∈ [−d/2,d/2] and U(0,y)=0elsewhere),and
therefore penetration through the cladding walls is excluded. Figures 6.8a–c
108 S. Lagomarsino et al.
shows that the interference of a guided mode with lateral waves introduces a
strong spatial modulation of the signal.
A more quantitative comparison, not shown here for reasons of space, gives
a very good agreement between the asymptotic solution and the computer
simulation for both the distribution of the intensity and of the phase of the
resulting field along the optical axis 0X (see Fig. 6.1).
The contribution of the field diffracted and refracted by the cladding walls
is not only related to the spatial modulation of the signal. Both analytical and
computer calculations show that the field penetrating into the waveguide from
the weakly absorbing cladding walls significantly increases (approximately
1.5 times) the electromagnetic power in the waveguide compared to the case
when the field at the waveguide entrance is a simple step function, thereby
eliminating penetration through the cladding walls. In Fig. 6.9 we report the
normalized integrated power within the WG gap as a function of propagation
distance x.
We have shown here that the calculation of the field in a hollow weakly
absorbing X-ray waveguide must take into account the interaction of the
incoming beam with the cladding material at the entrance of the waveguide.
The total field in the guiding vacuum layer can then be expressed as the super-
position of guided modes with nonuniform plane waves penetrating into the
guiding gap from the cladding walls at the critical angle of reflection, θ
c
(lat-
eral waves). An analytical expression of the total field is given and compared
Fig. 6.9. The normalized value of the electromagnetic power integrated within the
vacuum gap vs. coordinate X calculated for a step-like entrance function (bottom
lines) and for the total field calculated following (6.25) and (6.26) (top lines). The
solid lines are the result of a computer simulation while the dashed lines are
the result of an analytical calculation (from Bukreeva et al. [46] with permission
of the publisher)
6 Theoretical Analysis of X-Ray Waveguides 109
with the results of a computer simulation based on the numerical solution of
the parabolic wave equation. The two independent approaches to the diffrac-
tion problem, the asymptotic analytical solution and a computer simulation,
demonstrate very good qualitative and quantitative agreement.
6.5 Conclusions
The analysis of the behavior of WGs in three different coupling geometries
has led us to some conclusions about their optimal use as a function of the
source characteristics. We have shown in Sect. 6.2 that the angular acceptance
of RBC WGs is by far larger than the beam divergence of most synchrotron
radiation beam lines, at least at photon energies below 50 keV and gap values
below 100 nm. On the other hand, the spatial acceptance is much smaller than
the full beam size at the distances typical of synchrotron radiation facilities.
Therefore, to maximize the total flux, a prefocusing optics with quite long
focal distance, providing an input beam for WG matched to its spatial and
angular acceptances, should be used. Similar considerations are valid for front
coupling WGs, but in this case the spatial acceptance is on the order of the
gap value, and the angular acceptance is larger than in the RBC case. There-
fore, focusing optics with a much shorter focal distance are best matched, as
demonstrated also from the experimental point of view in 2D WGs [9]. In any
case, irrespective of the coupling mode, the total available flux is limited by
the coherent flux, as expressed by (6.1). It is interesting to note that this is a
limit applicable to any kind of optics if the requirement of a coherent beam
holds. This is an interesting point to consider especially when designing optics
for coherent sources such as free electron lasers. The emerging field of coherent
diffractive imaging [48] is attracting great interest for its impressive potential
in the structural determination of nonperiodic objects with nanometer resolu-
tion. WGs, because of their characteristics, are ideally suited for this kind of
application. A first demonstration of the possibility to make coherent diffrac-
tive imaging experiments using the beam from a WG has been recently carried
out [49]. Another aspect to consider in regard to the best coupling mode is that
RBC cannot be used in the soft X-ray range, because of the strong absorp-
tion from the cover layer. Therefore, in this spectral region only FC (with or
without prereflection) must be used. In this case, it has been shown here that
careful considerations of all the refractive and diffractive effects resulting from
interaction of the incoming beam with the cladding must be taken into proper
account to predict the field distribution and the intensity inside the WG.
Acknowledgements
The authors gratefully acknowledge partial financial support from Italian
pro jects SPARC and SPARX.
110 S. Lagomarsino et al.
References
1. E. Spiller, A. Segm¨uller, Appl. Phys. Lett. 24, 60 (1974)
2. M.J. Bedzyk, G.M. Bommarito, J.S. Schildkraut, Phys. Rev. Lett. 62,
1376 (1989)
3. J. Wang, M.J. Bedzyk, M. Caffrey, Science 258, 775 (1992)
4. P. Feng, S.K. Sinha, H.W. Deckman, J.B. Hastings, D.P. Siddons, Phys. Rev.
Lett. 71, 537 (1993)
5. Y.P. Feng, S.K. Sinha, E.E. Fullerton, G. Gr¨ubel, D. Abernathy, D.P. Siddons,
J.B.Hastings,Appl.Phys.Lett.67, 24 (1995)
6. S. Lagomarsino, W. Jark, S. Di Fonzo, A. Cedola, B.R. M¨uller, C. Riekel, P.
Engstrom, J. Appl. Phys. 79, 4471 (1996)
7. W. Jark, S. Di Fonzo, S. Lagomarsino, A. Cedola, E. di Fabrizio, A. Bram, C.
Riekel, J. Appl. Phys. 80, 4831 (1996)
8. W. Jark, A. Cedola, S. Di Fonzo, M. Fiordelisi, S. Lagomarsino, N.V. Kovalenko,
V.A. Chernov, Appl. Phys. Lett. 78, 1192 (2001)
9. F. Pfeiffer, C. David, M. Burghammer, C. Riekel, T. Salditt, Science 297, 230
(2002) and />10. A. Jarre, C. Fuhse, C. Ollinger, J. Seeger, R. Tucoulou, T. Salditt, Phys. Rev.
Lett. 94, 074801 (2005)
11. C. Bergemann, H. Keymeulen, J.F. van der Veen, Phys. Rev. Lett. 91,
204801 (2003)
12. F. Pfeiffer, T. Salditt, P. Høghøj, I. Anderson, N. Schell, Phys. Rev. B 62,
16939 (2000)
13. W. Jark, S. Di Fonzo, J. Synchrotron Radiat. 11, 386 (2004)
14. W.Jark,S.DiFonzo,inSPIE – Proceedings: Design and Microfabrication of
Novel X-ray Optics II. vol. 5539, (2004) p. 138
15. D. Pelliccia, A. Cedola, F. Scarinci, S. Lagomarsino, J. Phys. D: Appl. Phys.
38, 1 (2005)
16. S. Di Fonzo, W. Jark, S. Lagomarsino, C. Giannini, L. De Caro, A. Cedola, M.
M¨uller, Nature 403, 638 (2000)
17. M. M¨uller, M. Burghammer, D. Flot, C. Riekel, C. Morawe, B. Murphy, A.
Cedola, J. Appl. Cryst. 33, 1231 (2000)
18. A. Cedola, M. Mastrogiacomo, M. Burghammer, V. Komlev, P. Giannoni, R.
Cancedda, F. Rustichelli, A. Favia, S. Lagomarsino, Phys. Med. Biol. 51, N109,
6 (2006)
19. M.J. Zwanenburg, J.H.H. Bongaerts, J.F. Peters, D.O. Riese, J.F. van der Veen,
Phys. Rev. Lett. 85, 5154 (2000)
20. T. Salditt, F. Pfeiffer, H. Perzl, A. Vix, U. Mennicke, A. Jarre, A. Mazuelas,
T.H. Metzger, Phys. B 336, 181 (2003)
21. S. Lagomarsino, A. Cedola, in Encyclopedia of Nanoscience and Nanotechnology,
vol. 10, ed. by H.S. Nalwa (American Scientific Publisher, CA, U.S.A., 2004),
p. 681
22. A. Cedola, S. Lagomarsino, Synchrotron Radiat. News (special issue) 17,
30 (2004)
23. A. Cedola, D. Pelliccia, I. Bukreeva, A. Surpi, F. Scarinci, S. Lagomarsino, X-ray
Micro and Nano-probes: Fundamentals and Applications, Transworld Research
Network, Recent Developments in Applied Physics, 9, ISBN: 81-7895-213-0
(2006)
6 Theoretical Analysis of X-Ray Waveguides 111
24. L. De Caro, C. Giannini, S. Di Fonzo, W. Jark, A. Cedola, S. Lagomarsino, Opt.
Commun. 217, 31 (2003)
25. D. Attwood, Soft X-Rays and Extreme Ultraviolet Radiation: Principles and
Applications, Chap. 8 (Cambridge University Press, Cambridge, 1999)
26. D. Marcuse, Theory of Dielectric Waveguides (Academic Press, San Diego, 1991)
27. />constants/
28. />29. B.L. Henke, E.M. Gullickson, and J.C. Davis, At. Data Nucl. Data Tables 54,
181 (1993)
30. C.T. Chantler, K. Olsen, R.A. Dragoset, A.R. Inshore, S.A. Kotochigova, D.S.
Zucker, X-Ray Form Factor, Attenuation and Scattering Tables (version 2.0),
(National Institute of Standards and Technology,
Gaithersburg, MD, 2003)
31. S. Lagomarsino, A. Cedola, S. Di Fonzo, W. Jark, V. Mocella, J.B. Pelka, and
C. Riekel, Cryst. Res. Technol. 37, 758 (2002)
32. L.G. Parratt, Phys. Rev. 95, 395 (1954)
33. M.J. Zwanenburg, J.H.H. Bongaerts, J.F. Peters, D. Riese, and J.F. van der
Veen, Phys. B 283, 285 (2000)
34. F. Pfeiffer, Diploma thesis, Ludwig-Maximilians-Universit¨at M¨unchen, Sektion
Physik, Munich, Germany, 1999
35. C.G. Schroer, B. Lengeler, B. Phys. Rev. Lett. 94, 054802 (2005)
36. A.G. Michette, S.J. Pfauntsch, A. Erko, A. Firsov, A. Svintsov, Opt. Commun.
245, 249 (2005)
37.H.C.Kang,J.Maser,G.B.Stephenson,C.Liu,R.Conley,A.T.Macrander,
S. Vogt, Phys. Rev. Lett. 96, 127401 (2006)
38. B. Lengeler, C.G. Schroer, J. T¨ummler, B. Benner, M. Richwin, A. Snigirev,
I. Snigireva, M. Drakopoulos, J. Synchrotron Radiat. 6, 1167 (1999)
39. M. Born, E. Wolf, Principle of Optics, 6th edn (Pergamon Press,
New York, 1980)
40. P. Karimov, E.Z. Kurmaev, Phys. Lett. A 320, 234 (2003)
41. N.V. Kovalenko, V.A. Chernov, Budker Institute of Nuclear Physics, Novosibirsk
(Russia), private communication (2000)
42. P. Karimov, J. Kawal, E.Z. Kurmaev, Anal. Sci. 21, 811 (2005)
43. Y.V. Kopylov, A.V. Popov, A.V. Vinogradov, Opt. Commun. 118, 619 (1995)
44. V.K. Egorov, E.V. Egorov, X-Ray Spectrometry, 33, 360 (2004)
45. A.V. Vinogradov, I.A. Brytov, A. Ya. Grudsky, M.T. Kogan, I.V. Kozhevnikov,
V.A. Slemzin, Mirror X-Ray Optics (in Russian) (Mashinostroenie,
Leningrad, 1989)
46. I. Bukreeva, A. Popov, D. Pelliccia, A. Cedola, S. Dabagov, S. Lagomarsino,
Phys. Rev. Lett. 97, 184801 (2006)
47. Y.V. Kopylov, A.V. Popov, Radio Sci. 31, 1815, (1996)
48. J. Miao, P. Charalambous, J. Kirz, D. Sayre, Nature 400, 342 (1999)
49. L. De Caro, C. Giannini, A. Cedola, D. Pelliccia, S. Lagomarsino, W. Jark,
Appl. Phys. Lett. 90, 041105 (2007)
7
Focusing Optics for Neutrons
F. Ott
Abstract. Neutrons beams are difficult to handle since the neutron is a neutral
particle with a very weak interaction with matter. In addition, neutron sources are
broad and isotropic, which makes it very challenging to provide high neutron fluxes
at sample positions in order to perform scattering experiments. Despite these prob-
lems techniques have been developed that allow high neutron fluxes to be brought
to the sample position, focused over small areas. The whole range of optical solu-
tions has been considered, namely refraction, reflection and diffraction. Progress in
the field of neutron optics has accelerated in the last decade and as a consequence
has provided major improvements for all types of neutron spectrometers and their
applications.
7.1 Introduction
In the past decade, the request for higher neutron flux at the sample posi-
tion has driven research for advanced focusing neutron optics. Three main
principles have guided the techniques of focusing neutrons:
• Refraction (refractive lenses or magnetic lenses)
• Reflection (focusing guides, reflective lenses, capillary optics)
• Diffraction (Fresnel zone plates)
We discuss and compare the performances of different focusing devices
based on these principles. Presently, on neutron scattering spectrometers, the
main request is for an illumination spot of the order of a few mm up to
10 mm. Only in exceptional cases is submillimeter focusing requested. Neutron
spectrometers are usually rather large and focal lengths of several meters can
generally be accommodated. Focal lengths below 1 m are also requested for
some applications.
114 F. Ott
7.2 Characteristics of Neutron Beams
Neutrons are created in a uranium core and then moderated in a tank of
heavy water at 50
◦
C. Their energy is then of the order of 25 meV. In a num-
ber of experiments, neutrons with lower energies are required and they must
be cooled down further to energies below 5 meV. This takes place in so-called
“cold sources.” This cold source is a metal canister containing about 20 l of
liquid hydrogen or deuterium (at 25 K). This source has an isotropic emission,
and the neutrons are conducted to spectrometers using neutron guides con-
sisting of neutron reflecting walls. The cross section of the neutron tubes has
reached considerable dimensions, up to 100 cm
2
. The wavelength distribution
of the neutron spectrum is Maxwellian centered on the source temperature.
This corresponds to neutron wavelengths ranging from 0.2–2 nm. The beam
divergence in the guides is given by the angle of total reflection of the guide
coatings. For nickel coatings it is equal to 0.1
◦
˚
A
−1
. Typically for m =2super-
mirror guides, the divergence is of the order of 0.2
◦
˚
A
−1
.
There are fundamental differences in the phase space distribution between
(a) synchrotron X-ray beams, which are intrinsically small, and well col-
limated, (b) X-ray tubes in which the source is almost a point, but the
divergence is high and (c) neutron sources which are both large in size and
have a large divergence (Table 7.1).
If one puts in perspective what is expected from X-ray and neutron sources,
a comparison of typical values for the beam size and beam divergence shows
that, more or less, the neutron phase space is approximately 1,000 times less
dense than X-ray phase space. The ultimate aim in focal spots size is thus
also within this 1,000 scaling factor.
The wavelength spectrum of neutrons is quite limited compared to syn-
chrotron radiation, ranging typically from 0.5 up to 30
˚
A. The optical index
of neutrons is of the same order of magnitude as the optical index of X-rays
with the same wavelength. One advantage of neutrons is that their absorption
by matter is very small. This enables one to build devices which would not
be feasible for X-rays. Since the neutron flux is much lower than the photon
flux, one must avoid as much as possible neutron losses, and devices with a
very high efficiency are required (above 50%).
In order to maximize the number of available neutrons at the sample posi-
tion, one is usually ready to compromise on the phase-space distribution.
Tabl e 7.1. (a) Point source with low divergence (synchrotron); (b) divergent point
source (X-ray tube); (c) divergent and extended source (neutrons)
Synchrotron X-ray tube Neutrons
Beam size 100 μm 100 μm 100 mm
Divergence 10 μrad 1 rad 10 mrad (in guides)
Aimed spot 1 μm 100 μm1mm
7 Focusing Optics for Neutrons 115
A number of experiments require high resolution only in the scattering plane.
In the direction perpendicular to the scattering, a downgraded resolution can
often be accepted. In such a case, a spatially high beam is often vertically
focused on the sample position. This results in a divergent beam in the verti-
cal direction at the sample position. Going from a beam size of 100 mm down
to 10 mm typically increases the flux by a factor 10 and increases the vertical
divergence by a factor of 10.
Two possibilities can be considered to shape the phase space: reduce δx
at the expense of δθ (classical focusing on the sample); increase δx to reduce
δθ, this last solution is never considered on scattering experiments since it
would lead to nonpractical sample sizes, but it is being considered for new
geometries of neutron guides in order to increase the guide transmission over
long distances.
In the case of neutron focusing, a number of parameters affect the choice
of a specific focusing solution:
• What is the wavelength spectrum? Short or long wavelengths? Broad or
narrow wavelength spectrum?
• 1D or 2D focusing?
• Required focal length? It can range from 20 mm up to 10 m depending on
the application (e.g., neutron activation or small angle scattering)
• What is the size of the focal spot?
• Polarized/non polarized?
Depending on these characteristics, different solutions should be consid-
ered. In the following, we will present the different devices which have been
developed over the years to focus neutron beams. This field is presently evolv-
ing more rapidly than ever and a number of solutions are proposed which have
not been implemented yet on real spectrometers.
7.3 Passive Focusing: Collimating Focusing
On all neutron spectrometers, the neutron beams need to be shaped to fulfill
the requirements of the specific neutron scattering experiments. The beam
divergence needs to be tuned with respect to the required resolution. The
beam size needs to be tuned with respect to the sample size, in order to
minimize the background noise. Thus, one usually “passively” focuses and
collimates neutrons by taking advantage of the fact that the neutron beams
are large and divergent. Instead of changing the phase space distribution, one
simple reduces it. This is usually achieved by using so-called Soller collimators
(see Fig. 7.1a, b). These devices work in one dimension only and are among the
most frequently used neutron optical components. The collimating channels
are defined by absorbing gadolinium oxide on PETP foils (thickness 50 μm).
The device transmission is of the order of 90%.
116 F. Ott
Fig. 7.1. (a) Principle of a Soller collimator; (b) Real 1D and radial collimators with
a beam cross section of several cm
2
;(c) Embossed aluminum foil (left); Honeycomb
collimator (right)[1]
sample
detector
Fig. 7.2. Converging multibeam collimation
More advanced geometries have been developed. In order to perform a
collimation in two dimensions, focusing honeycomb collimators have been
developed [1]. They are made of embossed aluminum foils (0.1 mm thick)
in a hexagonal shape which are coated with Gd oxide. They are then stacked
together in order to form a honeycomb structure. The entire structure is 4 m
long with channels of 7 mm at the entrance and 6 mm at the exit.
Another efficient geometry is the geometry of focusing small angle neu-
tron scattering (SANS) spectrometers in which several well collimated neutron
beams are focused on the detector. Again, this setup takes advantage of the
fact that neutron beams are large and divergent. The principle was proposed
and implemented very early (Fig. 7.2) [2]. Such a setup is most efficient for
scattering at very small Q values which require very small collimations (pin-
holes Ø ∼ 1–2 mm). A simple pinhole geometry would provide a very small
flux. This geometry has been revived recently for two reasons: (a) the new
neutron guides are much bigger than earlier ones and this permits one to
significantly multiply the number of incoming channels, even for big pinhole
collimations ∼10–20 mm; (b) very high resolution SANS spectrometers are
required for new types of experiments. S. D´esert at the Lab. L´eon Brillouin
is developing a converging multibeam very small angle neutron scattering
7 Focusing Optics for Neutrons 117
(VSANS) spectrometer which will use about 120 beams, multiplying the
luminosity of the spectrometer by an equivalent factor.
7.4 Crystal Focusing
7.4.1 Focusing Monochromator
The earliest active focusing technique was implemented by combining the
monochromatization process with the focusing. In typical neutron scattering
experiments such as powder diffraction or triple axis spectroscopy (TAS), the
sample size is of the order of 1 cm
3
. Usually, no resolution is required in the
direction perpendicular to the scattering plane. Thus, since the incoming beam
is very high (>100 mm), the crystal monochromator can be curved to diffract
most of the intensity onto the sample (Fig. 7.3a). Usually, the monochromator
is not curved but divided into a number of subelements which have a size of the
order of 10–20 mm. In some situations where the measurement is not disturbed
by a significant divergence in the scattering plane, such as diffuse scattering
or TAS measurements, double focusing monochromators can be used.
Figure 7.3b shows an example of such a monochromator. In this case,
the curvature can be tuned with motorized movements. In the case of these
focusing monochromators, the focal spot is defined by the monochromator
crystal size (of the order of 1 cm
2
) and its mosaic (of the order of 0.5
◦
∼10 mrad) which gives an extra broadening of the beam at the sample posi-
tion (1,000 mm × 10 mrad = 10 mm). This technology is thus limited to focal
spots of the order of 20 × 20 mm
2
. The system is quite expensive but has
proven to be very efficient and reliable over the years. The limitation of the
focal spot size is determined by the finite mosaic and the size of the indi-
vidual monochromator crystals. This can be overcome with a more advanced
technology using bent perfect crystals.
(a) (b)
sample
source
mono-
chromator
Fig. 7.3. (a) Focusing using a composite monochromator. Typically, the monochro-
mator elements are 10–20 mm in size. The total height – width of the monochromator
can be larger than 100 × 100 mm
2
.(b) Double focusing monochromator consisting
of 357 graphite crystals (total surface 1,428 cm
2
) (MACS, NIST) [3]
118 F. Ott
Fig. 7.4. (a)Horizontalfocusingbyacurvedcrystalinrealspace;(b)momentum–
space representation of the diffraction by a bent crystal in the case 2δ
h
θ>> Δω [4]
7.4.2 Bent Perfect Crystal Monochromators
Another possibility to focus neutrons consists in using elastically bent per-
fect crystals. The principle is described in Fig. 7.4 [4]. Bent perfect crystals
have no mosaic structure. Their angular reflection profile is rectangular with
a width given by simple geometrical factors: bending radius, thickness, and
length of the irradiated part of the crystal. One of the crucial advantages of
the silicon crystals is the absence of second-order contamination for the hkl-
odd reflections, which avoids the use of pyrolitic graphite or beryllium filters.
The use of such bent crystals is discussedin[5].Eventhough perfect crystals
are used, which suggests that their use should be restricted to high-resolution
experiments, it is suggested that it can be a more efficientvarianttocom-
binations of mosaic crystals with Soller collimators. Such bent crystals have
been implemented on strain scanners and on TAS instruments [6,7].
7.5 Refractive Optics
7.5.1 Solid-State Lenses
A straightforward way of focusing a beam consists in using refractive optics.
Neutron Optical Index
The optical index for neutrons is given by:
n =1−
λ
2
2π
ρb −
λ
π
ρσ
a
=1−δ −iβ
where b is the coherent scattering length, ρ is the atomic density and σ
a
is
the absorption cross section. δ is the real part of the optical index, β is the
imaginary part of the optical index corresponding to the absorption in the
material. Neutron optical indices are extremely small for thermal neutron
7 Focusing Optics for Neutrons 119
Tabl e 7.2. Comparison of the possible elements for refractive optics
Element δ (×10
−6
) β (×10
−12
) δ/β (a.u.) Comment
Be 150.07.31 20.5 Handling difficult
C 186.24.9 38 Diamond
Mg 36.821.51.7
Al 33.0 110 0.3
Si 33.068 0.5
Ni 149.8 3200 0.05 High absorption
Zr 48.963.10.8
Pb 49.444.91.1
Al
2
O
3
90.485 1.1
MgF
2
80.715.20 5.3
MgO 95.226.83.6 Not stable in air
wavelengths, δ ∼10
−6
. Absorption is even smaller β ∼10
−11
.Soevenifthe
neutron refraction is very small at an interface, it is possible to multiply the
number of lenses while keeping a good transmission. The quality factor of a
material can be defined by the ratio δ/β , the ratio of the optical index to the
absorption. Table 7.2 summarizes the optical index and absorption of some
materials. Among single crystal oxide materials, Al
2
O
3
(sapphire) and MgF
2
have rather large optical indices. The absorption of MgF
2
is very low and
thus this material appears much better than sapphire. Moreover, MgF
2
is
used in UV optics which makes MgF
2
lenses readily available as off-the-shelf
components. This is the reason why most of the devices developed until now
have used this material. Other materials present a very high potential for
refractive optics such as Be and diamond. However beryllium is difficult to
handle and machine, and thus Be refractive optics has been developed only
for the field of X-rays. Until recently, the use of diamond was limited for cost
and availability reasons. However, since 2005, commercial diamond lenses have
been made available by Diamond Materials Ltd [8]. Until now they have been
evaluated only in the field of X-rays.
Since the optical index is smaller than 1, converging neutron lenses are
concave. This is an advantage since the geometry of concave lenses reduces
the absorption in the middle of the lens.
Implementations
The first report of the use of a refractive lens on a neutron spectrometer was
by Gahler et al. [9] for the search for the neutron electric dipole moment.
But the first test of refractive lenses on a neutron scattering spectrometer was
performed 20 years later by Eskildsen et al. [10, 11] following the proposal
from Snigirev et al. [12] to use Compound Refractive Lenses (CRL) on hard
X-ray spectrometers. A CRL made of 30 MgF
2
biconcave lenses was tested for
wavelengths ranging from 0.9 to 2 nm. The focal length of the device ranged
120 F. Ott
Fig. 7.5. A set of 20 MgF2 lenses implemented on a SANS machine [10]
from 1 to 6 m. Such a lens was implemented in a focusing SANS geometry
(see Fig. 7.5). The experimental results showed that gains in intensity above
15 could be achieved.
Besides focusing neutrons in SANS, it has also been proposed that refrac-
tive optics could be used to implement a neutron microscope [13].
Advantages-Drawbacks
The potential advantages of such systems are quite clear: the systems are
inexpensive (MgF
2
lenses are available as standard optical components) and
very flexible (one simply needs to remove lenses to change the focal length as
a function of the wavelength).
However, a number of drawbacks have hampered the generalization of the
use of refractive lenses on neutron spectrometers.
The low-refractive optical index reduces the use of such optics to long
wavelengths (λ>1 nm) and long focal lengths (several meters).
Neutron absorption in the optical elements is a second drawback. As soon
as one needs to handle large beams (>10 mm) which is the general situation on
neutron spectrometers, the transmission of the system decreases very quickly,
down to 10% for a beam diameter of 25 mm. This is due to two reasons. On the
one hand, the thickness of the lens increases when one goes away of the cen-
tral optical axis. Attempts have been made to build Fresnel lenses [14, 15].
These attempts have not been successful since spurious refraction effects
appear and since the machining of the lenses strongly increases the diffuse
scattering. The second problem arises from the fact that experimentally, the
absorption is not defined by the intrinsic absorption of the material but more
by inelastic scattering in the material. This could be solved by cooling the
CRL to low temperatures, typically liquid nitrogen temperature. This would
of course cancel the ease of use of room temperature CRL setups.
Diffuse scattering is a major problem. The polish finish of MgF
2
lenses
is well suited for visible light or UV light but is not yet good enough for
7 Focusing Optics for Neutrons 121
very short wavelengths. Diffuse scattering at the interfaces is important and
strongly reduces the signal to noise ratio. This hampers the implementation
of such devices on SANS spectrometers. The use of single crystal materials is
also compulsory to avoid that the sample SANS signal is overwhelmed by the
signal from the optics system.
Another limitation is that these lenses are very chromatic, with a λ
2
dependence. In the case of monochromatic spectrometers this is not a signifi-
cant issue, even though the wavelength resolution is typically 10%, since one
does not want to achieve ultimate spatial resolution on neutron spectrometers
except in the case of applications such as neutron microscopes. Chromaticity
is however a major problem for all the time-of-flight instrumentation which
cannot benefit from such optical systems.
Significant research is still required to achieve viable refractive optics sys-
tems, on materials (use of diamond?), on polishing techniques and on the
development of suitable cooling systems.
7.5.2 Magnetic Lenses
Neutrons carry a spin which leads to a large neutron-magnetic induc-
tion interaction. Thus, neutrons are deflected by magnetic field gradients
(Stern–Gerlach effect). The deflection force applied to a neutron is given
by F
x
= ±μ
n
· grad B
x
, depending on the neutron polarization parallel
and antiparallel with respect to the direction of the magnetic field. In a
sextupole magnetic field, the equation of motion can be approximated by
d
2
r/dt
2
= ±ω
2
r,withω
2
= αG, α =|μ/m|=5.77 m
2
s
−2
T
−1
and the sex-
tupole field |B|=(G/2)r
2
[16]. Such a magnetic configuration acts as a
focusing lens for one of the neutron spin states (see Fig. 7.6).
The magnitude of the effect is not very large: it is of the order of the refrac-
tion through a solid lens. However, since it is proportional to λ
2
, it becomes
significant for long wavelengths. The key advantage of magnetic focusing is
that no material is put into the beam path. Hence, no diffuse scattering occurs.
Extra degrees of freedom are provided by the fact that the magnetic field can
Fig. 7.6. Hexapole magnetic lens. One of the spin states is focused; the other spin
state is defocused [17]
122 F. Ott
be easily tuned or modulated in time. Of course, such a device requires polar-
ized neutron beams since one of the spin-states is focused while the other spin
state is defocused. This reduces the efficiency of such a device to a maximum
of 50% (unless one is interested in polarized neutrons).
A first sextupole magnet device was built by Shimizu et al. [17] using
permanent magnets to demonstrate the feasibility of such a lens (with G =
32,000 T m
−2
). The intensity gain was 30 for λ =14.4
˚
A. One of the limita-
tions was that the lens was very long (2 m) and the inner diameter was limited
(9 mm), thus only a small fraction of the beam could be used.
Subsequently, a 2 m long superconducting sextupole magnet (SSM) with an
aperture diameter of 46.8 mm was developed [16]. The SSM consists of Nb/Ti
superconducting coils and achieves a field gradient of G =1.28 ×10
4
Tm
−2
.
The focal length is of the order of 1.5 m for λ =13.5
˚
A neutrons. Demonstra-
tion experiments have been performed [18].
The latest developments in magnetic lenses consist in modulating the mag-
netic field in time so as to be able to focus white neutron beams and to be able
to implement such lenses on ToF spectrometers and spallation sources [19].
7.5.3 Reflective Optics
A number of different reflective optics systems have been proposed in the
past (Lobster eye, stacked layers ). In the last decade, the progress in thin
film deposition has made it possible to design neutron mirrors consisting of
thousands of layers which artificially increases the optical index by a factor
up to 6 compared to nickel. This opens up new possibilities in the field of
reflective optics since one is not limited anymore by the very small angle of
total reflection. Optical systems employing elliptical or parabolic shapes are
being designed, potentially providing tremendous increases in the neutron flux
at the sample position.
The field of reflective optics is the field in which the largest variety of
solutions have been designed and evaluated. This is mostly due to the fact
that the needs are very different from one spectrometer to the other and
different solutions must be designed to solve specific issues.
7.5.4 Base Elements
Neutron supermirrors are the base elements for the fabrication of most
reflective optics. Multilayer coatings allow one to increase the angle of total
reflection to value up to six times the critical angle of natural Ni coatings.
The critical angle of reflection can thus go up to 0.6
◦
˚
A
−1
. The reflectivity of
neutron supermirrors is usually very high (up to R =0.8) at the critical angle
of reflection. This is higher than what can be achieved for X-rays because the
absorption of neutrons is very low and makes possible to design supermirrors
with several thousand layers. Figure 7.7 illustrates the reflectivity of neutron
7 Focusing Optics for Neutrons 123
Fig. 7.7. Neutron supermirrors available from Mirrotron Ltd.
Fig. 7.8. Flat tapered guide (2 m long)
supermirrors available from Mirrotron Ltd. The reflectivity is close to 80%
at m =4.
7.5.5 Focusing Guides (Tapered: Elliptic: Parabolic)
The easiest way to collect more neutrons from a large source consists in using
a flat tapered guide. Such devices are very simple to build since they use
standard flat supermirror substrates. Figure 7.8 shows a square tapered guide.
The size of the exit is reduced by a factor of two with respect to the entrance.
Thus, the flux density at the guide exit is multiplied by a factor of four at
the expense of an increased beam divergence. One drawback of such a device
is that the beam quickly expands after the exit of the guide, the more so as
the beam divergence is increased, and the sample must thus be positioned
very close to the guide exit to benefit from the flux increase. Such guides are
routinely implemented on neutron spectrometers.
More recently, guide profiles with more complex shapes, parabolic, or ellip-
tical, have been proposed. Such guides can be built at relatively low costs since
one is not aiming at sub-μm resolution. The mechanical tolerances are large,
and thus deviation from a perfect profile is not an issue.
It is possible to compare the different types of focusing guides in the most
usual situation where a neutron beam is available from a large straight guide.
Consider a beam which is 80 mm high and which exits from a straight 2θ
c
124 F. Ott
Fig. 7.9. Comparison of a tapered, elliptic, and parabolic guide to focus the exit
of a straight neutron guide. (a) The different focusing geometries, tapered, elliptic,
parabolic; (b) flux distribution at the sample position; (c) position/divergence plot
guide. The aim is to maximize the flux on a 1 cm
2
sample. It corresponds to
the geometry of a focusing reflectometer.
The comparison between different solutions (Fig. 7.9) gives the following
results:
• Tapered guide: Total transmission = 68% (30% of the flux over 10 mm)
• Parabolic guide: Total transmission = 81% (43%)
• Elliptical guide: Total transmission = 86% (52%)
The elliptical guide provides the most complex divergence distribution.
One must note that the improvement of the performances is only of the order
7 Focusing Optics for Neutrons 125
of 70% as compared to the tapered guide. The parabolic guide would be most
efficient with a point source. The elliptical guide offers the highest flexibility.
The performance could be slightly improved if a closer position of the sample
was possible: 51% at 400 mm, 71% at 100 mm. This gain is negligible compared
to the accompanying constraints.
The previous situation applies to the case of a facility where the main
guides are already in place and where one wants to maximize the flux at the
sample position. However, in the case of the design of new spectrometers, the
entire beam delivery system should be optimized, including the primary guide.
7.5.6 Ballistic Guides: Neutron Beam Delivery
over Large Distances
In general, one wants to transfer as much neutron intensity from the cold (or
thermal) source to the sample position. Until recently, this was achieved by
using neutron guides (with a square section of the order of 100×50 mm
2
)which
were bringing the neutrons outside the reactor into an experimental hall where
the spectrometers are located. In the previous decade, the spectrometers were
optimized to make the best use of the flux in these guides. The trend in the
design of new spectrometers is to optimize the setup from the source to the
sample and specifically to optimize the guide geometry for the specific need of
the spectrometer. This assumes that each spectrometer has its own dedicated
guide. The space between the cold source and the spectrometer position is
very large (from 10 m to several tens of meters). This makes possible the
implementation of complex optical systems.
The first optimization consists in increasing the amount of neutrons effec-
tively brought to the spectrometer. With the implementation of neutron
supermirror guides (with m =2 or m = 3), the flux at short wavelengths has
been significantly increased (Fig. 7.10). However, the problem is that, contrary
to nickel coatings, the reflectivity of supermirrors is of the order of 0.8. Thus
Fig. 7.10. Flux in a nickel guide and in a supermirror guide
126 F. Ott
(a)
(b)
(c)
Fig. 7.11. Principle of a ballistic guide: (a) straight guide, (b) perfect ballistic
guide, (c) approximation of the ballistic guide
after five reflections, the transmission is reduced to 30%. This means that long
supermirror guides are inefficient, besides being expensive. For guides longer
than 30m, the losses outweigh the gains.
Recently, it has been proposed to implement so-called “ballistic guides”
[20]. The principle consists in first expanding the neutron beam so as to reduce
its divergence, let it travel a long distance, and eventually refocus it onto the
sample at the end of the free flight travel. This makes it possible to reduce
the number of reflections by getting closer to a parallel beam. Figure 7.11
illustrates this principle. If the source is small, the beam could be made par-
allel with a parabolic beam expander. In real life, the source is not so small.
The first implementation of such a ballistic guide was approximated by using
first a “tapered” section which mimics the parabolic expansion of the beam.
A straight nickel guide avoids losing the neutrons which are too divergent.
This section is quite efficient since the divergence of the beam is small. The
beam is then refocused onto the sample with a second tapered section. The
cost of such a guide is moderate since a simple nickel coating can be used over
most of the guide length.
The first implementation of such a system was done on the guide H113
at the ILL [21]. The initial section is 6 cm and is increased to 9 cm. The gain
in flux at the sample position was a factor of 4 for a guide length of 72 m.
A detailed description of the characteristics of this guide has been published
in [22].
More recently, more complex shapes have been considered for neutron
guides. A detailed comparison of the different geometries (tapered, elliptic,
and parabolic) has been made [23]. It appears that an ellipse is by far the
best geometry which provides the highest neutron flux as well as the best flux
homogeneity at the exit. A thorough comparison with other systems has been
published [24].
Small scale parabolic guides consisting of four bent supermirrors have
recently been made and tested [25]. The entrance was 16 ×16 mm
2
,theexit
was 3.2 ×3.2mm
2
.Thefocalspotachievedwas1mm
2
. Better result, in terms
7 Focusing Optics for Neutrons 127
of the beam homogeneity and focal length, have since then been obtained by
using elliptical shapes.
7.5.7 Reflective Lenses
A large number of solutions have been devised to fabricate lenses based on
reflection.
Focusing Bender
Silicon is a very transparent material for neutrons. Thus by coating silicon
wafers with neutron supermirrors and stacking the substrates, it is possible
to build neutron channels with a large angular acceptance. By properly bend-
ing the stack, it is possible to focus the neutrons at a given position (see
Fig. 7.12). The principle is very similar to polycapillary systems except that
(a) it is possible to coat the inner part of the channel walls with supermirrors
(possibly polarizing) and thus to have a large angular acceptance and (b) the
transmission is close to 90% since Si is transparent. The drawbacks are (a) the
focalization is only one dimensional and (b) the focal spot increases quickly in
size because of the intrinsic divergence of the beam at the exit of the channel.
Lobster Eye Optics
A number of solutions have been proposed which are based on the princi-
ple of the so-called Lobster eye optics (Fig. 7.13) [26]. This principle seems
very appealing in theory. In practice, a number of difficulties have been
Fig. 7.12. Focusing bender (T. Krist, HMI)
source
image
Fig. 7.13. Lobster eye optics [26]