Applied Radiological Anatomy for Medical Students Applied - part 2 pptx
Bạn đang xem bản rút gọn của tài liệu. Xem và tải ngay bản đầy đủ của tài liệu tại đây (1.13 MB, 18 trang )
and velocity of flow. Spectral Doppler is a graphical display with time
on the horizontal axis, frequency on the vertical axis and brightness
of the tracing indicating the number of echoes at each specific fre-
quency (and therefore blood cell velocity). A combined gray-scale and
spectral Doppler display is known as a duplex scan. Power Doppler
imaging discards the direction and velocity information but is about
10ϫ more sensitive to flow than normal color Doppler.
Doppler ultrasound is used to image blood vessels and to examine
tissues for vascularity (fig. 1.13 – see color plate section).
Ultrasound contrast agents
Contrast agents have been developed for ultrasound consisting of tiny
“microbubbles” of gas small enough to cross the capillary bed of the
lungs. These are safe for injection into the bloodstream and are very
highly reflective; they can be used to improve the imaging of blood
vessels and to examine the filling patterns of liver lesions.
Ultrasound artifacts
Acoustic shadowing
Produced by near complete absorption or reflection of the ultrasound
beam, obscuring deeper structures. Acoustic shadows are produced by
bone, calcified structures (such as gall bladder and kidney stones), gas
in bowel, and metallic structures.
Acoustic enhancement
Structures that transmit sound well such as fluid-filled structures
(bladder, cysts) cause an increased intensity of echoes deep to the
structure.
Reverberation artifact
Repeated, bouncing echoes between strong acoustic reflectors cause
multiple echoes from the same structure, shown as repeating bands
of echoes at regularly spaced intervals.
Mirror image artifact
A strong reflector can cause duplication of echoes, giving the appear-
ance of duplication of structures above and below the reflector.
“Ring down” artifact
A pattern of tapering bright echoes trailing from small bright
reflectors such as air bubbles.
Advantages and limitations of ultrasound
Ultrasound provides images in real time so can be used to image
movement of structures such as heart valves and patterns of blood
flow within vessels. As far as is known, ultrasound used at diagnostic
intensities does not cause tissue damage and can be used to image
sensitive structures such as the developing fetus. Patients usually find
ultrasound examination easy to tolerate, as it requires minimal prepa-
ration and only light pressure on the skin. Portable ultrasound
systems suitable for use at the bedside are widely available.
The main limitation of the technique is that parts of the body acces-
sible to ultrasound examination are limited. Ultrasound does not
easily cross a tissue–gas or tissue–bone interface, so can only be used
for imaging tissues around such structures with any tissues deep to
gas or bone obscured. It is not generally useful in the lungs and head,
except in neonates where the open fontanelles provide an acoustic
window. Ultrasound is also heavily operator dependent, particularly
in overcoming barriers due to the bony skeleton and bowel gas, and
in interpreting artifacts, which are common.
Computed tomography
Computed tomography (CT) was invented in the 1970s, earning its
chief inventor, Sir Godfrey Hounsfield, the Nobel Prize for medicine
in 1979. CT was the first fully digital imaging technique that provided
cross-sectional images of any anatomical structure.
Basic principles
Current generation CT scanners use the same basic technology as
the first clinical EMI machine in 1972. In conventional CT, the X-ray
tube and detector rotate around the patient with the table stationary.
The X-ray beam is attenuated by absorption and scatter as it passes
through the patient with the detector measuring transmission
(fig. 1.14). Multiple measurements are taken from different directions
as the tube and detector rotate. A computer reconstructs the image
for this single “slice.” The patient and table are then moved to the
next slice position and the next image is obtained.
An introduction to the technology of imaging thomas h. bryant and adam d. waldman
7
Fig. 1.12. A stone within the gall bladder shows as a bright echo with black
“acoustic shadow” behind it, the result of almost complete reflection of the
ultrasound hitting it. The fluid in the gall bladder appears black as the contents
of the gall bladder are homogeneous and there are no internal structures to
cause echoes or changes in attenuation; the adjacent liver is more complex in
structure and causes more reflection of sound, so appears gray.
X-ray tube
Detector
Fig. 1.14. Diagram of a
typical CT scanner. The
patient is placed on
the couch and the X-ray
tube rotates 360° around
the patient, producing
pulses of radiation that
pass through the patient.
The detectors rotate
with the tube, on the
other side of the patient
detect the attenuated
X-ray pulse. This data is
sent to a computer for
reconstruction.
In spiral (helical) CT the X-ray tube rotates continuously while the
patient and table move through the scanner. Instead of obtaining data
as individual slices, a block of data in the form of a helix is obtained.
Scans can be performed during a single breath hold, which reduces
misregistration artifacts, such as occur when a patient has a different
depth of inspiration between conventional scans. A typical CT scanner
is shown in Fig. 1.15.
Image reconstruction
To convert the vast amount of raw data obtained during scanning to
the image requires mathematical transformation. Depending on the
parameters used (known as “kernels”), it is possible to get either a
high spatial resolution (at the expense of higher noise levels) used for
lung and bone imaging, or a high signal to noise ratio (at the expense
of lower resolution) used for soft tissues.
The CT image consists of a matrix of image elements (pixels) usually
256 ϫ 256 or 512 ϫ 512 pixels. Each of these displays a gray scale inten-
sity value representing the X-ray attenuation of the corresponding
block of tissue, known as a voxel (a three-dimensional “volume
element”).
CT scanners operate at relatively high diagnostic X-ray energies, in
the order of 100 kV. At these energies, the majority of X-ray-tissue
interactions are by Compton scatter, so the attenuation of the X-ray
beam is directly proportional to the density of the tissues. The inten-
sity value is scored in Hounsfield units (HU). By definition, water is
0 HU and air Ϫ1000 HU and the values are assigned proportionately.
These values can be used to differentiate between tissue types. Air
(Ϫ1000 HU) and fat (Ϫ100 HU) have negative values, most soft tissues
have values just higher than water (0 HU), e.g., muscle (30 HU),
liver (60 HU), while bone and calcified structures have values of
200–900 HU. The contrast resolution of CT depends on the differences
between these values, the larger the better. Although better than plain
X-ray in differentiating soft tissue types, CT is not a good as magnetic
resonance imaging (MRI). For applications in the lungs and bone
(where the differences in attenuation values are large), CT is generally
better than MRI.
The use of intravenous contrast agents can increase the contrast res-
olution in soft tissues as different tissues show differences in enhance-
ment patterns. Oral contrast can outline the lumen of bowel and
allow differentiation of bowel contents and soft tissues within the
abdomen. Usually iodinated contrast agents are used for CT, although
a dilute barium solution can be used as bowel contrast.
Window and level
The human eye cannot appreciate anywhere near the 4000 or so gray
scale values obtained in a single CT slice. If the full range of recon-
structed values were all displayed so as to cover all perceived
brightness values uniformly, a great deal of information would be lost
as the viewer would not be able to distinguish the tiny differences
between differing HU values. By restricting the range of gray scale
information displayed, more subtle variations in intensity can be
shown. This is done by varying the range (“window width”) and
centre (“window level”) (Fig. 1.16).
Spiral CT and pitch
In conventional, incremental CT the parameters describing the proce-
dure are slice width and table increment (the movement of the table
between slices). With spiral CT, the patient, lying on the couch, moves
into the scanner as the tube and detectors rotate in a continuous
movement, rather than the couch remaining still while each “slice” is
acquired. The information during spiral CT is obtained as a continu-
ous stream and is reconstructed into slices.
The parameters for spiral CT are slice collimation (the width of the
X-ray beam and therefore the amount of the patient covered per rota-
tion), table feed per rotation, and the reconstruction increment.
A spiral CT covers the whole volume even if the table feed is greater
than the collimation – it is possible to scan with a table feed up to
twice the collimation without major loss of image quality. Often,
scans are described by their pitch where pitch ϭ table feed/collima-
tion. Typical values for collimation (slice thickness) are 1–10 mm with
rotation times of 0.5–3 seconds.
To reconstruct from the helical volume, it is necessary to interpolate
the projections of one scanner rotation. It is not necessary to recon-
struct as consecutive slices – slices with any amount of overlap can be
created.
Multi-detector CT
CT scanners are now available with multiple rows of detectors (at
the time of writing, commonly 64) allowing acquisition of multiple
slices in one spiral acquisition. In conjunction with fast rotation
speeds, the volume coverage and speed performance are improved
allowing, for instance, an abdomen and pelvis to be scanned with an
acquisition slice thickness of 1.25 mm in about quarter the time
(approximately 10 seconds) that a 10 mm collimation CT scanner
could cover the same volume, with the same or lesser radiation dose.
The main problem with this type of scanning is the number of
images acquired; 300–400 in the example above instead of about 40
with single slice techniques.
Advanced image reconstructions
From the spiral dataset, further reconstructions can be performed.
Multiplanar reformats (MPR) can be performed in any selected plane,
although usually in the coronal and sagittal planes (Fig. 1.17). Three-
dimensional reconstructions can also be obtained using techniques
An introduction to the technology of imaging thomas h. bryant and adam d. waldman
8
Fig. 1.15. A multi-slice CT
scanner.
An introduction to the technology of imaging thomas h. bryant and adam d. waldman
9
1500
–1500
1500
–1500
1500
–1500
1500
–1500
(a) (b)
(c)
(d)
Fig. 1.16. The effect of changing window levels and reconstruction algorithm on a single axial image through the chest. The dark bar indicated the range of values
displayed, the light bar the range of values available. (a) “Soft tissue” window with window level of 350 and centre 50; (b) “bone window” with window level 1500
and centre 500; (c) lung window with window level 1500 and centre Ϫ500; and (d) an HRCT (high resolution CT image) – this is a thin slice image reconstructed
using an edge enhancement (bone or lung) algorithm, which shows better detail in the lung but increases “noise” levels, window 1500, centre Ϫ500.
such as surface-shaded display and volume rendering (Fig. 1.18
– see
color plate section
). While the 3-D techniques provide attractive
images and are useful in giving an overview of complex anatomical
structures, a lot of information from the original axial data set is
often discarded. Virtual endoscopy uses a 3-D “central” projection to
give the effect of viewing a hollow viscus interiorly (as is seen in
endoscopic examination) and is of particular use in patients too frail
or ill to have invasive endoscopy.
Streak artifact
The reconstruction algorithms cannot deal with the differences in
X-ray attenuation between very high-density objects such as metal
clips or fillings in the teeth and the adjacent tissues and produce high
attenuation streaks running from the dense object (Fig. 1.19).
Advantages and limitations of CT
CT provides a rapid, non-invasive method of assessing patients.
A whole body scan can be performed in a few seconds on a modern
multislice scanner with very good anatomical detail. CT is particu-
larly suited to high X-ray contrast structures such as the bones and
the lungs, and remains the cross-sectional imaging modality of
choice for assessing these. It has less contrast resolution than MRI
for soft tissue structures particularly for intracranial imaging,
spinal imaging, and musculoskeletal imaging. CT has no major
contraindications (although the use of contrast might have), provid-
ing the patient can tolerate the scan. The major disadvantage is in
the significant radiation doses required for CT. An abdominal or
pelvic CT involves 3–12 mSv of radiation, compared with a chest
X-ray’s 0.02 mSv or background radiation in the UK averaging
2.5 mSv per year.
Magnetic resonance imaging (MRI)
Nuclear magnetic resonance was first described in 1946 as a tool for
determining molecular structure. The ability to produce an image
based on the distribution of hydrogen nuclei within a sample, the
basis of the modern MRI scanner, was first described in 1973 and the
first commercial body scanner was launched in 1978. A modern MRI
scanner is shown in Fig. 1.20.
An introduction to the technology of imaging thomas h. bryant and adam d. waldman
10
HRCT
High resolution CT or HRCT is used to image the lungs. Thin slices
are acquired – usually 1 to 2 mm thick at 10–20 mm intervals. These are
reconstructed using edge enhancement (bone or lung) algorithms
showing better detail in the lung but increasing “noise” levels (Fig. 1.16).
This allows fine details of lung anatomy to be seen. The whole lung
volume is not scanned, as there are gaps between the slices.
CT artifacts
Volume averaging
A single CT slice of 10 mm thickness can contain more than one tissue
type within each voxel (for example, bone and lung). The CT number
for that voxel will be an average of the different sorts of tissue within
it, so very small structures can be “averaged out” or if a structure with
low CT number is adjacent to one with a high CT number, the appar-
ent tissue density will be somewhere in between. This is known as
a “partial volume effect.”
Beam hardening artifact
This results from greater attenuation of low-energy photons than
high-energy photons as the beam passes through the tissue. The
average energy of the X-ray beam increases so there is less attenuation
at the end of the beam than at the beginning, giving streaks of low
density extending from areas of high density such as bones.
Motion artifact
This occurs when there is movement of structures during image
acquisition and shows up as blurred or duplicated images, or as
streaking.
Fig. 1.17. (a) Sagittal and (b) coronal reformats of a helical scan through the abdomen and pelvis. The data from the axial slices is rearranged to give different
projections.
(a) (b)
Basic principles
Detailed explanation of the complicated physics of MRI is beyond the
scope of this chapter. More detailed descriptions of MRI, using a rela-
tively accessible and non-mathematical approach, may be found in the
recommended texts for further reading below.
MRI involves the use of magnetic fields and radio waves to produce
tomographic images. Normal clinical applications involve the imaging
of hydrogen nuclei (protons) only, although other atoms possessing a
“net magnetic moment,” such as phosphorus 31, can also be used. As
most protons in biological tissues are in water, clinical MRI is mainly
about imaging water.
The protons in the patient’s tissues can be thought of as containing
tiny bar magnets, which are normally randomly oriented in space.
The patient is placed within a strong magnetic field, which causes a
small proportion (about two per million) of the atomic nuclei to align
in the direction of the field and spin (precess) at a specific frequency.
Current magnets typically use a 1.5 tesla field, about 30 000 times the
earth’s natural magnetic field. When radio waves (radio frequency, RF)
are applied at the specific (resonance) frequency, energy is absorbed
by the nuclei, causing them all to precess together, and causing some
to flip their orientation. When the transmitter is turned off, these flip
back to their equilibrium position, stop precessing together and emit
radiowaves, which are detectable by an aerial and amplified electroni-
cally. The frequency of resonance is proportional to the magnetic field
that the proton experiences.
The signal is localized in the patient by the use of smaller magnetic
field gradients across and along the patient (in all three planes). These
cause a predictable variation in the magnetic field strength and in
the resonant frequency in different parts of the patient. By varying
the times at which the gradient fields are switched on in relation to
applying radio frequency pulses, and by analysis of the frequency and
phase information of the emitted radio signal, a computer is able to
construct a three-dimensional image of the patient.
The proton relaxes to a lower energy state by two main processes,
called longitudinal recovery (which has a recovery time, T1) and trans-
verse relaxation (with a relaxation time, T2), and re-emits its energy
as radiowaves. The relative proportions of T1 and T2 vary between
different tissues.
An introduction to the technology of imaging thomas h. bryant and adam d. waldman
11
(a)
(b)
Fig. 1.19. (a) Movement artifact in a CT head scan. There is blurring and streaking following movement of the head. (b) Streak artifact from screws and rods used
to immobilize the lumbar spine.
Fig. 1.20. A magnetic resonance (MR) scanner.
T1 times are long in water and shorten when larger molecules are
present so cerebrospinal fluid (which is largely water) has a T1 time
of about 1500 milliseconds, while muscle (which has water bound to
proteins) has a T1 time of 500 milliseconds and fat (which has its own
protons, much more tightly bound than those in water) has a very
short T1 time of about 230 ms. T2 relaxation times largely depends
on tiny local variations in magnetic field due to the presence of
neighbouring nuclei. In pure water, T2 times are long (similar to T1
times); in solid structures there is very much more effect from the
neighbouring nuclei and T2 times can be only a few milliseconds.
By altering the pulse sequence and scanning parameters, one or
other process can be emphasized, hence T1 weighted (T1W) scans
where signal intensity is most sensitive to changes in T1, and T2
weighted (T2W) scans where signal intensity is most sensitive to
changes in T2. This allows signal contrast between different normal
tissue types to be optimized, such as gray and white matter and cere-
brospinal fluid in the brain, and pathological foci to be accentuated.
There are a number of ways in which the magnetic field gradients
and RF pulses can be used to generate different types of MR images
T1 and T2 weighting and proton density
Standard spin echo sequences produce standard T1 weighted (T1W), T2
weighted (T2W) and proton density (PD) scans. T1W scans traditionally
provide the best anatomic detail. T2W scans usually provide the most
sensitive detection of pathology. Proton density-weighted images
make T1 and T2 relaxation times less important and instead provide
information about the density of protons within the tissue.
In the brain, cerebrospinal fluid (mainly water) is dark on T1W scans
and bright on T2W scans (Fig. 1.21).
Inversion recovery (IR) sequences
These sequences emphasize differences in T1 relaxation times of
tissues. The MR operator selects a delay time, called the inversion
time, which is added to the TR and TE settings. Short tau (T1) inver-
sion time (STIR) sequences are the most commonly used and suppress
the signal from fat while emphasizing tissues with high water content
as high signal, including most areas of pathology. Fluid attenuated
inversion-recovery (FLAIR) sequences have a longer inversion time and
An introduction to the technology of imaging thomas h. bryant and adam d. waldman
12
(a)
(b)
(c)
Fig. 1.21. (a) Coronal T1W, (b) sagittal T2W and (c) axial FLAIR slices through
the brain. Cerebrospinal fluid is low signal (black) on the T1W and FLAIR images
but high signal (white) on the T2W image.
are used to image the brain as they null the signal from cerebrospinal
fluid, improving conspicuity of pathology in adjacent structures. FLAIR
images are mostly T2 weighted but CSF looks darker (Fig. 1.21).
Turbo (fast) spin echo and echo-planar imaging
These are faster MR techniques that produce multiple slices in shorter
times. There is an image quality penalty to be paid for faster acquisi-
tions and artifacts may manifest differently.
Gradient recalled echo or gradient echo sequences
Gradient echo (GE or GRE) sequences use gradient field changes
rather than RF pulse sequences. Gradient echo sequences can be T1W
or T2W, although the T2W images are actually T2* (“T2 star”), which is a
less “pure” form of T2 weighting than in spin echo. Artifacts tend to be
more prominent in gradient techniques, particularly those due to local
disturbances of the magnetic
fi
eld because of the presence of tissue
interfaces and metal (including iron in blood degradation products).
Fat suppression
Fat-containing tissues have high signal on both T1W and T2W scans.
This can overwhelm the signal from adjacent structures of more
interest, so MR sequences have been developed to reduce the signal
from fat. The STIR sequence described above is one of these. Fat
saturation is another technique that can be used in which a presatura-
tion RF pulse tuned to the resonant frequency of fat protons is applied
to the tissues before the main pulse sequence, causing a nulling of the
signal from the fatty tissues (Fig. 1.22).
Diffusion-weighted imaging (DWI)
Changes in the diffusion of tissue water can be visualized using this
technique, which relies on small random movements of the molecules
changing the distribution of phases. This technique is used to image
pathology within the brain, particularly early ischemic strokes.
MR angiography
MR angiograms often use a “time of flight” sequence where the
inflowing blood is saturated with a preliminary RF pulse sequence,
or use MR contrast agents. In these, flowing blood in vessels is of high
signal. A MR angiogram is usually viewed as a maximum intensity
projection or MIP (Fig. 1.23). To create an MIP, only the high signal
structures are shown and all the MR slices are compressed together
(or projected) to give a single view as if looking at the subject from
a particular angle. Usually, projections from multiple angles are
used. Other methods relying on phase contrast or injected intravas-
cular contrast media may also be used.
An introduction to the technology of imaging thomas h. bryant and adam d. waldman
13
(a) (b)
Fig. 1.22. MR images of the upper part of the thorax showing the brachial plexus, demonstrating the effects of fat suppression. On the T1W sequence (a), the fat is
high signal (white) and on the STIR sequence (b) the signal from fat is reduced.
Fig. 1.23. A single MIP (maximum intensity projection) view from an MR
angiogram showing the large vessels of the intracerebral circulation. This
angiogram has been created from a time-of-flight (TOF) scanning sequence.
Magnetic resonance cholangiopancreaticogram
MRCP or magnetic resonance cholangiopancreaticography images are
used to image the biliary system non-invasively, and are created as a
MIP of a sequence in which fluid is of high signal.
MR artifacts
Ferromagnetic artifact
All ferromagnetic objects, such as orthopedic implants, surgical clips
and wire, dental fillings, and metallic foreign bodies cause major
distortions in the main magnetic field, giving areas of signal void and
distortion (Fig. 1.24). Even tattoos and mascara can contain enough
ferromagnetic pigments to cause a significant reduction in image
quality.
Susceptibility artifact
This is due to local changes in the field from to the differing
magnetisation of tissue types, rather like a less pronounced form
of ferromagnetic artifact. Susceptibility artifacts usually occur at inter-
faces between other tissue types and bone or air-filled structures.
Motion artifact
The acquisition time for MR is relatively lengthy and image degrada-
tion due to movement artifacts is common. General movement,
including breathing, causes blurring of the image. Pulsation from
blood vessels causes ghosts of the moving structures (Fig. 1.25)
Chemical shift artifact
This occurs at interfaces between fat and water. Protons in fat have a
slightly different resonance frequency compared with those in water,
which can lead to a misregistration of their location. This gives a high
signal–low signal line on either side of the interface.
Aliasing (wraparound) artifact
This can occur when part of the anatomy outside the field of view of
the scan is incorrectly placed within the image, on the opposite side.
This occurs in the phase encoding direction and can be removed by
An introduction to the technology of imaging thomas h. bryant and adam d. waldman
14
(a)
(b)
Fig. 1.24. (a) Sagittal T1W and b) coronal T2W images from an MR examination of the spine in a patient who has had surgery with metal screws and rods along the
lower spine. There is marked loss of signal and distortion of the surrounding structures over most of the scan.
Fig. 1.25
.
Axial T
2
W image of the brain in a patient unable to lie sufficiently still.
increasing the field of view (although at the expense of either resolu-
tion or time). It is common in echo planar imaging.
MRI safety
MR is contraindicated in patients with electrically, magnetically, or
mechanically activated implants including cardiac pacemakers,
cochlear implants, neurostimulators and insulin, and other implantable
drug infusion pumps. Ferromagnetic implants such as cerebral
aneurysm clips and surgical staples, and bullets, shrapnel, and metal
fragments can move. Patients with a history of metallic foreign bodies
in the eye should be screened with radiographs of the orbits.
A number of implants have been shown to be safe for MR including
non-ferrous surgical clips and orthopedic devices made from non-
ferrous metals. Contemporary devices are largely MRI compatible,
although older ones may not be.
MR magnetic fields can induce electrical currents in conductors,
such as in cables for monitoring equipment attached to the patient
(e.g., ECG leads), with a risk of electric shock to the patient. Any
monitor leads must be carefully designed and tested for MR compati-
bility to avoid this possibility.
There is no evidence that MR harms the developing fetus. Pregnant
patients can be scanned, although as a precaution MR is not usually
performed in the first 3 months of pregnancy.
Advantages of MR
MR allows outstanding soft tissue contrast resolution and allows
images to be created in any plane. No ionizing radiation is involved.
It gives limited detail in structures such as cortical bone and
calcification, which return negligible signal. MR has long scanning
times in relation to other techniques and requires patients to be sta-
tionary while the scan is performed. Because of long imaging times
and complexity of the equipment, MR is relatively expensive. The
space within the magnet is restricted (a long tunnel) and some
patients experience claustrophobia and are unable to tolerate the
scan. Access to medically unstable patients is hindered and special,
MR compatible, monitoring equipment is required.
Nuclear medicine
Nuclear medicine involves the imaging of Gamma rays (
␥
-rays), a type
of electromagnetic radiation. The difference between
␥
-rays and X-rays
is that
␥
-rays are produced from within the nucleus of the atom when
unstable nuclei undergo transition (decay) to a more stable state,
while X-rays are produced by bombarding the atom with electrons.
Nuclear medicine imaging therefore is emission imaging – the
␥
-rays
are produced within the patient and the photons are emitted from the
subject and then detected.
Radiopharmaceuticals
The
␥
-ray emitter must first be administered to the patient – the sub-
stance given is known as a radiopharmaceutical. These consist of
either radioactive isotopes by themselves, or more commonly
radioisotopes (usually called radionuclides) attached to some other
molecule. Radionuclides can be created in nuclear reactors, in
cyclotrons and from generators. The most commonly used
radionuclide is Technetium 99 m (Tc-99 m), which is produced from a
generator containing Molybdenum-99 that is first created in a nuclear
reactor as a product of Uranium-235 fission. Isotopes of iodine,
krypton, phosphorus, gallium, indium, chromium, cobalt, fluorine,
thallium, and strontium are all in regular use. Radiopharmaceuticals
are normally administered by injection into the venous system but are
also administered orally, directly into body cavities, and by injection
into soft tissues.
The gamma camera
Standard nuclear medicine images are acquired using a gamma
camera (Fig. 1.26). The basic detector in the gamma camera consists of
a sodium iodide crystal that emits light photons when struck by a
␥
-ray, with photo-multiplier tubes to detect the light photons emitted.
The photo-multiplier tube produces an electrical voltage that is con-
verted by the electronic and computer circuitry to a “dot” on the final
image. The build-up of dots gives the final image (Fig. 1.27). Between
the patient and the detector is a collimator which consists of a large
lead block with holes in it that select only photons travelling at right
angles to the detector. Those passing at an angle do not contribute to
the image.
Single photon emission computed tomography (SPECT)
Computed tomography (CT, described above) allows the reconstruc-
tion of a three dimensional image from multiple projections of an
external X-ray beam. A similar effect can be obtained in nuclear medi-
cine with reconstruction of emissions of radionuclide within the
patient from different projections. This is usually achieved by rotating
the gamma camera head around the patient.
SPECT has the advantage of improving image contrast by minimiz-
ing the image activity present from overlying structures in a two-
dimensional acquisition and allows improved three-dimensional
localization of radiopharmaceuticals.
Positron emission tomography (PET)
PET deals with the detection and imaging of positron emitting
radionuclides. A positron is a negative electron, a tiny particle of
antimatter. Positrons are emitted from the decay of proton rich
radionuclides such as carbon-11, nitrogen-13, oxygen-15 and fluorine-
18. When a positron is emitted, it travels a short distance (a few mm)
before encountering an electron; the electron and positron are
An introduction to the technology of imaging thomas h. bryant and adam d. waldman
15
Fig. 1.26. A gamma camera.
PET CT
Manufacturers have now combined PET and CT in a single scanner in
which the PET image is coregistered with CT. This improves the
anatomical accuracy of PET and is valuable in localizing disseminated
disease, notably cancer.
PET CT is particularly helpful in recurrent cancers of the head
and neck where post surgical change and scarring can mask new
disease
Advantages of nuclear medicine
Isotope scans provide excellent physiological and functional infor-
mation. They can often indicate the site of disease before there has
been sufficient disruption of anatomy for it to be visible on other
imaging techniques. Scans can be repeated over time to show the
movement or uptake of radionuclide tracers. However, nuclear
medicine studies sacrifice the high resolution of other imaging
techniques. Isotope studies involve ionizing radiation, and for
some longer half-life radioisotopes, patients can continue to emit
low levels of ionizing radiation for several days. Some isotopes, par-
ticularly those used in PET scanning, are relatively expensive, and
some isotopes for PET scanning are so short lived that an on-site
cyclotron is required.
An introduction to the technology of imaging thomas h. bryant and adam d. waldman
16
Fig. 1.28. Coronal presentation of data from an FDG PET scan in a patient with
lymphoma. A previously unrecognized site of disease within a right common
iliac lymph node takes up the FDG and appears a an area of high uptake (black).
Other normal, physiological sites of uptake include heart muscle, the liver and
spleen, and the bones. Excretion is via the renal system, so the bladder also
appears of high activity. (FDG ϭ fluoro-deoxy-glucose; the glucose labelled with
fluorine-18).
Fig. 1.27. A bone scan. Tc-99 m MDP, which is taken up by osteoblasts within
bone, has been intravenously injected and an image acquired 3 hours later
using a gamma camera. Uptake of the radionuclide can be seen within
the bones, and also within the kidneys (faintly) and bladder – this radiophar-
maceutical is excreted by the renal system.
annihilated, releasing energy as two 511 keV
␥
-rays, which are emitted
in opposite directions. The detectors in the PET scanner are set up in
pairs and wait for a “coincidence” detection of two 511 keV
␥
-rays.
A line drawn between the two detectors is then used in the computed
tomography reconstruction (as in CT).
Most PET isotopes are made in cyclotrons and have very short half-
lives (usually only a few minutes to hours). A commonly used PET
chemical is FDG or fluoro-deoxy-glucose – glucose labelled with
fluorine-18. Tissues that are actively metabolizing glucose take this up.
PET has been particularly successful in imaging brain, heart, and
oncological metabolism. PET scans generally have a higher resolution
than SPECT scans (Fig. 1.28).
17
In order to attempt to interpret a radiographic image, it is essential
that you first identify the type of examination and understand some-
thing of the principles behind it. Before examining any image, the
name of the patient and the date of the study should be checked. The
film should also be hung correctly and right and left sides ascertained.
Plain radiography
Plain radiographs are the most commonly encountered of all imaging
studies. The following chapters explain the radiological anatomy
involved, but it is equally important to appreciate how the film was
taken.
Staff in the radiology department can offer advice on any additional
projections but it is very important from the outset to provide as
much information as possible in the request for an examination, so
that the correct views and exposures are used.
In general, over-exposed (dark), radiographs are more useful than
those that are under-exposed, since the former retain the information.
Rather than request another film and expose the patient to more ion-
izing radiation, the dark film should be examined with a bright light
in the first instance.
Digital radiographs can be interrogated by “windowing” (see below),
and although the original exposure must be correct, the resulting
image can be manipulated to highlight bone or soft tissue detail as
required.
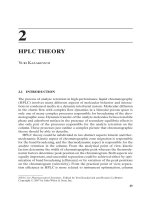
The chest radiograph
The frontal chest radiograph is the most commonly requested plain
film. The image is taken either as a “PA” (posteroanterior) or as an
“AP” (anteroposterior), depending on the direction of the X-ray beam.
The projection is usually marked on the film.
A PA projection is the better quality film and allows the size and
shape of the heart and mediastinum to be assessed accurately. A PA
film is taken with the patient erect and is performed in the radiology
department. This, of course, requires the patient to be reasonably
mobile (fig. 2.1).
For the less mobile or bed-bound patient, portable films are taken.
These are all AP and can be taken with the patient supine or erect.
Section 1 The basics
Chapter 2 How to interpret an image
ADAM W. M. MITCHELL
Fig. 2.1. Normal PA chest radiograph.
Applied Radiological Anatomy for Medical Students. Paul Butler, Adam Mitchell, and Harold Ellis (eds.) Published by Cambridge University Press. © P. Butler,
A. Mitchell, and H. Ellis 2007.
Apical artery right
Apical vein right
Superior vena cava
Azygos knob (6mm)
Ascending aorta
Right main bronchus
Right pulmonary artery
Right pulmonary veins
Right interlobar artery
Right intermediate
bronchus
Right atrium
Right hemidiaphragm
Trachea
Oesophagus
Clavicle
Chest wall (rib cage,
pleural line)
Aortic arch
Main pulmonary
artery
Left main bronchus
Left pulmonary artery
Left auricular
appendage
Left pulmonary vein
Region of contact
of oesophagus and
left atrium
Apex of left ventricle
Left hemidiaphragm
Postero-anterior
Right middle lobe
arteries and bronchi
18
Because the divergent X-ray beam causes magnification, AP films can
give a false impression of cardiac enlargement and mediastinal
widening (fig. 2.2).
Once the patient’s identity has been checked and the film hung
properly, it is important to check for any rotation. This can change
the shape of the heart and the appearance of the lungs, creating
a spurious difference in radiolucency between the two sides. In a
properly centered film, the medial ends of the clavicles should be
a similar distance from the spinous processes of the thoracic
vertebrae.
Remember to look at the periphery of any film as well as its centre.
In the case of the chest film, the cervical soft tissues and the upper
abdomen should be examined.
If the film appears rather dark, the bones will be well demon-
strated, but it will be worth using a bright light to examine the lungs,
to avoid missing a small pneumothorax.
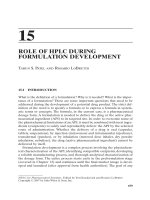
The abdominal radiograph
The plain abdominal film is also a commonly requested investiga-
tion. Its particular importance in everyday practice is in the
demonstration of free intraperitoneal air following bowel
perforation or of bowel dilatation and air/fluid levels in intestinal
obstruction (fig. 2.3).
It is important to find out about the position of the patient
when the film was taken. A patient needs to be erect for at least
10 minutes to permit any free air to accumulate in the typical
location below the diaphragm. Lateral “shoot-through” or
decubitus films (the latter with the patient lying on one side)
can help to establish the presence of a free intraperitoneal air or
pneumoperitoneum.
Plain films of the musculoskeletal system
Interpretation of these images is often more straightforward and it
is usual, in trauma, to take two views, at right angles to each other.
Fractures may be missed on a single view (fig. 2.4).
It is also the case that the soft tissue patterns on a plain film can
provide clues to the diagnosis.
Contrast studies of the gastrointestinal tract
High density contrast medium is often used in the investigation of
the gastrointestinal (GI) tract. Clinical staff (and medical students)
will often be confronted with these studies in clinico-radiological
meetings, in the outpatients’ clinic and perhaps under examination
conditions.
Barium is the commonest contrast medium used and is generally
very safe. It is contraindicated in suspected rupture of the GI tract
because the presence of barium in the mediastinum or the
peritoneum has a very high morbidity rate. In these situations
a water-soluble contrast medium, such as gastrografin,
is preferred.
Conversely, barium is safer than water-soluble contrast medium in
the lungs and in cases where aspiration is suspected, barium should
be used. This underlines the importance of providing the radiologist
with the relevant clinical information (fig. 2.5).
When interpreting contrast medium studies of the GI tract, such as
small bowel follow-through studies and barium enemas, a number of
common principles should be applied.
Always try to find out by what route the contrast medium was
administered. For instance, a rectal or nasojejunal tube is often visible
on the film.
How to interpret an image adam w. m. mitchell
Fig. 2.2. AP chest radiograph. There has been a poor respiratory effort and there
is a false impression of cardiac enlargement.
Gas in
rectum
and
sigmoid
colon
Psoas
shadow
Splenic
outline
Gas in
gastric
fundus
Liver
outline
Right
kidney
Pro-
peritoneal
fat stripe
Psoas
shadow
Gas in
caecum
Fig. 2.3. Plain abdominal radiograph.
How to interpret an image adam w. m. mitchell
19
(b)
(c)
(d)
Fig. 2.4. Multiple views
to exclude a fracture of
the scaphoid bone.
Normal examination.
(a)
20
Establish which part of the bowel has been opacified and how far
along the GI tract the contrast medium has travelled. If only the large
bowel has been opacified, the study is almost certainly a barium
enema.
It may also be useful to establish the position of the patient when
the views were taken. fluid levels and bony landmarks are useful for
this purpose.
Air is often used as a second contrast medium with barium and
these examinations are termed “double-contrast” studies. The
distension provided by air insuffation or after swallowing effervescent
tablets, as appropriate, results in better mucosal detail.
Bowel preparation is very important in lower GI tract studies as
fecal contamination may degrade a barium enema by obscuring a
genuine abnormality or by generating artifactual “filling defects.” It
may help if such defects alter their position between films, confirming
their fecal nature.
Similarly, the stomach must be empty of food before a barium meal.
Contrast studies of the kidney and urinary tract
The most common renal contrast medium study performed is the
intravenous urogram or “IVU.” After a “control” (plain), film has been
taken, iodinated contrast medium is injected intravenously and
further images are then taken as the contrast medium is excreted
through the kidneys. It is important to study the control film carefully
to look for calcification, which may subsequently be obscured by
contrast medium.
IVU films are taken at different time intervals, which are marked on
the film, and an abdominal compression band may be applied to opti-
mize urinary tract opacification (fig. 2.6).
Computed tomography
The principles of computed tomography (CT) have been discussed in
the previous chapter. Several points should be remembered in the
interpretation of the images.
The images are usually acquired in the axial plane and are viewed
as though looking at the patient from the feet up towards the head.
Therefore, the right side of the patient is on the left side of the image,
when the images have been acquired with the patient supine.
Oral and intravenous contrast media are often used during a CT
scan. Oral contrast medium is usually a water-soluble substance, such
as gastrografin. This opacifies the bowel lumen, which becomes hyper-
dense (white). The bowel can then be differentiated from other soft
tissues. Be aware, though, that it is rare for every loop of bowel to
be opacified, and unopacified loops may still cause confusion. More
recently, water has used as an alternative oral contrast medium. This
appears of intermediate density on CT scans, and gives very good
delineation of the higher density bowel mucosa adjacent to it (fig. 2.7).
Intravenous contrast medium can be identified on CT scans by the
density of the blood within the blood vessels. The aorta is easiest to
identify and will appear whiter than the surrounding soft tissues when
contrast medium has been used. It is usual for images to be annotated,
albeit often rather cryptically with “ϩC,” to inform the radiologist that
contrast medium has been administered. Use all the clues available!
The radiodensity of soft tissues will vary depending on the time
interval between the administration of the contrast medium and the
scan. Scans performed within 20–40 seconds of the injection, termed
the arterial phase, will show the aorta very white, but the solid organs
How to interpret an image adam w. m. mitchell
Blood within the
aorta opacified
with contrast
medium
Bowel loop
containing
water
Fig. 2.7. CT scan upper abdomen, following intravenous contrast medium and
water by mouth.
Fig. 2.5. Supine barium meal examination demonstrating rugal folds. The anterior
surface of the stomach can be differentiated from the posterior in the supine
position due to pooling of barium around the posterior folds.
Distal oesophagus
Anterior rugal fold
Lesser curvature
Outline of
duodenal cap
Pyloric gastric
intrum
Posterior rugal folds
Body of stomach
Greater
curvature
Barium in gastric fundus
Distal oesophagus
Anterior rugal fold
Lesser curvature
Outline of
duodenal cap
Pyloric gastric
intrum
Posterior rugal folds
Body of stomach
Greater
curvature
Barium in gastric fundus
Fig. 2.6. Intravenous
urogram (IVU).
15-minute The renal
collecting systems
ureters and bladder are
opacified with iodinated
contrast.
will not appear to be very different in density from the non-enhanced
study. Delayed imaging, at 50–70 seconds, will show the organs to be
much brighter. Focal lesions within the liver and spleen are much
easier to see on these later images.
As in conventional radiography, calcification can be obscured by
the presence of contrast medium, and is best evaluated on a non-
enhanced study.
Since it is a digital technique, CT images can be viewed on different
“windows.” This means that the gray scale of the image is altered so
that some tissues are better seen than others (fig. 2.8). The most fre-
quently used windows are for the soft tissues and the lungs. Be sure to
look at the appropriate images, so as not to miss important details in
the lungs or mediastinum. It is also valuable to view the images on
bone windows, to evaluate the presence of focal bone lesions.
How to interpret an image adam w. m. mitchell
21
(a) (b)
Fig. 2.8. CT chest. The same image displayed on (a) soft tissue and b) lung windows Mediastinal detail is better shown in (a), pulmonary detail in (b).
Fig. 2.9
.
MRI brain; T1 weighted coronal scans (a) before and (b) after intravenous gadolinium DTPA. Malignant intracerebral tumour. Breakdown of the blood–brain
barrier has resulted in gadolinium enhancement of the solid elements of the tumor.
(a) (b)
CT images are often of varying slice thickness. The slice thickness is
written on the images. Thin slices give finer detail but these scans
take longer and involve more radiation dose to the patient. Thicker
slices can be prone to artifact. High-resolution images of the chest give
very fine detail of the lungs.
Magnetic resonance imaging
Magnetic resonance imaging (MRI) is the mainstay of neuroimaging
and perhaps also musculoskeletal imaging and is becoming increas-
ingly popular in the evaluation of the hepatobiliary system and pelvis.
The principles of magnetic resonance have been discussed previously.
The interpretation of the images can be daunting at first, partly due to
the sheer number involved. Images can be acquired in any plane but
the commonest are the sagittal, axial and coronal (the orthogonal)
planes. It is vital to orientate oneself carefully, by studying the anatomy
of the image, before proceeding in the interpretation of the study.
The commonest MR images are T1 or T2 weighted. T2 weighted
images show water as white. Most images will show cerebrospinal
fluid, which is mainly water, somewhere on the image and this is
a useful reference point to decide on the weighting of the scan.
T1 weighted images show fat as very bright, so evaluation of the sub-
cutaneous tissues is helpful in identifying the weighting. There are
many other, often complicated, sequences, but a discussion of these is
beyond the scope of this introduction.
Gadolinium DTPA is the standard intravenous contrast medium
used in MR imaging. It is seen best on T1 weighted images and the
principles involved are very similar to those in CT contrast medium
enhancement (fig. 2.9).
Other contrast media are used in the evaluation of the hepatobiliary
system and of lymph nodes. These agents alter the signal returned
from the soft tissues, to increase the conspicuity of focal lesions.
Nuclear medicine imaging
Nuclear medicine images are functional studies and, as such, are inter-
preted differently. Renal imaging is acquired from the back, so that
the right kidney is on the right of the image. Most other images are
acquired from the front. The agent used is almost invariably marked
on the film and gives important clues to the evaluation of the study.
Other helpful clues may be the time of the image acquisition and the
use of other agents such as diuretics.
How to interpret an image adam w. m. mitchell
22
Introduction
Radiological investigation of the chest is a common occurrence in
clinical practice. Thus, a working knowledge of thoracic anatomy, as
seen on radiological examinations, is crucial and has an important
bearing on management. The present chapter considers the anatomy
of the thorax as related to imaging. The appearances of the thoracic
structures on plain radiography and computed tomography (which
together constitute two of the most frequently requested radiological
tests) will be discussed in most detail.
For the purposes of anatomic description, the thorax is bounded by
the vertebral column posteriorly, together with the ribs, intercostal
muscles, and the sternum antero-laterally. The superior extent of the
thorax (lying roughly at the level of the first vertebral body) is the
narrowest point and, through the thoracic inlet, the contents of the
chest communicate with those of the neck. Inferiorly, the thorax is
separated from the abdomen by the diaphragm.
Commonly used techniques for imaging the chest
Imaging of the thorax rightly is regarded as an important component
of clinical investigation. For most patients, the plain chest radiograph
will be the first (and sometimes only) radiological test that is required.
In more complex cases, the clinician will request computed tomogra-
phy (CT). The technique of magnetic resonance imaging (MRI), which
is well established in other spheres of medicine, has relatively few
applications for the routine investigation of chest diseases and will
not be discussed in any detail in this chapter except where points of
anatomical interest can be illustrated.
Chest radiography
The standard projection for imaging of the chest is the postero-ante-
rior (PA) or “frontal” view, in which the patient faces the film plate
and the X-ray tube is sited behind the patient. On a frontal projec-
tion, because the heart is as close as possible to the X-ray film plate,
magnification is minimized (Fig. 3.1). However, in some patients,
who are unable to be positioned for the PA view, the antero-posterior
projection will become mandatory. Occasionally, when the anatomical
localization of lung abnormalities is difficult to discern, a lateral view
of the chest will be requested.
Computed tomography (CT)
Computed tomography (CT) is a specialized X-ray technique, which
produces cross-sectional (or axial) images of the body. The basic com-
ponents of a CT machine are an X-ray tube, a series of detectors (sited
diametrically opposite the tube), and computer hardware to recon-
struct the images. When reviewing CT images, the observer must
imagine that the cross-sectional images are being viewed from below;
thus, structures on the left of the side of the subject will be on the
observer’s right.
The main advantage of CT, over plain chest radiography, is that
there is no superimposition of anatomical structures. Furthermore,
because CT is very sensitive to difference in density of structures and
the data are digitized, images may be manipulated to evaluate sepa-
rately at the pulmonary parenchyma, mediastinal soft tissues, or the
ribs and vertebrae (Fig. 3.2).
23
Section 2 The thorax
Chapter 3 The chest wall and ribs
JONATHAN D. BERRY
and SUJAL R. DESAI
Applied Radiological Anatomy for Medical Students. Paul Butler, Adam Mitchell, and Harold Ellis (eds.) Published by Cambridge University Press. © P. Butler,
A. Mitchell, and H. Ellis 2007.
*
Fig. 3.1. Standard
postero-anterior chest
radiograph. The heart
(asterisk) is of normal
size; the ratio of the
transverse diameter
of the heart to the
maximal transverse
diameter of the
thorax (also called
the cardiothoracic ratio)
is less than 50%.
Anatomy of the chest
The lungs and airways
Each lung occupies, and almost completely fills, its respective
hemithorax. On the right, there are three lobes (the upper, middle,
and lower) and on the left, two (the upper and lower); incidentally, the
lingula generally is considered a part of the left upper lobe. The upper
and lower lobes, on each side, are separated from each other by the
oblique fissure. On the right, the middle lobe is divided from the
upper by the horizontal fissure. By contrast, it should be noted that,
on the left, there is no fissural division between the left upper lobe
and lingula. On a PA chest radiograph, the oblique fissure is generally
not visible. Futhermore, because the upper lobe lies anteriorly, most
of the lung that is seen on the frontal view will be the upper lobe.
The horizontal fissure is seen readily on a standard PA radiograph as
a thin line crossing from the lateral edge of the hemithorax to the
hilum. On a lateral view of the chest, both the oblique fissures may be
visualized, running obliquely in a cranio-caudal distribution (Fig. 3.3);
the horizontal fissure can also be seen running forward from the
oblique fissure Occasionally, accessory fissures will be seen on a chest
radiograph.
The lungs are lined by two layers of pleura, which are continuous at
the hila. The parietal pleura covers the inner surface of the chest wall
whereas the visceral layer is closely applied to the lung surface. A
small volume of “normal” pleural fluid is generally present within the
pleural cavity to facilitate the smooth movement of one layer over the
other during breathing. In the absence of disease, the pleural layers
The chest wall and ribs jonathan d. berry and sujal r. desai
24
Fig. 3.2. Two CT images at exactly the same anatomical level manipulated to show (a) the lung parenchyma; the pulmonary vessels are seen as white, branching
linear structures (thin arrows). (b) Soft-tissue settings showing the midline structures of the mediastinum, ribs (arrowheads) and muscles of the chest wall (thick
arrows) but not the lung parenchyma.
(a)
(b)
*
UL
UL
LL
LL
*
Fig. 3.3. Targeted views of (a) frontal radiograph to show the horizontal (minor) fissure (arrows) and (b) lateral projection showing the lower halves of both oblique
fissures (arrows). The horizontal fissure is also noted on this view (arrowhead). The lower lobes (LL) lie behind and below whereas the upper lobes (UL) are above
and in front of the oblique fissures. The middle lobe (asterisk) is located between the horizontal and relevant oblique fissure.
(a) (b)