Báo cáo y học: " Intracytoplasmic maturation of the human immunodeficiency virus type 1 reverse transcription complexes determines their capacity to integrate into chromatin" pot
Bạn đang xem bản rút gọn của tài liệu. Xem và tải ngay bản đầy đủ của tài liệu tại đây (397.45 KB, 12 trang )
BioMed Central
Page 1 of 12
(page number not for citation purposes)
Retrovirology
Open Access
Research
Intracytoplasmic maturation of the human immunodeficiency virus
type 1 reverse transcription complexes determines their capacity
to integrate into chromatin
Sergey Iordanskiy
1,2
, Reem Berro
3
, Maria Altieri
1
, Fatah Kashanchi
3
and
Michael Bukrinsky*
1,3
Address:
1
Department of Microbiology, Immunology and Tropical Medicine, The George Washington University, 2300 I St. N.W., Washington,
DC 20037, USA,
2
Department of Molecular Virology, The D.I. Ivanovsky Institute of Virology, 16 Gamaleya St., Moscow 123098, Russia and
3
Department of Biochemistry and Molecular Biology, The George Washington University, 2300 I St. N.W., Washington, DC 20037, USA
Email: Sergey Iordanskiy - ; Reem Berro - ; Maria Altieri - ;
Fatah Kashanchi - ; Michael Bukrinsky* -
* Corresponding author
Abstract
Background: The early events of the HIV-1 life cycle include entry of the viral core into target
cell, assembly of the reverse transcription complex (RTCs) performing reverse transcription, its
transformation into integration-competent complexes called pre-integration complexes (PICs),
trafficking of complexes into the nucleus, and finally integration of the viral DNA into chromatin.
Molecular details and temporal organization of these processes remain among the least investigated
and most controversial problems in the biology of HIV.
Results: To quantitatively evaluate maturation and nuclear translocation of the HIV-1 RTCs,
nucleoprotein complexes isolated from the nucleus (nRTC) and cytoplasm (cRTC) of HeLa cells
infected with MLV Env-pseudotyped HIV-1 were analyzed by real-time PCR. While most
complexes completed reverse transcription in the cytoplasm, some got into the nucleus before
completing DNA synthesis. The HIV-specific RNA complexes could get into the nucleus when
reverse transcription was blocked by reverse transcriptase inhibitor, although nuclear import of
RNA complexes was less efficient than of DNA-containing RTCs. Analysis of the RTC nuclear
import in synchronized cells infected in the G2/M phase of the cell cycle showed enrichment in the
nuclei of RTCs containing incomplete HIV-1 DNA compared to non-synchronized cells, where
RTCs with complete reverse transcripts prevailed. Immunoprecipitation assays identified viral
proteins IN, Vpr, MA, and cellular Ini1 and PML associated with both cRTCs and nRTCs, whereas
CA was detected only in cRTCs and RT was diminished in nRTCs. Cytoplasmic maturation of the
complexes was associated with increased immunoreactivity with anti-Vpr and anti-IN antibodies,
and decreased reactivity with antibodies to RT. Both cRTCs and nRTCs carried out endogenous
reverse transcription reaction in vitro. In contrast to cRTCs, in vitro completion of reverse
transcription in nRTCs did not increase their integration into chromatin.
Conclusion: These results suggest that RTC maturation occurs predominantly in the cytoplasm.
Immature RTCs containing RT and incomplete DNA can translocate into the nucleus during mitosis
and complete reverse transcription, but are defective for integration.
Published: 12 January 2006
Retrovirology 2006, 3:4 doi:10.1186/1742-4690-3-4
Received: 10 October 2005
Accepted: 12 January 2006
This article is available from: />© 2006 Iordanskiy et al; licensee BioMed Central Ltd.
This is an Open Access article distributed under the terms of the Creative Commons Attribution License ( />),
which permits unrestricted use, distribution, and reproduction in any medium, provided the original work is properly cited.
Retrovirology 2006, 3:4 />Page 2 of 12
(page number not for citation purposes)
Background
The early events of the HIV-1 life cycle include entry of the
viral core into target cell, assembly of the reverse transcrip-
tion complexes (RTCs), reverse transcription of the viral
genome and transformation of RTCs into integration-
competent complexes called pre-integration complexes
(PICs) [1], trafficking of PICs into the nucleus, and finally
integration of the viral DNA into chromatin (reviewed in
ref [2]. Molecular details and temporal organization of
these processes remain among the least investigated and
most controversial problems in the biology of HIV. For
example, reverse transcription is generally completed in 8
to 12 h, whereas virus-specific DNA can be detected in the
nuclei of infected cells as early as 4 h post-infection [3].
This and the finding that nuclear complexes may contain
RT [4] question the retrovirology dogma that reverse tran-
scription completes in the cytoplasm and suggest that
HIV-1 RTC maturation may occur after translocation into
the nucleus.
HIV-1 nucleoprotein complexes isolated from the cyto-
plasm of infected cells (cRTCs) contain reverse-tran-
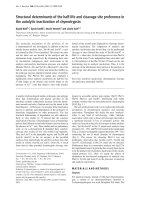
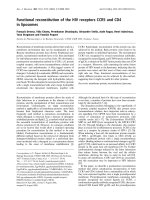
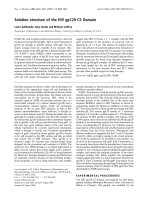
Analysis of nucleo-cytoplasmic distribution of HIV-1 RTCsFigure 1
Analysis of nucleo-cytoplasmic distribution of HIV-1 RTCs.HeLa cells were spinoculated with MLV Env-pseudotyped
NL4-3 or NL4-3-GFP HIV-1. A. HeLa cells infected with GFP-expressing HIV-1 were analyzed by FACS 48 h after infection.
Percentage of GFP-positive cells was counted using CellQuest software. B. PCR analysis of the purity of nuclear extracts. Cyto-
plasmic and nuclear extracts were prepared from the same number of cells (1 × 10
6
) and total DNA was isolated. Undiluted
and diluted (1:10, 1:10
2
, 1:10
3
, and 1:10
4
) DNA samples were analyzed by PCR using primers specific for mitochondrial DNA.
M – DNA molecular size marker, NC – negative control (H
2
O). C,D. Real-time PCR analysis of nuclear and cytoplasmic RTCs.
DNA isolated from cytoplasmic and nuclear RTCs 2 h (C) and 5 h (D) after spinoculation was analyzed in triplicate with prim-
ers specific for early or late HIV-1 DNA using SYBR Green qPCR. Serial dilutions of DNA from 8E5 cells were used as quanti-
tative standards. Results are presented as mean ± SD.
A
Cell count
1.40% 78.54%
Mock-infected
GFP
GFP
500 bp
400 bp
Cytoplasm Nuclei
1:10
M
1:10
2
1:10
3
1:10
4
1:10
1:10
2
1:10
3
1:10
4
1
1
B
NC
Cytoplasmic RTC
Nuclear RTC
0
2.5x10
6
Copy number per 1x10
6
cells
2,053,124±
148,694
17,169±
1,829
2.0x10
6
1.5x10
6
1.0x10
6
0.5x10
6
0
4,118,779±
459,906
66,212
±2,130
2.0x10
6
1.0x10
6
3.0x10
6
4.0x10
6
5.0x10
6
0
5x10
5
4x10
5
3x10
5
2x10
5
1x10
5
453,193±
51,507
63,423±
8,181
Early primers Early primers
Late primers
0
5x10
3
Late primers
4x10
3
3x10
3
2x10
3
1x10
3
4,041±
592
2,211±
1,875
C
2 h post-infection
5 h post-infection
D
NL4-3-GFP-Env(MLV)
Copy number per 1x10
6
cells
Retrovirology 2006, 3:4 />Page 3 of 12
(page number not for citation purposes)
scriptase (RT), integrase (IN), matrix protein (MA) and
Vpr [4-6] The capsid protein (CA) was detected in virus-
specific complexes early after infection, but it was absent
in cRTCs analyzed at later time points and in nuclear RTCs
(nRTCs) [4,7] The composition of the HIV-1 nPICs is still
unclear. Early studies suggested that IN alone is sufficient
for efficient integration, at least in vitro [1,8]. Later, viral
proteins MA and Vpr, and even RT were identified in the
nuclear compartment in detectable amounts [4,9,10]. In
addition, certain cellular proteins involved in chromatin
organization and remodeling, such as the high mobility
group protein HMGA [11,12], SWI/SNF component Ini1
and PML [13], associate with the HIV-1 RTC during its
migration from the cytoplasm into the nucleus and may
contribute to integration or some pre-integration event in
the nucleus, such as regulating intranuclear movements of
RTC or modifying the chromatin at the site of integration.
It becomes clear that the RTC undergoes substantial reor-
ganization coinciding with its migration from the cyto-
plasm into the nucleus. It should be noted here that only
a small proportion of RTCs produced in each cell finally
integrates and gives rise to progeny virions, whereas bio-
chemical studies deal with a bulk of virus-specific com-
plexes. Nevertheless, most likely all the complexes that
initiated reverse transcription follow the same steps of
maturation, though many of them either arrest at some
stage before completion of reverse transcription or com-
plete reverse transcription but do not integrate because of
intranuclear restrictions. Thus, in this study, we focused
on comparative analysis of protein composition, reverse
transcription and integrative capacity of the cytoplasmic
and nuclear complexes of HIV-1. We demonstrate that
RTCs can be translocated into the nucleus at different
stages of reverse transcription and that population of
nuclear complexes is heterogeneous, although nuclear
translocation of complexes in which reverse transcription
had been blocked is less efficient than of RTCs containing
full-length HIV-1 DNA. Nuclear import of the HIV-spe-
cific nucleoprotein complexes is associated with qualita-
tive and quantitative changes in their protein content.
Apparently, these changes correlate with translocation of
RTCs through the nuclear pore complex (NPC), because
passing of the cells through mitosis favored accumulation
in the nucleus of immature RTCs containing incomplete
DNA. These RTCs appear to be impaired in integration
capacity even after completion of reverse transcription.
Results and Discussion
Analysis of HIV-1 reverse-transcription complexes during
first hours of infection
Nuclear and cytoplasmic RTCs were purified from HeLa
cells which were infected with DNase I-treated MLV Env-
pseudotyped HIV-1 by spinoculation [14]. This procedure
allowed infection of 70–80% of the cells, as shown using
the GFP-expressing NL4-3 HIV-1 (Fig. 1A), which was
generated by transfecting HEK 293T cells with
NL43GFP11 molecular clone [15]. Of note, infection of
HeLa CD4+ cells with non-pseudotyped HIV-1 produced
10-fold lower level of infection (data not shown). There-
fore, the use of pseudotyped HIV-1 construct was neces-
sary for high efficiency of infection required for our
analysis, as we failed to obtain consistent results with the
wild-type HIV-1. In previous studies [3], VSV-G pseudo-
typing was used to increase efficiency of infection, how-
ever, this envelope mediates entry via endocytosis,
whereas the MLV envelope mediates fusion at the plasma
membrane [16], similar to the entry pathway used in nor-
mal HIV infection process. Cytoplasmic contamination of
the nuclear fractions was negligible and did not exceed
0.1%, as illustrated by PCR amplification of mitochon-
drial DNA from cytoplasmic and nuclear extracts (Fig.
1B).
Analysis of cRTCs 2 h post-infection showed substantially
more complexes with early ("strong-stop") DNA than
with late reverse transcription products (2.05 versus 0.004
copies per cell, respectively) (Fig. 1C). The number of
complexes carrying early reverse transcription product
increased two-fold at 5 h post-infection (compare panels
C and D in Fig. 1), suggesting that many virions began
reverse transcription later than two hours post-entry. The
ratio of complexes carrying early and late RT products was
500:1 after 2 h (Fig. 1C), and 10:1 after 5 h of infection
(Fig. 1D) (i.e., the proportion of late DNA-containing
cytoplasmic complexes increased fifty-fold in 3 hours).
Nevertheless, at least 90% of complexes in the cytoplasm
did not complete reverse transcription during first 5 h of
infection, as late primers recognized only about 10% of
RTCs recognized by early primers (Fig. 1D). The observed
ratios correlate well with previously published data
[17,18]. obtained using different approaches, thus vali-
dating our experimental system. A much higher number
of complexes per cell in our analysis than in previous
studies was likely due to the method of infection, which
allows to synchronously infect at least 75% of the cells
(Fig. 1A). Thus, the number of cytoplasmic HIV-1 com-
plexes initiating reverse transcription increases approxi-
mately 2-fold (from 2 to approximately 4 complexes per
cell) during the period from 2 h to 5 h after infection.
Comparative analysis of strong-stop HIV-1 cDNA (an
early RT product) in cytoplasmic and nuclear RTCs at 2 h
post-infection revealed the ratio of cytoplasmic to nuclear
complexes as 120:1, which decreased two-fold (to 60:1)
during subsequent 3 h incubation (Fig. 1C,D). This
decrease likely reflects the process of nuclear translocation
of the cytoplasmic complexes. It should be noted that pro-
teasomal degradation of the early HIV-1 infection inter-
mediates described in [19-21] is unlikely to play
significant role in our experimental conditions, as early
Retrovirology 2006, 3:4 />Page 4 of 12
(page number not for citation purposes)
viral DNA increased two-fold from 2 h to 5 h post-infec-
tion and a substantial amount of early RTCs carried on to
synthesize late DNA (Fig. 1C,D). Proportion of RTCs con-
taining late reverse transcription products in the total pop-
ulation of complexes (estimated by measuring strong-
stop DNA copies) increased hundred-fold from 2 h to 5 h
post-infection (due to ongoing reverse transcription),
whereas proportion of nRTCs containing late HIV-1 DNA
increased only thirty-fold (panels C and D in Fig. 1). Fur-
thermore, for the first two hours after infection, RTCs in
the nuclear compartment carried predominantly the early
HIV-1 reverse transcription products (17,169 copies of
early DNA and 2,211 copies of late DNA, Fig. 1C),
whereas at 5 h post-infection more than 95% of nRTCs
contained late reverse transcription products (66,212 cop-
ies of early DNA and 63,423 copies of late DNA, Fig. 1D).
These results demonstrate that proportion of RTCs car-
ryind late reverse transcripts increases in both cytoplasmic
and nuclear compartments during the course of infection.
Since the relative growth of these complexes was higher in
the nucleus than in the cytoplasm, we next investigated
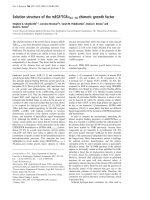
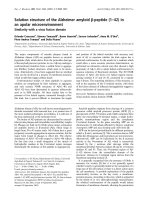
Quantitative analysis of nuclear translocation of HIV-1 RTCs in synchronized cellsFigure 2
Quantitative analysis of nuclear translocation of HIV-1 RTCs in synchronized cells. A. Cell cycle distribution of
control, non-synchronized HeLa cells (upper panel), and cells pre-treated with 2 mM thymidine was measured by flow cyto-
metric analysis before spinoculation (middle panel) and 5 h after spinoculation (lower panel). Percentage of cells at different
phases of the cell cycle was counted using CellQuest software. B,C. Nuclear translocation of HIV-1 RTCs. HIV-1 DNA was
purified from cytoplasmic and nuclear HIV-1 complexes 5 h after infection of synchronized and non-synchronized HeLa cells.
Triplicate samples were analyzed by real-time PCR with primers specific for early and late HIV-1 DNA by measuring SYBR
Green fluorescence. Values are means ± SD. Panel B shows percentage of nRTC DNA relative to DNA from cRTCs. Panel C
represents percentage of late DNA from nRTCs relative to early nRTC DNA.
G1 – 38.97%
S – 23.93%
G2/M – 17.52%
G1 – 52.79%
S – 38.12%
G2/M – 3.27%
G1 – 5.13%
S – 43.44%
G2/M – 33.15%
Non-
synchronized
cells
Thymidine-
synchronized
cells before
infection
Thymidine-
synchronized
cells 5 h
post-infection
Cell count
DNA
Cell count
Cell count
Synchr. Non-
Synchr.
0
20
40
60
80
100
RTC DNA (% of cRTC DNA)
Non-
Synchr.
Early primers Late primers
cRTC DNA
nRTC DNA
0
20
40
60
80
100
nRTC DNA
(% of early DNA in nRTCs)
Synchr. Non-
Synchr.
Early DNA-containing nRTCs
Late
DNA-containing nRTCs
5.71
±1.63
4.49
±0.41
7.17
±2.83
25.58
±6.92
35.71
±10.3
63.32
±11.2
AB C
Synchr.
Retrovirology 2006, 3:4 />Page 5 of 12
(page number not for citation purposes)
whether this phenomenon was a result of selective nuclear
import of RTCs containing full-length reverse transcrip-
tion product (mature RTCs).
Both immature and mature HIV-1 RTCs can get into the
nucleus during mitosis, as this mechanism is non-discrim-
inative and is used by many retroviruses [22-24] In non-
synchronized cultures, as is the case with HeLa cells in our
experiments, the changes in the number of cells going
through mitosis at different time points may influence the
distribution of cytoplasmic and nuclear RTCs. To elimi-
nate this complication, we quantitatively analyzed
nuclear import of RTCs in synchronized cells. This
approach was selected over analysis of infection in
growth-arrested cells because of apoptotic activity (which
may significantly and unpredictably affect results of anal-
ysis) of practically all cell cycle-arresting agents. After
treatment with thymidine, HeLa cells were synchronized
in the G1/S phase (90.9% of cell population, middle
panel in Fig. 2A). Cells were infected with MLV-pseudo-
typed HIV-1, incubated in fresh medium for 5 h and ana-
lyzed by flow cytometry for cell cycle distribution. This
analysis revealed that one third (33%) of synchronized
cells shifted to G2/M phase of the cell cycle (low panel in
Fig. 2A), whereas in non-synchronized culture percentage
of dividing cells did not exceed 17% (upper panel, Fig.
2A). Real-time PCR analysis of cytoplasmic and nuclear
RTCs showed a slight increase in the proportion of nuclear
RTCs (judged by early DNA) in synchronized (5.71%)
compared to non-synchronized cells (4.49%, Fig. 2B).
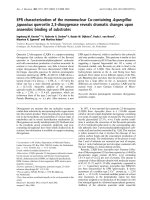
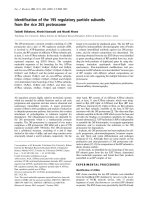
Nuclear translocation of RNA and DNA containing HIV-1 PICsFigure 3
Nuclear translocation of RNA and DNA containing HIV-1 PICs. DNA and RNA were purified from cytoplasmic and
nuclear HIV-1 complexes 5 h after infection of HeLa cells in the presence or absence of AZT (3 µM). Triplicate samples were
analyzed by real-time PCR with primers specific for late HIV-1 DNA by measuring SYBR Green fluorescence. Results are pre-
sented as mean ± SD. A. Absolute values of nuclear and cytoplasmic HIV-1 DNA and RNA in RTCs. B. Percentage of nuclear
RNA or DNA relative to cytoplasmic RNA or DNA, respectively.
0
2.8
2.4
2.0
1.6
1.2
0.8
0.4
827,000±
307,590
21,050
±2,400
1,829,750±
535,250
5,740
±2,831
A
0
0.5
DNA copy number per 10
6
cells (x10
6
)
0.4
0.3
0.2
0.1
No AZT AZT
359,225±
107,375
17,176
±2,841
25,268
±1,371
0
0
20
40
60
80
100
RTC RNA (% of cRTC RNA)
2.55
±0.59
RTC DNA (% of cRTC DNA)
0
20
40
60
80
100
4.88
±1.12
No AZT AZT
cRTCs
nRTCs
RNA copies in RTCs
DNA copies in RTCs RTC RNA
RTC DNA
B
0.31
±0.16
No AZT AZT
RNA copy number per 10
6
cells (x10
6
)
Retrovirology 2006, 3:4 />Page 6 of 12
(page number not for citation purposes)
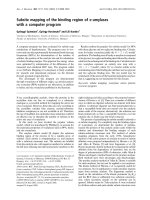
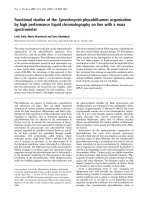
Analysis of protein composition of cytoplasmic and nuclear RTCsFigure 4
Analysis of protein composition of cytoplasmic and nuclear RTCs. cRTCs and nRTCs purified 5 h after infection were
immunoprecipitated using the indicated antibodies and Protein G Sepharose. DNA was isolated from immune complexes and
analyzed by real-time PCR as in Fig. 1. DNA recovered in immunoprecipitated RTCs as percentage of total HIV-1 DNA
detected in the cRTCs is indicated under the histogram columns. DNA recovery for isotype control antibodies is shown on
the right. DNA recovery for mouse mAb is shown in open boxes, for rabbit polyclonal antibodies – in shaded boxes. A,B.
Immunoprecipitated cRTCs were analyzed using primers specific for early (A) and late (B) reverse transcription products. N.d.
– not done. Results are mean ± SD of triplicate determinations, except for late DNA analysis of anti-MA-precipitated com-
plexes, which was done only once. One representative experiment out of 4 performed is shown. C. Experiment was per-
formed as in A, except that nRTCs were analyzed. Low sensitivity of primers specific for late HIV-1 DNA precluded their use
for analysis of nRTCs. Results are mean ± SD of triplicate determinations. One representative experiment out of 4 performed
is shown. D. Temporal analysis of cRTCs. Results are mean ± SD of triplicate determinations. One representative experiment
out of 3 performed is shown.
MA
CA RT IN Vpr PML Ini1
0
5000
10000
15000
20000
25000
30000
35000
Cytoplasmic RTCs
IP:
0
1000
2000
3000
4000
5000
6000
7000
8000
9000
0
4000
8000
12000
16000
20000
MA CA RT IN Vpr PML Ini1
Cytoplasmic RTCs
IP:
MA CA RT IN Vpr PML Ini1
Nuclear RTCs
IP:
n.d.
4.66 2.25
2.79
6.03 4.23
cDNA recovery
(% of cRTC DNA)
42.16 19.98
18.46
34.87
24.56
n.d
cDNA recovery
(% of cRTC DNA)
85.14 2.0 7.31 35.25 52.52
cDNA recovery
(% of nRTC DNA)
RT IN Vpr
0
100
200
300
400
500
600
700
800
900
Early HIV-1 DNA (%)
5 h post-in fection (100%)
24hp.i.
1.11
0.12 3.14
22.84
cDNA recovery
(% of cRTC DNA)
Cytoplasmic RTCs
A
D
0.61
Mouse IgG1
Mouse IgG1
Mouse IgG1
Mouse IgG1
8.74
2.69
0.55
0.95
6.59
5.52
9.42
31.77
13.0477.5840.54
1.41
3.381.46
Early HIV-1 DNA (copies)
Late HIV-1 DNA (copies)
Early HIV-1 DNA (copies)
B
C
Rabbit IgG1
Rabbit IgG1
Rabbit IgG1
IP:
Rabbit IgG1
Retrovirology 2006, 3:4 />Page 7 of 12
(page number not for citation purposes)
However, the proportion of nuclear late DNA-containing
RTCs was significantly higher in non-synchronized cells
(25.58% vs 7.17%, Fig. 2B), suggesting that nuclear
import in non-synchronized cells favors RTCs with full-
length DNA. In synchronized, actively dividing cells, late
DNA-containing RTCs constituted one third (35.71%) of
the total nRTC population, while in non-synchronized
cells their proportion reached two thirds (63.32%) (Fig.
2C). It should be noted that our analysis likely underesti-
mates the amount of nRTCs in synchronized cells, as 33%
of these cells are in G2/M phase (Fig. 2A) and may lack the
nuclei. However, accounting for these cells would not sig-
nificantly change the cytoplasm/nuclear ratio of early and
late DNA-containing RTCs, as nuclear RTCs constitute less
than 10% in synchronized cells (Fig. 2B). These data show
that in synchronously dividing cells, the ratio of nRTCs
carrying early and late reverse transcription products is
similar to that in cRTCs, whereas in normal, non-synchro-
nized cell population the nuclear fraction is clearly
enriched in RTCs containing late HIV-1 DNA. This finding
suggests that most of the early DNA-containing RTCs get
into the nuclear compartment during mitosis. RTCs carry-
ing complete HIV-1 DNA seem to have an advantage in
translocation through the NPC.
To further test this idea, we analyzed the translocation
from the cytoplasm to the nucleus of RNA-containing
complexes in which reverse transcription was artificially
inhibited. Non-synchronized HIV-infected HeLa cells
were treated with AZT (3 µM) to block reverse transcrip-
tion. Cytoplasmic and nuclear HIV-1 complexes were iso-
lated from AZT-treated and untreated cell extracts 5 h
post-infection, and RNA or DNA was purified and ana-
lyzed by real-time PCR using primers specific for late HIV-
1 reverse transcripts. As shown in Figures 3, the efficiency
of the nuclear import (as judged by the percentage of
nuclear versus cytoplasmic RTCs) of DNA-containing
complexes (4.88%, panel B) was about two-fold higher
compared to RNA-containing complexes (2.55%, panel
B). AZT treatment increased the number of RNA-contain-
ing complexes in the cytoplasm by 2.2-fold (Fig. 3A),
however, only 0.31% of these complexes got into the
nucleus, whereas almost 5% of DNA-containing RTCs
translocated into the nucleus (Fig. 3B). Lower efficiency of
nuclear translocation of HIV-1 complexes incapable of
performing reverse transcription may be due to conforma-
tional restraints (e.g., excessive size of the complexes) or
to the lack or inaccessibility of determinants required for
efficient nuclear import (e.g., DNA flap [25]). Likely, most
of these immature particles get into the nuclear compart-
ment during mitosis. This conclusion is consistent with a
dramatic decrease of nuclear import of RNA-containing
complexes after AZT treatment (from 2.5% to 0.3% in Fig.
3B), which can be explained in part by AZT-induced arrest
in the S phase of cell cycle of the treated cells [26].
Taken together, presented results suggest that HIV-1 RTCs
can get into the nucleus at the time of mitosis in a non-
selective manner, or they can translocate through the
NPC. The latter pathway appears to be selective for RTCs
which have completed reverse transcription.
Protein composition of RTCs
Protein composition of cytoplasmic and nuclear com-
plexes of HIV-1 was analyzed 5 h post-infection using
immunoprecipitation (IP) followed by real-time PCR
analysis of HIV-1 DNA as described in the Method sec-
tion. Because of a lower sensitivity of PCR with primers
specific for late cDNA than early cDNA, we could not use
late primers for analysis of immune precipitates of nRTCs.
It should be noted that the rate of cDNA recovery (ratio of
cDNA in immunoprecipitated RTCs to total RTC cDNA)
in immunoprecipitates of cytoplasmic RTCs obtained
with primers specific for early HIV-1 DNA was lower, than
with primers, specific for late DNA (Fig. 4A,B), likely due
to the presence of a large number of internalized virions
(intact or only partially uncoated) and products of virion
degradation in the cytoplasm. Analysis of cRTCs immuno-
precipitated with anti-Vpr and anti-IN antibodies 24 h
after infection showed a two-fold and seven-fold increase,
respectively, in the level of HIV-1 DNA recovery compared
to complexes analyzed 5 h after infection, whereas recov-
ery of HIV-1 DNA in complexes immunoprecipitated with
anti-RT antibody decreased almost 10-fold (from 1.11%
to 0.12%, Fig. 4D). This result suggests that protein com-
position or conformation of cytoplasmic complexes
changes during the process of their maturation. The data
obtained using late DNA-specific primers (Fig. 4B) indi-
cate higher values of DNA recovery, which may reflect
higher accessibility of proteins to antibodies in RTCs com-
pleting their maturation.
Our analysis demonstrates that most proteins identified
in cRTCs were also present in nRTCs (Fig. 4C). It is
unlikely that this result was due to cytoplasmic contami-
nation of the nuclear fractions, as nuclear RTCs were
impoverished in RT, and minimal quantity of mitochon-
drial DNA could be detected in the nuclear fractions (Fig.
1B). Analysis of nRTCs immunoprecipitated with anti-
body to CA, which has been previously found in early
intermediates of HIV-1 infection [7], revealed only negli-
gible levels of early reverse transcription complexes (Fig.
4C). However, some nRTCs could be immunoprecipi-
tated with anti-RT antibody (Fig. 4C). This finding sug-
gests that some RTCs may complete reverse transcription
in the nucleus. Low levels of RT-containing complexes in
nRTC population are consistent with a time-dependent
decrease in RT representation in cRTCs (Fig. 4D). These
data show that nRTCs appear as a heterogeneous popula-
tion of particles, containing complexes at different stages
of reverse transcription and characterized by different pro-
Retrovirology 2006, 3:4 />Page 8 of 12
(page number not for citation purposes)
Quantitative PCR analysis of ERT activity and integration of cytoplasmic and nuclear RTCsFigure 5
Quantitative PCR analysis of ERT activity and integration of cytoplasmic and nuclear RTCs. A. ERT activity of
cRTCs and nRTCs isolated 2 h and 5 h post-infection. cRTCs and nRTCs were normalized according to strong-stop (early)
HIV-1 DNA content measured by real-time PCR. ERT reaction was performed in duplicate as described in the text. HIV-1
DNA was quantified by real-time PCR. HIV-1 DNA in RTCs incubated without dNTPs (control) was taken as 100%. Results
are presented as mean ± SE. B. Quantitative PCR analysis of PIC integration into chromatin. cPICs and nPICs after the ERT
reaction performed with or without (control) dNTPs were incubated in triplicate with chromatin samples. DNA was purified
and analyzed by Alu-LTR-based real-time nested PCR [29]. Integration efficiency was evaluated relative to integration of cPIC
isolated 2 h p.i. Results are presented as mean ± SD.
0
20
40
60
80
100
120
140
160
180
200
220
240
260
280
HIV-1 cDNA (% of control)
2 h Post-infection
Control (without dNTPs)
ERT (with dNTPs)
0
20
40
60
80
100
120
140
160
180
cRTC nRTC
5 h Post-infection
HIV-1 cDNA (% of control)
Control
ERT
2hp.i. 5hp.i.
Integrated HIV-1 DNA
(% of control 2 h p.i.)
A
B
nRTC
Late HIV-1 DNA Early HIV-1 DNA
0
40
80
120
160
200
Late HIV-1 DNA Early HIV-1 DNA
cPIC cPIC nPIC
Retrovirology 2006, 3:4 />Page 9 of 12
(page number not for citation purposes)
tein composition. This heterogeneity in protein content
may explain the heterogeneity in buoyant density
reported by Fassati and Goff [3].
Endogenous reverse transcription (ERT) in RTCs
Since RT was found in both cytoplasmic and nuclear com-
plexes, we analyzed their capacity to perform endogenous
reverse transcription (ERT). Cytoplasmic complexes iso-
lated at 2 h post-infection showed a 2.4-fold increase in
the number of late reverse transcription products after
incubation with dNTP mix (upper panels in Fig. 5A). No
increase was observed when primers specific for early
DNA were used or when dNTPs were omitted from the
reaction. Cytoplasmic complexes isolated at 5 h post-
infection displayed a 1.6-fold increase of late reverse tran-
scription products after ERT (bottom panel in Fig. 5A).
This decrease is likely due to maturation of the cRTCs dur-
ing the first 5 h of infection, although the differences in
ERT activity between the 2 h and 5 h complexes did not
reach statistical significance. Because of low concentration
of nRTCs isolated at 2 h post-infection, we were unable to
measure ERT in this population of complexes. However,
as shown in the bottom panels of Fig. 5A, nRTCs isolated
at 5 h post-infection did carry out reverse transcription,
although rather inefficiently compared to cytoplasmic
complexes (approximately 1.3-fold increase in late reverse
transcription products). These findings, together with
immunoprecipitation data (Fig. 4), suggest that some
complexes may complete reverse transcription in the
nucleus. Since there is much more HIV-specific complexes
in the cytoplasm than in the nucleus (Figs. 1, 2, 3), it
appears that most cytoplasmic complexes detected by PCR
with primers specific for early HIV-1 DNA did not com-
plete reverse transcription, suggesting that only a small
portion of early RTCs are capable of completing their mat-
uration and staying on the pathway to integration.
In vitro integration of HIV-1 PICs into isolated chromatin
To compare integrative capacity of cytoplasmic and
nuclear complexes, and to evaluate the effect of ERT on
integration, we analyzed in vitro integration of the com-
plexes into immunoprecipitated chromatin. Since previ-
ous studies demonstrated significance of nucleosomal
organization of the chromatin for HIV-1 integration
[27,28]., we used immunoprecipitated chromatin, rather
than naked DNA, as a target for integration.
Cytoplasmic and nuclear complexes, subjected to ERT in
the absence (control) or presence of dNTPs, were incu-
bated with chromatin in the presence of 0.25 mM ATP for
1 h at 37°C. Integration of HIV-1 DNA was analyzed by
Alu-LTR-based real-time nested-PCR according to [29].
Integrative capacity of cytoplasmic complexes isolated at
2 h post-infection increased two-fold after the ERT reac-
tion (Fig. 5B). Analysis of nuclear complexes at 2 h p.i.
was not performed due to miniscule amounts of viral
complexes in the nucleus at this time point. Complexes
isolated from cytoplasm at 5 h post-infection showed a
1.25-fold increase of integration after ERT. The increase in
integration correlated with results of the ERT reaction (Fig.
5A), indicating that in vitro completion of RT reaction in
cRTCs increased their ability to integrate into chromatin.
ERT did not increase the integrative capacity of nRTCs iso-
lated at 5 h post-infection (Fig. 5B), although the low rate
of ERT was observed in these complexes (Fig. 5A).
Without ERT, cytoplasmic and nuclear complexes purified
at 5 h post-infection appeared to have similar integration
capacities (Fig. 5B). A decrease in integration of nPICs
after ERT may be due to inhibition by dNTPs [30]. This
inhibition should also affect integration of cytoplasmic
complexes, but in this case it is not seen due to an increase
in integration efficiency because of ERT. This result indi-
cates that cytoplasmic and nuclear complexes (PICs) have
a similar integration capacity despite differences in their
bulk protein composition (e.g., lack of p24 and decreased
amount of RT in nPICs, Fig. 4), consistent with a notion
that only a small fraction of cytoplasmic and nuclear RTCs
represents the integration-competent PICs. Our data also
suggest, that completion of reverse transcription in a small
part of nRTCs containing incomplete reverse transcripts
does not appear to contribute to integration.
Conclusion
Taken together, results presented in this report show that
most HIV-1 RTCs complete reverse transcription in the
cytoplasm and then translocate into the nucleus. Comple-
tion of the reverse transcription correlates with changes in
protein composition of the RTCs which may contribute to
the ability of complexes to translocate through the nuclear
pore complex. However, in dividing cells, some RTCs can
get into the nuclear compartment during the mitosis
before completing DNA synthesis. Thus, population of
nRTCs is heterogeneous, with some complexes containing
incomplete reverse transcription products and RT, similar
to cRTCs. These nRTCs are capable of reverse transcrip-
tion, indicating that their maturation may potentially
continue in the nuclear compartment. Nevertheless, this
process appears to be rather inefficient and does not seem
to significantly contribute to the amount of integration-
competent complexes, suggesting that maturation of RTCs
and their conversion into PICs is completed in the cyto-
plasm. This study adds to HIV-1 RTC/PIC characterization
and advances our understanding of RTC maturation.
Methods
Cells and viruses
HEK 293T and HeLa cells were purchased from ATCC
(Manassas, VA). Cells were maintained at 37°C in atmos-
phere containing 5% CO
2
in Dulbecco's modified Eagle
Retrovirology 2006, 3:4 />Page 10 of 12
(page number not for citation purposes)
medium (DMEM) supplemented with 2 mM glutamine,
10% (v/v) fetal bovine serum (Bio Whittaker), 100 units/
ml penicillin, and 100 units/ml streptomycin. CEM cells
(ATCC CCL-119) used for chromatin isolation were
grown in RPMI-1640 containing 2 mM glutamine, 10%
(v/v) FBS, 100 units/ml penicillin, and 100 units/ml
streptomycin. To generate replication-incompetent HIV-1
vectors for infection of HeLa cells, HEK 293T cells were
seeded in 75 cm
2
flasks and cultivated up to approxi-
mately 70% monolayer. Then cells were co-transfected
using Metafectene (Biontex) with NLHXB [31] or the GFP-
expressing NL43GFP11 [15] molecular clones and a vec-
tor encoding the Env protein of the amphotropic MLV,
pcDNA-Env(MLV) (provided by Dr. N. Landau). 72 h
after transfection recombinant virus particles were har-
vested, filtered through a 0.45-µm-pore-size filter and
incubated for 1 h at 37°C in a buffer containing 10 mM
MgCl
2
and 60 U/ml of RNase-free DNase I (Roche, Indi-
anapolis, IN). Virus particles were concentrated from the
culture media by centrifugation through a 30% sucrose
cushion in PBS at 24,000 RPM in a Beckman SW-28 rotor
for 2 h at 4°C. Virus pellets were resuspended in Dul-
becco's modified Eagle medium containing 20 mM
HEPES (pH 7.4). For infection, viral titers were normal-
ized by p24 ELISA (PerkinElmer Life Sciences, Boston,
MA) to 0.5 pg of p24 per cell. Infection of HeLa cells was
performed in 6-well plates by spinoculation at 18°C (to
prevent viral internalization by the cells during spinocula-
tion) according to a published protocol).)[14]. After spin-
oculation virus-containing media was removed, cells were
washed twice with pre-warmed PBS and 1% FBS and incu-
bated at 37°C for 2, 5 or 24 h.
Synchronization of cells and cell cycle analysis
HeLa cells were synchronized in the G1/S phase as
described previously [32]. Briefly, cells were cultivated in
DMEM with 10% fetal bovine serum to 50% confluence,
then 2 mM of thymidine (Sigma, St. Louis, MO) was
added. After 16 h, cells were washed with pre-warmed PBS
and 1% FBS and infected as described above. Cell cycle
distribution was analyzed by flow cytometry (FACS Cali-
bur, Becton-Dickinson, Mountain View, CA) essentially as
described previously [33].
Cell fractionation, RTC isolation and purification of RNA/
DNA
Approximately 2 × 10
7
infected HeLa cells were harvested
using Trypsin (0.5 g/L) in10 mM EDTA and washed with
80 ml cold PBS twice. Fractionation of cells and isolation
of the RTCs was performed essentially as described by Fas-
sati and Goff [3] with several modifications. Hypotonic
buffer for preparation of the cytoplasm was supplemented
with 0.025% Brij 96 to disrupt RTC association with the
cytoskeleton. Nuclei before homogenization were washed
from components of cytoplasm with 0.5% Triton X-100 in
isotonic buffer for 5 min on ice, vortexed for 10 seconds
and precipitated by low-speed centrifugation. The nuclear
pellets were washed twice with isotonic buffer and addi-
tionally separated from cytoplasmic components by cen-
trifugation through density gradient of Iodixanol as
described by Graham et al. [34]. After subsequent wash in
isotonic buffer nuclei were homogenized using EZ-Grind
kit (G Biosciences, St. Louis, MO).
Viral RTCs were purified from cytoplasmic and nuclear
extracts by centrifugation through a 45% sucrose cushion
(in hypotonic buffer for cytoplasmic and in isotonic
buffer for nuclear extracts) at 34,000 RPM (100,000 × g)
in a Beckman SW-60 rotor for 3 h at 4°C. Pellets of HIV-1
RTCs from cytoplasmic and nuclear fractions were resus-
pended in 200 µl of buffer K (20 mM HEPES, pH 7.3, 150
mM KCl, 5 mM MgCl
2
, 1 mM dithiothreitol, and 1 tablet
of Complete Mini EDTA-free protease inhibitor cocktail
[Roche] per 10 ml) [35], snap-frozen in liquid N
2
, and
stored at -80°C.
Immunoprecipitation of RTCs
RTCs were immunoprecipitated from suspensions of puri-
fied cytoplasmic and nuclear complexes according to [36].
Suspensions were diluted by buffer K, aliquoted into 200
µl samples and incubated for 2 h at 4°C with 4 µl of non-
immune rabbit or mouse serum (Sigma) and 2.5 µ g of
protein G-Sepharose 4 Fast Flow (Amersham Biosciences,
Piscataway, NJ) in buffer K containing 1% bovine serum
albumin (BSA) and 1 mg/ml salmon sperm DNA (5
Prime-3 Prime, Boulder, CO). Protein G-bound com-
plexes were pelleted (5000 × g) and clarified supernatants
were reacted with 4 µg of each of the following antibodies:
mouse monoclonal antibodies for MA, RT and IN (ABI,
Columbia, MD), CA [37] and PML (Santa Cruz Biotech-
nology, Santa Cruz, CA); rabbit polyclonal antibodies to
Vpr (a kind gift from Josephine Sire) and Ini1 (Santa Cruz
Biotechnology), and purified mouse and rabbit IgG (Jack-
son's Laboratories) as isotype controls. After an overnight
incubation at 4°C, 2.5 µg of protein G-Sepharose was
added and incubation continued for an additional 2 h.
Protein G-bound immune complexes were pelleted and
washed three times with buffer K supplemented with
0.1% Triton X-100, and washed once without Triton X-
100. DNA was isolated from immune precipitates and
analyzed by real-time PCR. DNA values immunoprecipi-
tated by isotype control were subtracted from the data
obtained with corresponding specific antibody.
Purification of HIV-1-specific nucleic acids and RT
reaction
RNA was purified from suspensions of cPICs and nPICs
using RNA STAT-50LS RNA isolation solution (Tel-Test,
Friendswood, TX) according to manufacturer's protocol.
DNA was purified from suspensions of RTCs mixed with
Retrovirology 2006, 3:4 />Page 11 of 12
(page number not for citation purposes)
5 µg of glycogen using IsoQuick DNA Isolation kit
(ORCA, Bothell, WA). Reverse transcription of isolated
RNA to cDNA for subsequent real-time PCR analysis was
performed using GeneAmp RNA PCR Kit components
(Applied Biosystems, Foster City, CA) according to manu-
facturer's protocol.
PCR analysis
Primers specific for mitochondrial DNA (forward primer,
Mito1: 5'-GAA TGT CTG CAC AGC CAC TT-3'; reverse
primer, Mito2: 5'-AGA AAG GCT AGG ACC AAA CC-3')
were used to assess contamination of the nuclear fraction
with cytoplasmic components. DNA from purified viral
RTCs was analyzed by regular and real-time PCR using
primers M667 (5'-GGCTAACTAGGGAACCCACTG-3')
and AA55 (5'-CTGCTAGAGATTTTCCACACTGAC-3') spe-
cific for the negative-strand "strong-stop" DNA (the early
reverse transcription product), and FOR-LATE (5'-TGTGT-
GCCCGTCTGTTGTGT-3') and REV-LATE-NL43 (5'-
GAGTCCTGCGTCGAGAGATC-3') specific for the late
reverse transcription products [38]. Real-time PCR was
performed in triplicate using iQ SYBR Green Supermix Kit
(BioRad, Hercules, CA) and fluorescence was measured
on CFD 3200 Opticon System. Serial dilutions of DNA
from 8E5 cells (CEM cell line containing a single copy of
HIV-1 LAV provirus per cell) were used as the quantitative
standards [39].
Endogenous reverse transcription
Complexes were incubated with or without dNTP mix (2
mM) for 4 h at 37°C in ERT buffer (100 mM Tris-HCl, pH
8.0; 15 mM NaCl; 5 mM MgCl
2
; 1 mM DTT), and ERT
products were analyzed by real-time PCR with primers
specific for early (a control) and late HIV-1 DNA.
Chromatin isolation
Chromatin was isolated from CEM cells as described pre-
viously [40] with following modifications. Following fix-
ation with 1% formaldehyde cells were lysed with buffer
containing 1% SDS, 10 mM EDTA, 50 mM Tris-HCl, pH
8.1, sonicated to reduce DNA length to 200–1,000 bp,
and debris was removed by centrifugation. The chromatin
solution was pre-cleared on protein G beads pre-adsorbed
with sonicated salmon sperm DNA to minimize non-spe-
cific binding and then incubated with a mixture of anti-
bodies against histone H3 phosphorylated on serine 10
(Upstate Cell Signaling Solutions), Pol II (Santa Cruz)
and 2,2,7 trimethyl-guanosine (Oncogene) overnight at
4°C. Immune complexes were collected using protein G
beads pre-adsorbed with sonicated salmon sperm DNA.
Competing interests
The author(s) declare that they have no competing inter-
ests.
Authors' contributions
SI carried out RTC purification and analysis, immunopre-
cipitation of RTCs, FACS analysis, endogenous RT and
integration assays, and participated in drafting the manu-
script. RB carried out chromatin immunoprecipitation.
MA participated in RTC purification and isolation of HIV-
1 DNA. FK participated in the design of the study and con-
tributed to drafting of the manuscript. MB conceived of
the study, participated in its design and coordination and
drafted the manuscript. All authors read and approved the
final manuscript.
Acknowledgements
The following reagents were obtained through the AIDS Research and Ref-
erence Reagent Program, Division of AIDS, NIAID, NIH: HIV-1 p24 Gag
monoclonal antibody from Michael Malim and HIV-1 HXB2 integrase
antiserum from Duane Grandgenett. pNL43GFP11 plasmid was a gift from
George Pavlakis, pcDNA-Env(MLV) was kindly provided by Dr. Nathaniel
Landau, and the anti-Vpr antibody was a gift from Josephine Sire. Authors
are also grateful to Natella Enukashvily for nuclear purification protocols
and to anonymous reviewers for constructive criticisms that allowed us to
significantly improve the experimental design of this study and interpreta-
tion of the results. We thank Larisa Dubrovsky for excellent technical
assistance. This work was supported in part by the NIH grant R01
AI033776 and R01 AI040386 (MB).
References
1. Farnet CM, Haseltine WA: Integration of human immunodefi-
ciency virus type 1 DNA in vitro. Proc Natl Acad Sci U S A 1990,
87:4164-4168.
2. Nisole S, Saib A: Early steps of retrovirus replicative cycle. Ret-
rovirology 2004, 1:9.
3. Fassati A, Goff SP: Characterization of intracellular reverse
transcription complexes of human immunodeficiency virus
type 1. J Virol 2001, 75:3626-3635.
4. Bukrinsky MI, Sharova N, McDonald TL, Pushkarskaya T, Tarpley
WG, Stevenson M: Association of integrase, matrix, and
reverse transcriptase antigens of human immunodeficiency
virus type 1 with viral nucleic acids following acute infection.
Proc Natl Acad Sci U S A 1993, 90:6125-6129.
5. Heinzinger NK, Bukrinsky MI, Haggerty SA, Ragland AM, Kewalram-
ani V, Lee MA, Gendelman HE, Ratner L, Stevenson M, Emerman M:
The Vpr protein of human immunodeficiency virus type 1
influences nuclear localization of viral nucleic acids in nondi-
viding host cells. Proc Natl Acad Sci U S A 1994, 91:7311-7315.
6. Miller MD, Farnet CM, Bushman FD: Human immunodeficiency
virus type 1 preintegration complexes: studies of organiza-
tion and composition. J Virol 1997, 71:5382-5390.
7. McDonald D, Vodicka MA, Lucero G, Svitkina TM, Borisy GG, Emer-
man M, Hope TJ: Visualization of the intracellular behavior of
HIV in living cells. J Cell Biol 2002, 159:441-452.
8. Farnet CM, Haseltine WA: Determination of viral proteins
present in the human immunodeficiency virus type 1 pre-
integration complex. J Virol 1991, 65:1910-1915.
9. Gupta K, Ott D, Hope TJ, Siliciano RF, Boeke JD: A human nuclear
shuttling protein that interacts with human immunodefi-
ciency virus type 1 matrix is packaged into virions. J Virol 2000,
74:11811-11824.
10. de Noronha CM, Sherman MP, Lin HW, Cavrois MV, Moir RD, Gold-
man RD, Greene WC: Dynamic disruptions in nuclear envelope
architecture and integrity induced by HIV-1 Vpr. Science 2001,
294:1105-1108.
11. Farnet CM, Bushman FD: HIV-1 cDNA integration: require-
ment of HMG I(Y) protein for function of preintegration
complexes in vitro. Cell 1997, 88:483-492.
12. Bustin M: Revised nomenclature for high mobility group
(HMG) chromosomal proteins. Trends Biochem Sci 2001,
26:152-153.
Publish with BioMed Central and every
scientist can read your work free of charge
"BioMed Central will be the most significant development for
disseminating the results of biomedical research in our lifetime."
Sir Paul Nurse, Cancer Research UK
Your research papers will be:
available free of charge to the entire biomedical community
peer reviewed and published immediately upon acceptance
cited in PubMed and archived on PubMed Central
yours — you keep the copyright
Submit your manuscript here:
/>BioMedcentral
Retrovirology 2006, 3:4 />Page 12 of 12
(page number not for citation purposes)
13. Turelli P, Doucas V, Craig E, Mangeat B, Klages N, Evans R, Kalpana
G, Trono D: Cytoplasmic recruitment of INI1 and PML on
incoming HIV preintegration complexes: interference with
early steps of viral replication. Mol Cell 2001, 7:1245-1254.
14. O'Doherty U, Swiggard WJ, Malim MH: Human immunodefi-
ciency virus type 1 spinoculation enhances infection through
virus binding. J Virol 2000, 74:10074-10080.
15. Valentin A, Lu W, Rosati M, Schneider R, Albert J, Karlsson A, Pavlakis
GN: Dual effect of interleukin 4 on HIV-1 expression: impli-
cations for viral phenotypic switch and disease progression.
Proc Natl Acad Sci U S A 1998, 95:8886-8891.
16. Ou W, Xiong Y, Silver J: Quantification of virus-envelope-medi-
ated cell fusion using a tetracycline transcriptional transacti-
vator: fusion does not correlate with syncytium formation.
Virology 2004, 324:263-272.
17. Zhang H, Zhang Y, Spicer T, Henrard D, Poiesz BJ: Nascent human
immunodeficiency virus type 1 reverse transcription occurs
within an enveloped particle. J Virol 1995, 69:3675-3682.
18. Heinzinger N, Baca-Regen L, Stevenson M, Gendelman HE: Efficient
synthesis of viral nucleic acids following monocyte infection
by HIV-1. Virology 1995, 206:731-735.
19. Groschel B, Bushman F: Cell cycle arrest in G2/M promotes
early steps of infection by human immunodeficiency virus. J
Virol 2005, 79:5695-5704.
20. Schwartz O, Marechal V, Friguet B, Arenzana-Seisdedos F, Heard JM:
Antiviral Activity of the Proteasome on Incoming Human
Immunodeficiency Virus Type 1. J Virol 1998, 72:3845-3850.
21. Butler SL, Johnson EP, Bushman FD: Human Immunodeficiency
Virus cDNA Metabolism: Notable Stability of Two-Long
Terminal Repeat Circles. J Virol 2002, 76:3739-3747.
22. Fassati A, Goff SP: Characterization of intracellular reverse
transcription complexes of Moloney murine leukemia virus.
J Virol 1999, 73:8919-8925.
23. Lewis PF, Emerman M: Passage through mitosis is required for
oncoretroviruses but not for the human immunodeficiency
virus. J Virol 1994, 68:510-516.
24. Roe T, Reynolds TC, Yu G, Brown PO: Integration of murine
leukemia virus DNA depends on mitosis. EMBO J 1993,
12:2099-2108.
25. Zennou V, Petit C, Guetard D, Nerhbass U, Montagnier L, Charneau
P: HIV-1 genome nuclear import is mediated by a central
DNA flap. Cell 2000, 101:173-185.
26. Olivero OA, Tejera AM, Fernandez JJ, Taylor BJ, Das S, Divi RL, Poir-
ier MC: Zidovudine induces S-phase arrest and cell cycle gene
expression changes in human cells. Mutagenesis 2005,
20:139-146.
27. Pryciak PM, Varmus HE: Nucleosomes, DNA-binding proteins,
and DNA sequence modulate retroviral integration target
site selection. Cell 1992, 69:769-780.
28. Pruss D, Bushman FD, Wolffe AP: Human immunodeficiency
virus integrase directs integration to sites of severe DNA dis-
tortion within the nucleosome core. Proc Natl Acad Sci U S A
1994, 91:5913-5917.
29. Brussel A, Sonigo P: Analysis of early human immunodeficiency
virus type 1 DNA synthesis by use of a new sensitive assay for
quantifying integrated provirus. J Virol 2003, 77:10119-10124.
30. Kootstra NA, Zwart BM, Schuitemaker H: Diminished human
immunodeficiency virus type 1 reverse transcription and
nuclear transport in primary macrophages arrested in early
G(1) phase of the cell cycle. J Virol 2000, 74:1712-1717.
31. Popov S, Rexach M, Zybarth G, Reiling N, Lee MA, Ratner L, Lane
CM, Moore MS, Blobel G, Bukrinsky M: Viral protein Rregulates
nuclear import of the HIV-1 pre-integration complex. EMBO
J 1998, 17:909-917.
32. Qin X, Sarnow P: Preferential translation of internal ribosome
entry site-containing mRNAs during the mitotic cycle in
mammalian cells. J Biol Chem 2004, 279:13721-13728.
33. Iordanskiy S, Zhao Y, Dubrovsky L, Iordanskaya T, Chen M, Liang D,
Bukrinsky M: Heat shock protein 70 protects cells from cell
cycle arrest and apoptosis induced by human immunodefi-
ciency virus type 1 viral protein R. J Virol 2004, 78:9697-9704.
34. Graham J, Ford T, Rickwood D: The preparation of subcellular
organelles from mouse liver in self-generated gradients of
iodixanol. Anal Biochem 1994, 220:367-373.
35. Bushman FD, Miller MD: Tethering human immunodeficiency
virus type 1 preintegration complexes to target DNA pro-
motes integration at nearby sites. J Virol 1997, 71:458-464.
36. Bukrinsky MI, Sharova N, Dempsey MP, Stanwick TL, Bukrinskaya
AG, Haggerty S, Stevenson M: Active nuclear import of human
immunodeficiency virus type 1 preintegration complexes.
Proc Natl Acad Sci U S A 1992, 89:6580-6584.
37. Simon JH, Fouchier RA, Southerling TE, Guerra CB, Grant CK, Malim
MH: The Vif and Gag proteins of human immunodeficiency
virus type 1 colocalize in infected human T cells. J Virol 1997,
71:5259-5267.
38. Butler SL, Hansen MS, Bushman FD: A quantitative assay for HIV
DNA integration in vivo. Nat Med 2001, 7:631-634.
39. Desire N, Dehee A, Schneider V, Jacomet C, Goujon C, Girard PM,
Rozenbaum W, Nicolas JC: Quantification of human immuno-
deficiency virus type 1 proviral load by a TaqMan real-time
PCR assay. J Clin Microbiol 2001, 39:1303-1310.
40. de La Fuente C, Deng L, Santiago F, Arce L, Wang L, Kashanchi F:
Gene expression array of HTLV type 1-infected T cells: Up-
regulation of transcription factors and cell cycle genes. AIDS
Res Hum Retroviruses 2000, 16:1695-1700.