150 Practice ECGs: Interpretation and Review - Part 2 ppt
Bạn đang xem bản rút gọn của tài liệu. Xem và tải ngay bản đầy đủ của tài liệu tại đây (296.01 KB, 27 trang )
22 50PracticeECGs:InterpretationandReview
Nodal(orjunctional)rhythm.TheretrogradePwavedistortingtheTwaveisprominentin
thisexample.Usuallyitismoresubtle,anditmaybeabsent.EvenwithoutretrogradePwaves,thediagnosis
ofjunctionalrhythmmaybemadewhentherateisregular,islessthan00beats/min,andtherearenoP
waves.TheQRSisusuallynarrow.
Nodal (or junctional) rhythm is recognized by the absence of P waves before the QRS,
and the rhythm is regular. Although tachycardia (rate ≥ 100) is possible, the heart rate
usually is within the normal range. As stimulation of the ventricle comes from the AV
node, the QRS is narrow. There may be retrograde activation of the atria, and inverted
(retrograde) P waves may be seen distorting the T waves (Fig 1.14).
It is a rare day that I read ECGs and do not see a few cases of atrial fibrillation (AF). A
grossly irregular rhythm without P waves indicates the diagnosis (Fig 1.15). The rate is
usually less than 120, as most patients with chronic AF have already had the ventricu-
lar rate, or response, controlled with drugs that slow AV nodal conduction (e.g., digoxin,
b-adrenergic blockers, or the calcium blockers verapamil and diltiazem). Students often
are fooled by more rapid rates in which the irregular irregularities may be subtle (see
Fig 1.15). AF is not an example of AV dissociation. The atria may be beating (or fibril-
lating) at rates as high as 600 beats/min, but the ventricle is stimulated (captured) by
atrial beats that traverse the AV node. Fibrillation waves may be low voltage and invisi-
ble, but often they are coarse enough to distort the baseline (Fig 1.15).
Atrial flutter is a regular rhythm. The atrial rate is typically 300 beats/min. A patient
with a ventricular rate of 150/min has 2:1 AV block; 3:1 AV block produces a
PSVT is a benign rhythm and rarely necessitates DC cardioversion. However, it
is not benign when it causes severe hypotension or angina pectoris. Hemodynamic
compromise or unstable, persistent angina is an indication for immediate
cardioversion of any tachyarrhythmia, be it atrial or ventricular. It is a medical
emergency. There is no time to wait for the cardiology consultant. If you delay,
the patient may well need CPR before long. Set the defibrillator to “synchronize”
and start with 50 joules, as low-voltage cardioversion may work for atrial
arrhythmias.
BaselineData 2
ventricular rate of 100/min. Flutter waves with a saw tooth appearance are usually
apparent in at least one ECG lead (see Fig 1.15). When you see a regular rate of
150/min on a telemetry rhythm strip, think of atrial flutter and order a 12-lead ECG to
look for flutter waves.
At times, flutter waves (which are P waves) cannot be seen on the surface ECG, and
it is not possible to tell whether the patient has atrial flutter or PSVT because both are
narrow QRS complex tachyarrhythmias. If the rate is 140/min or 160/min, it probably
is not flutter. But at a rate of 150/min it could be either. Placing an ECG lead closer to
the heart, using an esophageal or right atrial electrode, allows detection of P waves. In
fact, the P waves are larger than QRS complexes when measured from the right atrium
and easy to see. With PSVT, there is one P wave with each QRS, and with flutter there
are two or more for each QRS. You will not see flutter with 1:1 conduction and a
ventricular rate of 300/min. If and when that occurred, a heart rate of 300 beats/
min would be too rapid to allow diastolic filling and would lead to hemodynamic
collapse.
Atrial flutter, like AF, is not an example of AV dissociation. There is a definite rela-
tionship between atria and ventricles, with P waves intermittently getting through the
AV node and stimulating the ventricles.
Fourpatientswithsupraventriculartachyarrhythmia.:Atrialfibrillation(AF)withrapidven-
tricularresponse;athigherrates,thevariationintheRRintervalseenwithAFmaybesubtle.
:AFwitha
controlledventricularresponse;withdrugtherapytoslowAVnodeconduction,theventricularrateiskept
between0and00/min.Inthiscase,youcanseethefibrillationwavesascoarseundulationinthebase
-
line.
:Atrialflutterwith2:block;notethesaw-toothpatterninthebaseline.:Atrialflutterwith:
block;theflutterwavesaremoreobvious.
2 50PracticeECGs:InterpretationandReview
The reentrant tachyarrhythmias caused by the preexcitation syndrome are common,
and this topic is a favorite of board examiners. I like it as a Board question because
understanding it indicates a feeling for reentry.
Normally, there is a layer of connective tissue separating the atria and ventricles that
serves as insulation, preventing free passage of electrical impulses between the upper
and lower chambers (Fig 1.16). The AV node is the normal passage through this layer
of insulation. Pre-excitation of the ventricle occurs because of an additional defect in
the insulation between atria and ventricles. This defect is called a bypass tract, or acces-
sory pathway. Bypass tracts have been identified at multiple locations within this region
of surface contact between atria and ventricles. Wolff-Parkinson-White (WPW) syn-
drome refers to the most common of these bypass tract locations, and pre-excitation is
the more generic term for any syndrome involving a bypass tract between atria and
ventricles (WPW syndrome is thus a subset of pre-excitation).
As the wave of depolarization passes through the atria, it leaks through the bypass
tract as well as into the AV node (see Fig 1.16). Conduction through the bypass tract is
usually faster than AV nodal conduction. As current exits the bypass tract, it stimulates
ventricular depolarization; the ventricle is pre-excited, which is a catchy way of saying
that a segment of the ventricle is stimulated early. An instant later, current exits the AV
node and also stimulates the ventricle. The ventricular complex thus originates from
two sites and may be considered a fusion beat.
The QRS is wider than normal and starts earlier after the P wave, so the PR interval
is short. (Note that this does not reflect more rapid conduction through the AV node.)
The initial, slurred tract is the delta wave (see Fig 1.16).
Diagnosis of pre-excitation: PR interval < 0.12 second, plus a delta wave (Fig 1.17)
Bypass tracts may conduct either antegrade or retrograde. A premature atrial contrac-
tion that finds the accessory pathway refractory may pass through the AV node,
capture the ventricle, conduct retrograde through the bypass tract, and establish a reen-
trant circuit with repetitive firing of the ventricles. Unlike other cases of reentry, there is
New atrial flutter in an elderly, bedridden patient with minimal symptoms may
be an early sign of pulmonary embolus which has caused right atrial overload.
One of my teachers suggested thinking of flutter as a rhythm indicating right
atrial disease and AF as a left atrial arrhythmia. I realize that this is a bit simplistic,
and that patients with left heart failure can have atrial flutter. Nevertheless, it is
interesting how often flutter complicates pulmonary problems such as obstructive
lung disease or pulmonary embolus. AF, on the other hand, is a common com-
plication of hypertension, a left-heart problem. Furthermore, atrial flutter is
ablated by creating a burn in the right atrium. The mild burn works like insula-
tion, interrupting the arrhythmia’s circuit. AF ablation involves creating a burn
line around the origin of the pulmonary veins in the left atrium.
BaselineData 25
no protected, small reentrant focus (as in Fig 1.12). Rather, the circuit includes the AV
node, the atrium, the bypass tract, and some portion of the ventricle.
When antegrade conduction and stimulation of the ventricles is through the AV
node, the reentrant arrhythmia looks like PSVT with a narrow QRS complex (and, in
fact, it is PSVT). A reentrant circuit in the opposite direction (see Fig 1.16), retrograde
through the AV node and antegrade through the bypass tract, has a wide QRS complex
Pre-excitation(orWolff-Parkinson-Whitesyndrome).Thiscartoonillustratesthechanges
causedbyabypasstractbetweentheatriaandventricles.ThetractislocatedontheLVsideandnearthe
mitralvalveinthisparticularpatient,butbypasstractsmaybelocatedatanysitewhereatriaandventricles
comeintocontact.SimultaneousactivationoftheventriclesviathebypasstractandtheAVnodeproduces
afusionbeat.ConductionthroughthebypasstractisfasterthanthroughtheAVnode.Earlyactivationof
theventricleproducesthedeltawaveandmakesthePRintervalappearshort.
AreentrantcircuitcandevelopbetweenthebypasstractandtheAVnode,resultinginsupraventricular
tachycardia.Therearetwopossibilities.
:ThereentrantcircuitmovesantegradethroughtheAVnode,ret-
rogradethroughthebypasstract.Thesequenceofventricularactivationisthereforenormal,andtheQRS
isnarrow.
:ThereentrantcircuitisdirectedretrogradethroughtheAVnodeandantegradethroughthe
bypasstract.BecauseactivationoftheventriclesoriginatesfromthelateralwalloftheLV,theQRScomplex
iswide.
26 50PracticeECGs:InterpretationandReview
because the sequence of ventricular activation is abnormal. It may look like ventricular
tachycardia (VT).
How can you tell whether this wide QRS tachycardia is ventricular or supraventricu-
lar? At times you cannot. The clinical setting helps. A young patient with a history of
PSVT, no other heart disease, wide-complex tachycardia, and no alteration of con-
sciousness is likely to have PSVT with bypass tract reentry. An older patient with a
history of heart failure or MI, and who has had syncope or near-syncope, should be
treated assuming a diagnosis of VT. When in doubt, it is hard to go wrong treating the
arrhythmia as probable VT. Direct current (DC) cardioversion is appropriate if the
patient is unstable.
It is important to identify PSVT that is caused by pre-excitation because the drug
treatment is different. Digoxin, beta blockers, verapamil, and intravenous adenosine
should be avoided because they slow AV nodal conduction, but not conduction
through the bypass tract. If the patient develops AF or atrial flutter, drugs that slow AV
node conduction favor conduction through the bypass tract. Bypass tracts conduct
more rapidly than the AV node, so there could be a big increase in ventricular rate.
Membrane-active agents, on the other hand, slow accessory pathway conduction;
intravenous procainamide is a good choice for a patient with WPW syndrome who is
having PSVT.
Procainamide has been used for long-term management of pre-excitation. A newer
and more effective therapy is catheter ablation of the bypass tract, and it is usually a
Most of the time a wide QRS indicates infranodal conduction disease. As you will
see in the next chapter, initial depolarization of the ventricle is normal, and the
region of the ventricle supplied by the blocked nerve is activated late. Thus, with
left bundle branch block, the left side is depolarized late. The result is slurring of
the tail end of the QRS complex. The wide QRS of preexcitation is different. It
is the initial phase of depolarization that is affected, so the front end of the QRS
is slurred.
Pre-excitation(Wolff-Parkinson-Whitesyndrome).ThePRintervalisshort,andtheQRSis
slightlywidened.SlurringoftheupstrokeoftheQRSisapparentinmultipleleads(I,aVL,theVleads);
thisisthe
deltawave.
BaselineData 2
Symptomatic bradyarrhythmia is the usual indication for cardiac pacing. Two
exceptions to this are (1) asymptomatic infranodal heart block including complete
heart block and Mobitz II second-degree block, and (2) asymptomatic sinus
pauses of more than 4 seconds. Both conditions can lead to syncope or sudden
death. With other bradyarrhythmias, pacemaker therapy is not necessary in the
absence of symptoms.
It often is hard to be sure that the patient’s symptoms are related to an
observed arrhythmia. Since the sick sinus syndrome is rarely fatal, a period of
observation—perhaps with event monitoring—is better than rushing into pace-
maker therapy. Medicine adjustment may help an elderly patient; with atrial
arrhythmias and vague symptoms, it is safe to try that.
An interesting feature of the sick sinus syndrome is that the medicines needed
to control the symptomatic rapid rhythm (digoxin, beta blockers, or calcium
channel blockers) may aggravate the bradyarrhythmia. Treatment may thus com-
bine pacing (to prevent bradycardia) and drug therapy (to prevent tachycardia).
This is the most common indication for pacemaker therapy in the United States.
cure. A catheter electrode is positioned next to the bypass tract, radiofrequency energy
is applied, and the tissue touching the catheter is burned. There is no smoke or an
odor of burning flesh; it is more like a sunburn. Subsequent scarring effectively plugs
the hole in the insulation. It is a relatively low-risk procedure and is better than life-
long drug therapy, especially when drug therapy fails to prevent PSVT.
The sick sinus syndrome is not just one arrhythmia, and it is rarely diagnosed with a
single ECG. Rather, a variety of arrhythmias occur at different times. It most commonly
affects the elderly. Most patients have SA node dysfunction, which causes bradycardia.
Patients with sick sinus syndrome have alternating bradycardia and supraventricular
tachycardias. This seemingly paradoxical juxtaposition of slow and rapid heart rhythms
is also called the brady-tachy syndrome. The supraventricular tachycardia may be
PSVT, atrial fibrillation, or flutter—or some combination of these. The rhythm may
shift from one form of supraventricular tachycardia to another within a short time.
Bouts of tachycardia may be followed by disturbingly long pauses. Both rapid and slow
rhythms can cause dizziness or syncope. Diagnosis of the sick sinus syndrome requires
demonstrating a variety of these arrhythmias in a patient who has symptoms.
Electrophysiology testing is rarely needed to make the diagnosis. When it is done,
the test to assess SA node function is simple. The atria are paced at a rapid rate for a
few minutes. When the pacer is turned off, a sick sinus node takes a long time to start
beating; the “sinus node recovery time” is prolonged.
These rhythms are irregular (Fig 1.18). They are distinguished from atrial fibrillation by
P waves before each QRS complex. The P waves have varying morphologies, usually
2 50PracticeECGs:InterpretationandReview
three different patterns within a 12-lead ECG. The P waves apparently originate from
varying sites in the atria. The only difference between the arrhythmias is the heart
rate: when it is rapid, it is called multifocal atrial tachycardia. Both are common
arrhythmias in patients with obstructive lung disease.
Ventricular Arrhythmias
Most of us have PVCs, and they are a common finding on routine ECGs (Fig 1.19).
Because they originate within the body of one of the ventricles, activation of the two
ventricles is not simultaneous and the QRS is wide. PVCs and other ventricular
rhythms may come from an automatic focus, tissue that is insulated from the surround-
ing muscle and fires automatically at a fixed rate. When it discharges between heart-
beats, at a time when the surrounding muscle has repolarized and can be stimulated (is
vulnerable), it produces a PVC. On the other hand, when the ectopic focus discharges
while the ventricle is depolarized or before it is repolarized (during a QRS or a T
wave), the ventricle is refractory to stimulation, and there is no PVC. Interestingly, this
is the way old-fashioned, fixed-rate pacemakers work: they click along at a regular
rate, capturing the ventricle only when it is vulnerable.
A second, and probably more common, mechanism for ventricular beats is reentry,
a concept discussed previously in relation to PSVT (see Fig 1.12). The reentrant focus
is within the body of the ventricle, possibly an area of fibrosis or ischemia. Current
enters the focus, but it is insulated from surrounding tissue. Conduction through the
reentrant focus is slow. By the time the wave of depolarization exits the focus, the
Wanderingatrialpacemaker.Theselimbleadsarefromapatientwithobstructivelungdis-
ease.ThevariationinPwavemorphologyisseeninleadII.Thisistheothercauseofanirregularrhythm.In
theabsenceofobviousPwavesbeforeeachQRS,thediagnosiswouldbeatrialfibrillation,amorecommon
arrhythmia.Atratesabove00/min,wanderingatrialpacemakerbecomesmultifocalatrialtachycardia.
BaselineData 2
surrounding ventricle has been repolarized and can be stimulated, causing the PVC. A
circuit may develop with repetitive stimulation of the ventricle. Most cases of VT are
thought to be reentrant rhythms. By convention, we often refer to extra beats or
abnormal rhythms as ectopic, regardless of the mechanism (automatic or reentrant
focus).
When reading ECGs, a common dilemma is deciding whether an ectopic beat is a
PVC or is a PAC that is aberrantly conducted because of a blocked nerve below the AV
node. Aberrant conduction produces a QRS complex that is wide and hard to distinguish
from a PVC. One cause of wide-complex tachycardia is PSVT with aberrant infranodal
conduction.
Ventriculararrhythmias.:Isolatedprematureventricularcontraction(PVC).:Aventricular
triplet;ventriculartachycardia(VT)isdefinedasthreeormorePVCsinarow.
:SustainedVT.:
Ventricularfibrillation,theusualcauseofsuddencardiacdeath.
IsolatedPVCsarecommonintheabsenceoforganicheartdisease.Morecomplexforms,including
pairedPVCsandVT,maybetheconsequenceofLVdysfunctionoracuteischemia.
0 50PracticeECGs:InterpretationandReview
There are a few characteristics that help to make the distinction between PVCs and
PACs with aberrancy. Aberrant PACs distort the QRS less, and the QRS axis tends to be
similar to that of normal beats. That is to say, where normal beats have an upright
(positive) QRS, the ectopic QRS is also upright. The PVC’s T wave axis is often opposite
the QRS axis (i.e., when the QRS is positive, the T wave is negative). Aberrant conduc-
tion commonly affects the right bundle branch, which seems a weak link in the
infranodal conduction system. Thus, aberrantly conducted PACs often have a right
bundle branch block pattern (see Chapter 2 for a description of right bundle branch
block). Occasionally, the ectopic P wave can be seen distorting the preceding T wave,
suggesting a PAC.
While helpful, these general characteristics are not totally reliable, and there is often
uncertainty about the origin of extra beats.
Ventricular fibrillation is the usual cause of sudden cardiac death (see Fig 1.19). Frequent
PVCs in a setting of acute MI indicate a high risk of ventricular fibrillation. With chronic
heart disease, there is a hierarchy of ventricular arrhythmias which may indicate a risk
of sudden death (see Fig 1.19).
A wide QRS complex tachycardia may be VT, but it may also be supraventricular
tachycardia with aberrant conduction. Even rapid atrial fibrillation with associated
bundle branch block can look like VT (although on close inspection, the rhythm is
more irregular with AF). The clinical context helps differentiate between VT and PSVT.
Patients with acute MI or with a history of congestive heart failure are at high risk for
developing VT. On the other hand, a young person without chest pain who is clinically
stable—with the exception of palpitations—is more likely to have a supraventricular
arrhythmia. When there is a history of recurring episodes, consider a preexcitation syn-
drome like the WPW syndrome.
The one ECG finding that allows you to diagnose VT with certainty is AV dissociation.
During VT, if there is no retrograde conduction of ventricular impulses through the AV
node to the atria (and there usually is not), the atria continue to beat independently.
There are P waves clicking along at a regular rate that is slower than the VT rate, and
these may be seen on the surface ECG (Fig 1.20). When electrophysiologists are unsure
of the cause of wide-complex tachycardia, they record an ECG from within the right
atrium. At this location, P waves are huge and easy to see: AV dissociation makes the
diagnosis of VT.
Torsade de pointes is a curious form of VT that is a favorite of Board examiners. The
QRS complexes are polymorphic (variable) with an undulating pattern (Fig 1.21). The
axis of each successive beat is different from the preceding one—the axis is “turning
about a point.” Conditions and drugs that cause QT interval prolongation may precipi-
tate the arrhythmia. Most antiarrhythmic drugs have a paradoxical proarrhythmic
action; torsade is the typical arrhythmia that may be caused by the class IA drugs
(quinidine, procainamide, and disopyramide). It may be prevented by avoiding other
conditions that prolong the QT interval as well as by combinations of drugs that
lengthen the QT (see Table 1.2).
BaselineData
Serious ventricular arrhythmias occur in patients with left ventricular (LV) dys-
function. And those with LV dysfunction usually have ventricular arrhythmias.
This association is so reliable that the syncope workup includes an echocardio-
gram. A normal LV excludes ventricular tachycardia. Furthermore, a severely
depressed LV is an indication for prophylaxis with an implantable defibrillator,
even without symptoms.
There are a few exceptions to this association of ventricular arrhythmias and
poor LV function: (1) VT or VF may occur during the first 12 hours of MI, even
when the MI is small and LV function is normal—”electrical storm” develops
during a brief period of instability; (2) hypertrophic cardiomyopathy may cause
ventricular fibrillation and sudden death, and LV contractility is normal or hyper-
dynamic; (3) the long QT interval syndromes described below; (4) right ventricu-
lar dysplasia, a rare congenital abnormality.
VentriculartachycardiawithAVdissociation.FindingintermittentPwaves(markedwithdots)
thatdonotaltertheventricularrhythmisthemostreliableindicationthatthetachycardiaoriginatesinthe
ventricle.Ifitoriginatedintheatrium,therewouldnecessarilybearelationshipbetweenatrialbeats(P
waves)andventricularbeats.YoumayconsiderthisidentificationofPwavesastretch;itisraretoseethem
onasurfaceECG.Pwavesareobviousonanelectrogramrecordedintherightatrium,andthisistheelec
-
trophysiologicmaneuverfordeterminingtheoriginofwideQRScomplextachycardia.
Torsadedepointesisanundulating,polymorphicVTinwhichtheaxisofeachsuccessive
beatisdifferentfromthatoftheprecedingone.
2 50PracticeECGs:InterpretationandReview
Torsade is important to recognize because its management is different from that of
other forms of VT. Measures that shorten the QT interval are most effective.
Intravenous magnesium often works. Increasing the heart rate also shortens the QT
(with either temporary pacing or intravenous isoproterenol infusion).
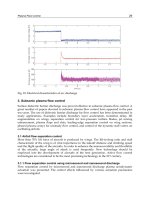
ECGAbnormalitiesCausedbyDrugsandMetabolicConditions
Rate
Sinusbradycardia
b-Adrenergicblockers,calcium Hypoxemia,hypothyroidism,
channelblockers(verapamil hyperkalemia,hypothermia
anddiltiazem),digitalis,
intravenousadenosine
Sinustachycardia Catecholamines,caffeine, Hyperthyroidism,anemia,
amphetamines fever
Rhythm
Heartblock Digitalis,
b-adrenergicblockers, Hyperkalemia
calciumchannelblockers
(verapamil,diltiazem),
intravenousadenosine
Atrialflutter Hypoxemia(consider
pulmonaryembolus)
Atrialfibrillation Thyroidhormone Hyperthyroidism,hypokalemia,
hypomagnesemia
Ventriculartachycardia/ Mostantiarrhythmicagents Hypokalemia,hypomagnesemia,
fibrillation (proarrhythmia),digoxin,
tricyclicoverdose
Torsadedepointes ClassI(antiarrhythmicagents FamiliallongQTsyndrome
(quinidine,procainamide,
disopyramide),sotalol,
amiodarone,phenothiazine
derivatives(including
antihistamines),tricyclic
overdose
Hypomagnesemia prolongs the QT interval and is a cause of torsade de pointes.
Remember that magnesium and potassium move in tandem: conditions or drugs
(diuretics) that lower potassium also lower magnesium. Spironolactone causes
renal retention of both potassium and magnesium and is effective treatment for
hypomagnesemia. The magnesium ion is poorly absorbed—it is a cathartic—so
magnesium replacement therapy does not work.
Table 1.2 summarizes conditions and drugs that may alter intervals. Table 1.3 extends
this to changes in rate and rhythm. While not comprehensive, it includes the common
conditions and drug effects that you may encounter while reading routine ECGs (and
taking Board exams).
BaselineData
Electrical Axis
The wave of depolarization passes through the heart in three dimensions, but each
two-pole ECG lead records these events in just one dimension. Having 12 leads that
are grouped in horizontal or frontal (vertical) planes allows us to reconstruct these
events in three-dimensional space (see Fig 1.2). We are able to determine the spatial
orientation, or axis, of each electrical event in the cardiac cycle.
Atrial depolarization starts high in the right atrium and moves down and to the left,
toward the AV node (see Fig 1.3). The general direction, or axis, of the P wave is thus
about 60° in the frontal plane. Because ECG lead II has its positive pole at 60° (see Fig
1.2), we would expect the P wave to be positive in that lead, and to have its maximum
deflection or current in that lead. Lead aVR, with an orientation of -150°, would be
expected to have a negative P wave.
What about the P wave in lead aVL, oriented just 90° from lead II? Simple vector
principles tell us that measuring a vector from a perpendicular position produces a net
measurement of zero. That is to say, the forces moving toward the position of measure-
ment are balanced by the forces moving away. In lead aVL, the normal P wave either
has little amplitude or is biphasic, with negative and positive deflections that are similar
(in effect, canceling each other).
The P wave axis is not usually measured; as long as it is positive in inferior leads, it
is good enough. When it is negative in those leads, it indicates an ectopic atrial pace-
maker located in the lower part of the atrium and depolarizing the atrium from bottom
to top. This has little clinical significance, but it is worth comment in the context of
reading ECGs.
QRS Axis
From the AV node, the wave of depolarization moves first to the interventricular
septum, discharging it from left to right, then through the body of the two ventricles
(see Fig 1.3). The left ventricle is much thicker than the right and produces more
voltage. The net vector of ventricular depolarization is therefore down and/or to the
left in the frontal plane, normally about 60°, but ranging from -30° to +110°.
Measurement of the QRS axis in the frontal plane is a technical challenge for most
students. It is not that hard, and the practice ECGs will help you to learn to do it
quickly. The ECG computer measures the QRS axis with the simple principle of vector
addition (Fig 1.22). You can easily do that with graph paper, and the result is accurate,
but there are faster ways.
One quick and simple method uses the principle that the QRS amplitude will be
maximum and positive in the lead whose orientation is closest to the axis of the QRS
vector. Thus, if the QRS axis is 0°, the QRS should have maximum amplitude in lead I.
If the QRS axis is 90°, maximum amplitude should be in lead aVF. If leads I and aVF
are both positive and with equal amplitude, the QRS should be half-way between
them, or 45°. It is a crude approach, but at least it allows you to place the QRS vector
within a quadrant.
50PracticeECGs:InterpretationandReview
BaselineData 5
CalculationoftheQRSaxis:threeexamples.Vectoradditionisasimpleprocess.Choose
anytwoleads(thefigureusesleadsIandaVF)andplotthenetvoltage.Moveoneoftheseplottedvectors
sothatitstailispositionedattheheadoftheother(
dottedline).Thesumofvectoradditionistheline
drawnfromtheoriginoftheheadoftherepositionedvector(
boldline).ThisisthemeanQRSvector,andit
iswhatthecomputerdoestoplotitsdirection.
TherearefasterwaystoestimatetheQRSvectoraxis.Lookfirstatexample
.InleadI,thepositiveand
negativeforcesalmostcanceleachother;netvoltageisjust0.mV(mm).Whenthistinyvectorismoved
toaVF,theresultingmeanORSvectorisquiteclosetoaVF.IfthenetforcesinleadIequaled0mV(i.e.,
leadIwasisoelectric),therewouldhavebeennodisplacementofthemeanvectorfromaVFatall.Thefinal
QRSaxiswouldbe0°.ThisillustratesthemethodIuseforestimatingtheQRSaxis:findaleadwherethe
QRSisisoelectric(orclosetoisoelectric).TheQRSvectorisperpendiculartothatlead.
Trythisfortheothertwoexamples.
:TheQRSisisoelectricinleadaVL;0°fromaVLis+60°,and
thatistheQRSvector.Whyisitnot
-20°,0°intheotherdirectionfromaVL?SimplybecausetheQRS
ispositiveintherightlowerquadrantleads(I,II,aVF).
:TheQRSisalmostisoelectricinII;0°fromIIis
either
-0°or+50°.BecausetheQRSispositiveintheleftsideleads(IandaVL),theaxisiscloseto
-0°.Actually,thenetforcesinIIareslightlynegative,whichpushesthevectoralittlefarthertotheleft.I
amcallingtheaxis
-5°,identifyingthisasleftaxisdeviation(LAD).
Another method uses the principle that a net vector amplitude of zero indicates that
the direction of the vector is perpendicular (90°) to the voltmeter’s orientation. Thus, if
the positive and negative QRS deflections are equal, that is to say isoelectric (or add up
to zero) in lead I of the ECG, the QRS vector is pointed at +90° or -90°. If the QRS is
positive in lead aVF, the axis must be +90°.
That is the method I use. I find a lead where the positive and negative QRS deflec-
tions are equal—where the QRS is isoelectric. The QRS axis is perpendicular to that lead;
90° in a direction that is quickly determined by looking at the general direction of the
QRS vector (Fig 1.22).
It may not be possible to find an isoelectric lead for which positive and negative
deflections are equal. In this case, I choose a lead for which the deflection is close to
isoelectric. For example, if the positive forces in lead aVL are slightly, but not much,
higher than the negative forces, the axis is close to 60°, but actually a little more in the
direction of aVL (perhaps 55°). It is a good approximation.
As we work through the first of the practice ECGs, we will pay close attention to
measuring the QRS axis.
T Wave Axis
The T wave axis, like the P wave axis, is not usually calculated. Generally, it is in the
same direction as the QRS axis. Where the QRS is positive, the T wave is also positive.
T wave inversion—a T wave axis opposite that of the QRS—in an abnormal finding
that is discussed in the next chapter.
▼
37
Morphologic Changes
in P, QRS, ST, and T
Chapter 2
You have recorded rate, rhythm, intervals, and the QRS axis. The next step in reading
the ECG is to evaluate the P wave, QRS complex, ST segment, and T wave for abnor-
malities, and then give a final interpretation. This is an exercise in pattern recognition.
Yet ECG changes logically reflect what is happening with the heart’s anatomy and
physiology. All of it makes more sense if you think of mechanism while learning diag-
nostic criteria.
Atrial (P Wave) Abnormalities
Left Atrial Abnormality
There are two possible patterns of left atrial abnormality (LAA). The most common is a
biphasic P wave in lead V
1
(Fig 2.1). For it to be significant, the negative deflection has to
be deep enough and wide enough to contain a small box (1 ¥ 1 mm). The biphasic P is
CLINICAL INSIGHT
Left atrial abnormality (LAA) occurs when there is pressure or volume overload
of the atrium. Patients with hypertension and left ventricular hypertrophy have
elevation of the LV diastolic pressure, and this is transmitted to the left atrium
since the mitral valve is open during diastole. The left atrium must contract
against the stiff LV. LAA has been identified as the most consistent, early ECG
abnormality in hypertension, appearing well before other features of left ven-
tricular hypertrophy. Before this discovery I often read ECGs with isolated LAA
as borderline rather than abnormal. Now I call such ECGs abnormal, as LAA
indicates an end-organ effect of elevated pressure—hypertensive heart disease—
and a need for more aggressive antihypertensive therapy.
LAA can be a transient finding. It may be present during acute pulmonary
edema, and gone on the next day’s tracing after diuresis, which lowers left atrial
pressure.
38 150PracticeECGs:InterpretationandReview
most common in conditions that increase left ventricular diastolic pressure—and there-
fore left atrial pressure—including congestive heart failure and left ventricular
hypertrophy.
A second LAA pattern is a broad, notched P wave in lead II, III, or aVF (Fig 2.1). It
may be present only in lead II. The notched P wave is most common in patients with
marked dilatation of the left atrium, as may be seen with mitral stenosis or regurgita-
tion, and is referred to as “P mitrale.”
Right Atrial Abnormality
Normally, P waves are less than 2.5 mm tall (in any lead). In right atrial abnormality
(RAA), the P waves are tall and narrow, and they appear peaked (Fig 2.2). P amplitude
≥ 2.5 mm in those leads oriented along the P wave axis (the inferior limb leads, II, III,
and aVF) usually indicates RAA. This often is referred to as “P pulmonale” because it
may be caused by advanced lung disease with associated pulmonary artery hyperten-
sion. It is seen with pulmonary hypertension caused by congenital heart disease as
well.
Intraventricular Conduction Abnormalities
Normally, the wave of depolarization exits the bundle of His, moves through the two
bundle branches, and activates the two ventricles simultaneously (see Fig 1.3). When
one of the bundle branches, or one of their major divisions, is injured and conduction
is blocked, the affected ventricular region is stimulated late by current that has spread
from an adjacent ventricular region. Late activation creates a deflection at the terminal
end of the QRS complex, making the overall QRS complex wider. A QRS duration of
0.12 second or more (3 mm) is the first diagnostic criterion for bundle branch
block.
Right Bundle Branch Block
When the right bundle branch is blocked (RBBB), the interventricular septum and the
left ventricle are activated normally (Fig 2.3). Current then spreads from the left to the
right ventricle, which is depolarized late. Electrical events that occur early—septal and
FIGURE 2.1 Leftatrialabnormality(LAA).TwoECGfindingsmaybeusedtomakethediagnosis.
A:BiphasicPwaveinleadV
1
;thenegativedeflectionshouldbe1mmdeepandwide.B:Broad,notched
Pwaveinoneofthelimbleads,mostcommonlyII,III,oraVF,asthePwavevectorisaimedattheinferior
leads.
CHApTER 2:MorphologicChangesinP,QRS,ST,andT 39
FIGURE 2.2 Rightatrialabnormality(RAA).Tall,peakedPwavesininferiorleads(atleast2.5mminone
oftheleads).
left ventricular activation—are thus unchanged. What is different is an extra deflection
at the end of the QRS caused by late, right ventricular depolarization.
I will restate this with reference to specific changes on the ECG. But first, recall a
basic principle of electrocardiography regarding the polarity of leads. Each lead has
spatial orientation and polarity (see Fig 1.2). A wave of depolarization that moves
toward the positive pole of a lead produces a positive (upright) deflection, an R wave.
If the wave of depolarization moves away from the positive and toward the negative
pole of a lead, it still is detected, but it produces a negative (downward) deflection,
an S wave.
Back to RBBB (see Fig 2.3): Lead V
1
, on the right side of the chest, sits just over the
right ventricle (RV) and is a sensitive detector of right ventricular events. In RBBB,
lead V
1
first records normal septal activation, a positive deflection, or R wave, because
the septum depolarizes from left to right. The left ventricle (LV) is activated normally,
and in lead V
1
this produces a negative deflection, or S wave, as the wave of depolar-
ization moves posteriorly and to the left. Finally, current works its way from the LV to
the RV—remember, it could not get there directly because of the blocked right bundle.
The vector of RV depolarization is aimed at V
1
; thus, the terminal deflection in V
1
is positive
(upright), another R wave. RBBB thus produces an RSR¢ pattern in V
1
. In other leads,
terminal forces (the RV vector) also are oriented toward the right. Thus, terminal
QRS forces in the left-side leads, such as I, aVL, and V
6
, would be negative (an S
wave).
RBBB diagnosis: RSR’ pattern in V
1
, and QRS ≥ 0.12 second.
40 150PracticeECGs:InterpretationandReview
FIGURE 2.3 Rightbundlebranchblock(RBBB).Followthesequenceofventricularactivation,andits
effectonleadsIandV
1
,which,inthefigure,areappropriatelypositioned.(1)Thereisnormalseptal
activationfromlefttoright.(2)Leftventricularactivationisnormal.(3)Becausetherightbundle
branchisblocked,currentmustmovefromtheleftventricletotheright,andthisoccurslate.Thetailend
oftheQRSisslurredbecauseoflatedepolarizationoftherightside.Patternrecognition:RSRinV
1
+wide
QRS.
CHApTER 2:MorphologicChangesinP,QRS,ST,andT 41
Incomplete Right Bundle Branch Block
Incomplete right bundle branch block (IRBBB) is usually a normal variant, but in
some cases it reflects RV hypertrophy or dilatation. Our ECG computer program
interprets it as “RV volume overload.” IRBBB is a common, almost invariable, finding
with atrial septal defect (ASD), in which the RV may pump two or three times as
much blood as the LV. ASD may cause no symptoms until a person reaches age 50.
Thus, the diagnosis of ASD may be suggested by a routine ECG in an otherwise
healthy young adult.
IRBBB diagnosis: RSR’ pattern in V
1
, and QRS duration < 0.12 second.
CLINICAL INSIGHT
When I ask students how to exclude atrial septal defect (ASD) in a young person
with incomplete right bundle branch block (IRBBB), the usual answer is an
echocardiogram. However, ASD is a rare finding in people with IRBBB, so you
would order many normal echocardiograms before finding an ASD. A more rea-
sonable approach would be a physical exam looking for fixed splitting of the
second heart sound. It is not a subtle finding, and its absence excludes ASD. If
there is uncertainty a relatively inexpensive chest x-ray can also exclude the
diagnosis; the radiologist easily recognizes pulmonary plethora. Finally, the more
expensive echocardiogram is indicated if these screening studies are abnormal.
ASD is a common congenital heart abnormality, and for this reason it is com-
monly encountered on board exams. If you suspect ASD expect to see IRBBB on
the ECG. Without it the diagnosis is unlikely.
Left Bundle Branch Block (LBBB)
In LBBB, the sequence of ventricular activation is almost the opposite of that described
with RBBB. The left bundle innervates the interventricular septum, so initial septal
depolarization, normally from left to right, is lost (Fig 2.4). The initial small negative
deflection in left-side leads (I, aVL, V
6
) is lost—the so-called septal Q wave. The septum
is instead activated from right to left, causing an initial positive deflection in left-side
leads. Because the right ventricle is thin walled, little current is produced by RV
excitation. Septal and early left ventricular activation predominate, and current gener-
ated by RV discharge (which would be oriented anterior and to the right) is buried
within the LV complex. LV activation is slow because of the blocked left bundle, and the
QRS complex is wide. The terminal forces are aimed at the blocked side, to the left;
therefore, the terminal portion of the QRS is positive in left-side leads such as I, aVL,
and V
6
(see Fig 2.4).
42 150PracticeECGs:InterpretationandReview
FIGURE 2.4 Leftbundlebranchblock(LBBB).Followthesequenceofventricularactivation.(1)Thenor-
malleft-to-rightdepolarizationoftheseptumisinterruptedbytheblockedleftbundlebranch.Theseptum
isactivatedfromrighttoleft.(2)Activationofthethin-walledrightventricleproduceslittlecurrent.(3)
Theleftventricleisdepolarizedlatebycurrentworkingitswayoverfromtherightside,andterminalQRS
forcesareorientedtowardtheleft.
Patternrecognition:broadpositivecomplex—oftennotched—inleft-sideleads(I,aVL).SmallQwaves
intheseleadswouldexcludeLBBBbecausetheywouldindicatenormal,left-to-rightactivationofthesep
-
tum.ThispatientalsohadmarkedLAD.TwavechangesandprolongationoftheQTintervalmayaccom
-
panyLBBB.ItisnotpossibletodiagnoseeitherleftventricularhypertrophyorMIinthepresenceofLBBB.
chapter 2:MorphologicChangesinP,QRS,ST,andT 43
Left Anterior and Posterior Fascicular Block
The fascicular blocks, or hemiblocks, cause changes in the QRS axis. The left bundle
divides into anterior and posterior branches, or fascicles. The anterior fascicle is a thin
nerve that runs through the septum close to the right bundle branch. It is relatively
susceptible to injury, possibly because of its size and location, and left anterior
fascicular block (LAFB) is common. The left posterior fascicle is a broad group of nerves
that fans out through the posterior region of the interventricular septum. Possibly
because of the space it occupies, it is less susceptible to injury than the anterior branch,
and left posterior fascicular block (LPFB) is less common than LAFB.
Diagnostic criteria: The QRS complex is not necessarily wider than normal; the diag-
nosis of fascicular block is made when there is a shift in axis.
1. LAFB: Extreme left axis deviation, at least -45°, not caused by inferior myocardial
infarction (MI).
2. LPFB: Right axis deviation (RAD) > 90° (some have suggested more extreme RAD,
as much as 110° or 120°).
This is a bit oversimplified, as other conditions may cause a shift in QRS axis. The most
common of these is inferior MI with deep Q waves in inferior leads causing extreme
left axis deviation. Inferior infarction does not alter conduction through the left ante-
rior fascicle. When there are inferior Q waves (reviewed later in this chapter), the diag-
nosis is left axis deviation rather than LAFB.
Bifascicular Block
Think of the infranodal system as having three branches, or fascicles: the right bundle
and the two branches of the left bundle. LBBB, or block of both branches of the left
bundle, could be considered bifascicular block. However, the term is usually reserved
for RBBB plus block of one of the two branches of the left bundle (RBBB plus LAFB,
or RBBB plus LPFB).
cLINIcaL INSIGht
The ECG computer will occasionally describe an “intraventricular conduction
defect” when the pattern looks like left bundle branch block (LBBB). Look more
closely at leads I and aVL. The computer probably has detected a tiny Q wave,
indicating normal left-right depolarization of the interventricular septum. LBBB
interrupts this, so the presence of a “septal Q” excludes LBBB.
The left bundle is a broad complex of nerves in the interventricular septum,
occupying a lot of space. For this reason LBBB usually indicates heart disease,
with an abnormal echocardiogram. In contrast, the right bundle is a long, thin
nerve that can be blocked by a small amount of fibrosis. The echocardiogram may
show no structural or functional abnormality.
LBBB diagnosis: QRS duration ≥ 0.12 second plus a broad, positive complex in left-side
leads (I, aVL, and V
6
).
44 150PracticeECGs:InterpretationandReview
Because of the anatomic proximity of the right bundle and left anterior fascicle, con-
ditions that injure one often affect the other; the combination of RBBB plus LAFB is
observed in as many as 1 in 25 hospitalized patients. The diagnosis is simple: there is
RBBB plus extreme left axis deviation (LAD). This condition does not necessarily
reflect advanced, serious heart disease. A small amount of fibrosis may block the two
nerves. Many patients with RBBB plus LAFB have normal LV function and no other
structural cardiac abnormalities.
By contrast, patients with other forms of bifascicular block—RBBB plus LPFB, or
LBBB—usually have detectable, structural problems, such as poor LV function, isch-
emic injury, or hypertrophy.
CLINICAL INSIGHT
AV nodal block and infranodal block are both common, so it is no surprise that
they are occasionally seen together. Earlier, there was concern about the patient
with first-degree AV block who also has bifascicular block (right bundle branch
block [RBBB] plus left anterior fascicular block [LAFB]). If the long PR interval
is from conduction delay in the one remaining infranodal nerve, the left posterior
fascicle, then the patient might be at risk for complete heart block. This was the
subject of the first clinical studies using His bundle recording (see Fig 1.8). The
result: virtually all patients with long PR + RBBB + LAFB have a long A-H inter-
val, e.g., block in the AV node. The H-V interval—infranodal conduction—is
normal. Prophylactic pacemaker therapy is unnecessary.
Ventricular Hypertrophy, QRS Amplitude,
and R Wave Progression
First, the big picture; then we will get to the specifics. Pressure overload of a ventricle
may be caused by increased vascular resistance downstream, or ventricular outflow
tract obstruction. The ventricle responds to pressure overload by adding muscle, just as
you add muscle to your arms with weight lifting. Increased muscle thickness on one
side of the heart or the other may cause a shift in QRS axis toward the hypertrophied
side and an increase in voltage (more muscle, more voltage).
The large coronary artery branches are located on the epicardial surface of the heart,
and they send blood to underlying muscle through small perforating branches. An
increase in ventricular thickness means an increase in the distance from the epicardial
artery to the endocardium. Blood supply to the subendocardial region—farthest from
the epicardial source—may be compromised, causing changes in the ST segment and T
wave that look ischemic. It is commonly referred to as a strain pattern. In a sense, the
ventricle outgrows its blood supply. Most coronary blood flow occurs during diastole.
The relative reduction in flow to subendocardial regions with hypertrophy is aggra-
vated by high ventricular diastolic pressures.
Finally, high ventricular diastolic pressures are reflected back to the atria, causing
atrial (P wave) abnormalities on the ECG.
CHApTER 2:MorphologicChangesinP,QRS,ST,andT 45
FIGURE 2.5 Leftventricularhypertrophy(LVH).ThispatientwithaorticstenosishadLAA,highQRSvolt-
age(V
2
),ST-Tchangesinlateralleads(thetypicalLVstrainpattern),andwideQRS.HedidnothaveLAD,
andtheintrinsicoiddeflectionwasborderline(seeTable2.1).
Table 2.1 TheEstesPointSystemforLeftVentricularHypertrophy(LVH)
1. Amplitude 3points
Anyofthefollowing
(a) LargestRorSwaveinthelimbleads
≥20mm
(b) SwaveinV
1
orV
2
≥30mm
(c) RwaveinV
5
orV
6
≥30mm
2. ST-Tchanges(typicalpatternofleftventricularstrainwiththeSTsegmentvector
shiftedindirectionoppositetothemeanQRSvector,usuallySTdepression)
Withoutdigitalis 3points
Withdigitalis 1point
3. Leftatrialabnormality 3points
4. Leftaxisdeviation(
-30°ormore) 2points
5. QRSduration
≥0.09second 1point
6. IntrinsicoiddeflectioninV
5
andV
6
≥0.05second 1point
LVH
=5ormorepoints
ProbableLVH
=4points
Left Ventricular Hypertrophy
Predictably, left ventricular hypertrophy (LVH) causes an increase in LV voltage plus ST
segment depression and T wave changes in these leads with high voltage (the LV strain
pattern), a shift in axis to the left, and LAA (Fig 2.5). In addition, there may be slight
widening of the QRS to more than 0.09 second, and some patients develop LBBB.
However, LBBB changes the QRS complex enough that LVH cannot be diagnosed
when LBBB is present. The initial upstroke of the R wave in V
5
and V
6
, from baseline
to its peak—called the intrinsicoid deflection—may be prolonged to over 0.04 second.
This is the time that it takes the LV to be activated, and it is longer when the ventricle
is thickened.
A patient with LVH may not have all these ECG findings, especially early in its
development (Fig 2.5). The diagnosis can be made when just some of these features
are present, but with fewer findings the certainty of the diagnosis is lower. The Estes
scoring system is provided in Table 2.1. A point total of 5 makes the diagnosis of LVH,
and with 4 points, the patient has probable LVH. Use of multiple diagnostic criteria
rather than QRS voltage alone gives good specificity (fewer false positives, less
overdiagnosis).
46 150PracticeECGs:InterpretationandReview
On the other hand, the sensitivity of the ECG in detecting LVH is poor; it tends to
underdiagnose. Using an ECG point system, both anatomic and echocardiographic cor-
relation studies have shown that just half the cases of true LVH meet rigid ECG criteria.
Relaxing the diagnostic criteria, by using voltage alone for example, increases sensitiv-
ity but also increases the number of false positives. This choice between sensitivity and
specificity is a common dilemma when reading ECGs.
FIGURE 2.6 Rightventricularhypertrophy(RVH).Thisyoungwomanwithprimarypulmonaryhyperten-
sionhadrightwardaxis,atallRinV
1
,deepSinV
6
,andST-Tchangesintherightprecordialleads(theRV
strainpattern).ShedidnothaveRAA(seeTable2.2).
CLINICAL INSIGHT
In general, avoid overdiagnosis. Left ventricular hypertrophy (LVH) demonstrates
the importance of this principle. Young people often have high QRS voltage,
particularly if thin or athletic. Using voltage alone to diagnose LVH could mean
assigning that diagnosis to a healthy person. LVH is considered bad heart disease,
and carrying that diagnosis would be a problem for anyone applying for a job or
for insurance. It seems better to stick with strict ECG diagnostic criteria for LVH,
recognizing the insensitivity of the ECG.
A counter argument is that LVH is a serious heart condition. For example, a
person with coronary artery disease has a worse prognosis with the addition of
LVH. Any ECG finding that would lead to earlier diagnosis and treatment might
justify the risks of overdiagnosis.
In most cases, I place my vote for specificity (first, do no harm). When there
is doubt, it can be sorted out with an echocardiogram.
Right Ventricular Hypertrophy
Most of the voltage in the QRS complex is generated by the LV, which is much thicker
than the RV. This makes the QRS complex in the right-side precordial leads (V
1
and V
2
)
negative, and that in the left-side precordial leads (V
4
–V
6
) positive. The transition from
negative to positive complexes usually occurs around V
3
–V
4
. That changes with right
ventricular hypertrophy (RVH). As you would expect, RVH causes an increase in RV
voltage over the right chest leads and an associated shift in QRS axis toward the right.
There is often a strain pattern in leads reflecting high RV voltage (Fig 2.6). Specific
diagnostic criteria are outlined in Table 2.2.
CHApTER 2:MorphologicChangesinP,QRS,ST,andT 47
Table 2.2 DiagnosisofRightVentricularHypertrophy
Criteria
R/SinV
1
≥1,or
RinV
1
≥7mm,or
RinV
1
+SinV
5
orV
6
>10.5mm
Supportivefindings
Rightaxisdeviation
≥110°
Rightatrialabnormality(RAA)
STdepression
+TwaveinversioninV
1
orV
2
(RVstrain)
CLINICAL INSIGHT
Cor pulmonale is common, but it is diagnosed infrequently. Consider it when a
patient with chronic lung disease has peripheral edema. The ECG may or may
not show evidence for right ventricular hypertrophy (RVH), but the echocardio-
gram should demonstrate RV and right atrial enlargement. Low oxygen satura-
tion on room air is common. The treatment is continuous oxygen therapy, which
allows the midsize pulmonary arteries to relax. When oxygen saturation is bor-
derline for home oxygen, the presence of cor pulmonale (edema) is an indication
for treatment.
RVH may not cause all these changes. The voltage changes alone may be used to
make the diagnosis. I feel more confident when there is also ST-T change or axis shift.
The possibility of false positives is enough that I usually hedge when reading ECGs
with no clinical history. On the other hand, in the presence of a condition that may
cause RVH (e.g., lung disease with probable cor pulmonale, mitral valve, or congenital
heart disease, which can cause pulmonary hypertension, or primary pulmonary hyper-
tension), the typical ECG pattern indicates RV pressure overload, most commonly from
elevated pulmonary artery pressure.
Delayed, or Poor, R Wave Progression in Precordial Leads
To this point, each section has considered a cardiac diagnosis. This and a number of fol-
lowing sections will consider ECG findings that do not clearly indicate anatomic or
functional abnormalities, and that must be recognized in the interpretation as
nonspecific.
As noted previously, negative (S wave) forces predominate over right chest (precor-
dial) leads. There is transition in the midprecordial leads, and the QRS should be iso-
electric by lead V
3
, with positive and negative forces equal. In leads V
4
–V
6
the R wave
amplitude should exceed negative forces. Delay in transition, or poor R wave progres-
sion, simply means that this transition point is further to the left (Fig 2.7), and that
more of the precordial leads have (net) negative voltage.