Cardiovascular Imaging A handbook for clinical practice - Part 2 pps
Bạn đang xem bản rút gọn của tài liệu. Xem và tải ngay bản đầy đủ của tài liệu tại đây (599.53 KB, 31 trang )
Magnetic resonance imaging (MRI) is the most recent imaging technique in
the field. The morphologic and functional information MRI can provide is very
similar to echocardiography, with somewhat lesser time and space resolution
than transesophageal echocardiography. Atrial fibrillation substantially de-
grades image quality. Morphologic abnormalities of the leaflets can be detected,
as well as high-velocity regurgitant jets. Regurgitant fraction can be calculated
as the difference between left ventricular inflow and outflow, or between the
difference of end-diastolic and end-systolic left ventricular volume on the one
hand and aortic stroke volume on the other hand.
5
Left ventricular volumes
and ejection fraction are assessed very accurately by MRI. Moreover, MRI can
potentially provide much supplemental information in one examination, such
as data on the presence and extent of myocardial scar, regional perfusion, and
non-invasive coronary angiography (which, although currently rudimentary,
is steadily improving). While these advantages, often summarized in the con-
cept of “one-stop shopping” are impressive, practical reasons, apart from cost,
nowadays and most likely in the future too will prevent MRI from superseding
echocardiography, which will remain the first, and most often also the only, im-
aging technique needed. MRI at this time may be seen as an alternative tech-
nique if echocardiography cannot provide the necessary data. MRI can be safely
performed in the presence of prosthetic valves, but is hazardous in the presence
of a pacemaker.
Echocardiography in mitral regurgitation
Mitral valve morphology
Severe MR is always accompanied by morphologic abnormalities of the mitral
Mitral regurgitation 17
**
PML
AML
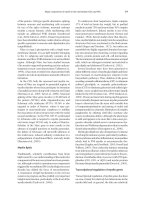
Figure 2.3 Three-dimensional
echocardiography of a patient with
prolapse (**) of the anterior leaflet of
the mitral valve. AML, anterior mitral
leaflet; PML, posterior mitral leaflet.
BCI2 6/17/05 10:04 PM Page 17
valve structure or configuration. Specific morphologic assessment of the mitral
valve apparatus includes the following:
• Leaflet morphology: leaflets are thickened in myxomatous (classic) mitral valve
prolapse, degenerative disease, and rheumatic disease. Endocarditic lesions
may manifest as vegetations, pseudoaneurysms (a form of abscess), defects, and
rupture of subvalvular structures as chordae. Calcification, especially of the
posterior annulus and leaflet, occurs in advanced age, hypertension, renal in-
sufficiency, and rheumatic valve disease.
• Leaflet mobility: mobility can be conceptually divided into normal, excessive,
and restricted.
6,7
Excessive mobility is present in prolapse and flail (Fig. 2.3),
while restricted mobility is caused by calcification or rheumatic disease. The
most important cause of restricted mobility is eccentric pull (tethering) via the
papillary muscles in a dilated ventricle resulting from coronary heart disease
with ventricular remodeling (ischemic cardiomyopathy) or dilated cardiomy-
opathy, leading to incomplete closure of the mitral leaflets. In these circum-
stances, the mitral annulus is usually also dilated to some degree. Importantly,
ischemic MR may be dynamic (i.e. may dramatically increase from minor to
severe during acute ischemia).
8,9
This mechanism can be unmasked by exercise
stress.
• Damage to the subvalvular apparatus: typical examples are (degenerative or en-
docarditic) chordal or (ischemic) papillary muscle rupture, leading to a flail
leaflet or scallop with severe regurgitation. In rheumatic heart disease, the sub-
valvular apparatus, in particular the chordae, are thickened, calcified, and
shortened.
Morphologic assessment should include not only the type of damage, but also
the location of the lesion (Fig. 2.4). The posterior leaflet can be subdivided into
three scallops, and the anterior leaflet can also be divided in three correspon-
ding segments, although these are anatomically less well-defined than the pos-
terior leaflet scallops. The nomenclature is either anatomic or follows the
Carpentier classification (P1–3 and A1–3). The scallops of the posterior leaflet
are usually designated anterolateral (P1, adjacent to the A1 region of the anteri-
or leaflet), central (P2, adjacent to A2), and posteromedial (P3, adjacent to A3).
The location of mitral valve pathology (e.g. a prolapse) has important implica-
tions for repairability.
2
It is also important to correlate morphologic findings
with Doppler findings. Restricted leaflet motion leads to regurgitant jets
directed towards the side of the affected leaflet, while excessive leaflet motion
leads to regurgitant jets directed away from the affected leaflet.
Doppler assessment of hemodynamics
MR should be evaluated by color Doppler using all available windows, espe-
cially the apical views. Mitral regurgitant jets are often eccentric (Fig. 2.1b).
Visual estimation of the maximal color Doppler jet and relating it to left atrial
area yields a rough estimate of severity, but moderate and severe degrees cannot
be reliably separated in this way, and eccentric, wall-hugging jets are severely
underestimated by the jet area method. While very small and very large jets are
18 Chapter 2
BCI2 6/17/05 10:04 PM Page 18
usually well identified, the intermediate severities are impossible to grade reli-
ably by color jet area. An important sign of severe MR that should always be
evaluated is reduced or reversed systolic pulmonary venous flow (Fig. 2.5). In
eccentric jets, it may be useful to sample both upper pulmonary veins to detect
flow reversal.
Several quantitative approaches to evaluating MR severity have been vali-
dated and are clinically feasible, if image quality is good.
10
1 Measurement of the proximal jet diameter, which evaluates the regurgitant
orifice by measuring the smallest diameter of the regurgitant jet immediately
downstream from its passage through the leaflet.
2 The proximal convergence zone method (PISA method). This technique
Mitral regurgitation 19
Figure 2.4 Mapping of the mitral valve by multiplane transesophageal
echocardiography (schematic drawing). Four cross-sections from a transesophageal
transducer position centered on the mitral valve are shown in a “surgeon’s view” of the
mitral valve, together with the relationship of the mitral leaflets as they are seen in
these cross-sections: at 0°, corresponding to a four-chamber view; at 45°, representing
an intermediate view; at 90°, corresponding to a two-chamber view; and at 135°,
corresponding to a long axis view of the left ventricle. Different scallops of the posterior
leaflet (pML) are visualized in the different views: the central scallop (pML/CS,
corresponding to P2 in the Carpentier nomenclature) is seen in the four-chamber and
the long axis view; the anterolateral scallop (pML/AL, corresponding to P1) in the 45°
intermediate view; and the posteromedial (pML/PM, corresponding to P3) in the two-
chamber and in the intermediate view. AML, anterior mitral leaflet; AO, aortic valve.
(Reproduced with permission from Flachskampf FA, Decoodt P, Fraser AG, Daniel WG,
Roelandt JRTC. Recommendations for performing transesophageal echocardiography.
Eur J Echocardiogr 2001;
2:8–21.)
BCI2 6/17/05 10:04 PM Page 19
analyzes the flow field upstream from the regurgitant orifice (i.e. on the ven-
tricular side of the mitral valve; Fig. 2.6).
3 Calculation of regurgitant fraction based on the difference between transmi-
tral stroke volume, calculated from pulsed-wave Doppler and mitral annular
diameter, and transaortic stroke volume or the difference between ventricular
stroke volume (end-diastolic minus end-systolic left ventricular volume) and
transaortic stroke volume.
Right ventricular systolic pressure as assessed by measuring tricuspid regurgi-
tation velocities is elevated in substantial MR, sometimes to severe pulmonary
hypertension levels.
20 Chapter 2
Figure 2.5 Pulsed wave Doppler recording from the left upper pulmonary vein in
severe mitral regurgitation (MR) (same patient as Fig. 2.1). Systolic backward flow is
present (arrows), indicating severity of regurgitation.
LV
LA
Figure 2.6 Transesophageal view of
mitral regurgitation with large central
jet and prominent proximal
convergence zone (arrow).
BCI2 6/17/05 10:04 PM Page 20
Evaluation of left heart morphology and left ventricular function
Quantitative morphologic parameters of the left ventricle important for the
management of severe MR are as follow:
1 End-systolic and end-diastolic left ventricular diameters (or volumes): chronic (but
not acute!) MR of more than mild severity leads to end-diastolic enlargement
(dilatation) of the left ventricle as a consequence of volume overload. Initially,
end-systolic diameter remains unaffected, thus leading to an increased shorten-
ing fraction, reflecting a hyperkinetic, volume-loaded ventricle. Increase in the
end-systolic left ventricular dimension signals contractile impairment. A cut-
off of 45 mm has been shown to predict persistent impaired left ventricular
function after surgical correction of MR.
11
2 Left atrial enlargement: more than mild chronic regurgitation leads to left atrial
enlargement. In chronic severe MR, atrial fibrillation inevitably ensues, further
promoting left atrial dilatation. The anteroposterior systolic diameter classically
measured by M-mode is a relatively insensitive measure of left atrial enlarge-
ment. Left atrial enlargement is best assessed by planimetry of the left atrium in
the four-chamber view.
3 Left ventricular ejection fraction, similar to fractional shortening, is of para-
mount importance in assessing MR and identifying candidates for surgical cor-
rection, especially in asymptomatic patients. Because MR initially leads to a
hyperkinetic ventricle by increasing preload and decreasing afterload, even a
low-normal ejection fraction (less than 60%) should be taken as a sign of begin-
ning contractile dysfunction. Exercise ejection fraction may be used to unmask
latent contractile dysfunction. Patients with severe MR who are unable to raise
their ejection fraction in response to physical exercise (i.e. lacking contractile
reserve) are candidates for surgical repair even in the presence of a normal ejec-
tion fraction.
12
With state-of-the-art echocardiographic equipment most if not all these data
can be acquired from the transthoracic echo. In patients difficult to image or
with questionable results, transesophageal echocardiography is the next diag-
nostic step. Confirmation of the underlying mitral pathology and its location by
transesophageal echocardiography, especially if the patient is a surgical candi-
date, will usually be sought to give the surgeon as much preoperative informa-
tion as possible.
Ejection fraction calculation by echocardiography has considerable inter-
observer, intraobserver, methodologic (e.g. monoplane or biplane disk
summation method), and day-to-day variability, the latter mostly resulting
from changes in loading conditions such as arterial blood pressure. This vari-
ability needs to be kept in mind. Substantially more accurate and reproducible
measurements of left ventricular volumes and ejection fraction are possible
with 3D echoechocardiography or MRI, although this does not address the
problem of load dependency of ejection fraction. Thus, in a few selected patients
difficult to image or with inconclusive echocardiographic findings, an MRI may
be clinically helpful.
Mitral regurgitation 21
BCI2 6/17/05 10:04 PM Page 21
22 Chapter 2
Other important clinical situations
Acute severe mitral regurgitation
Acute MR is usually ischemic (e.g. papillary muscle rupture) or endocarditic in
origin. Some typical features of severe chronic MR are missing in severe acute
regurgitation:
1 Regardless of the severity of regurgitation, neither the left atrium nor the left
ventricle are necessarily enlarged. At least initially, sinus rhythm is often pre-
served. However, the presence of enlargement does not exclude acute regurgi-
tation, because concomitant or previous disease may have led to previous
chamber enlargement.
2 Global left ventricular dysfunction is not a typical feature of acute MR,
and typically there is left ventricular hyperkinesis as a response to the vol-
ume loading of acute regurgitation. However, left ventricular dysfunction does
not exclude this condition, because there may be concomitant myocardial
disease.
Case Presentation (Continued)
Transthoracic echocardiography reveals a dilated left ventricle (end-diastolic
diameter 59 mm; end-systolic diameter 41 mm). The ejection fraction is
calculated to be 54%. The mitral valve is mildly and diffusely thickened, with a
flail portion of the posterior leaflet well visible in the apical four-chamber view,
indicating flail of P2 (central scallop of the posterior leaflet). There is an
anteriorly directed, eccentric jet of MR with a proximal diameter of 8 mm, a
reproducible proximal convergence zone on the left ventricular side of the
mitral valve, and clearly reduced systolic forward pulmonary venous flow in
the right upper pulmonary vein. The left atrium is mildly enlarged. There is
moderate tricuspid regurgitation, with right ventricular systolic pressure
calculated from the peak tricuspid regurgitant velocity to be 38 mmHg plus right
atrial pressure.
In summary, this patient has asymptomatic, severe MR with low normal
left ventricular function, sinus rhythm, and a presumably repairable lesion.
Following the guidelines,
13,14
this constitutes a recommendation for mitral valve
repair.
If ejection fraction was clearly in the upper normal range (more than 60%),
stress echocardiography might be useful to determine whether ejection fraction
increases during exercise. Failure to increase ejection fraction would indicate
incipient impairment in myocardial contractility in spite of normal resting
function.
12
A transesophageal echocardiogram would be additionally useful to
confirm location and repairability of the regurgitant lesion.
BCI2 6/17/05 10:04 PM Page 22
Mitral prosthetic regurgitation
With ever-increasing numbers of patients with mitral valve replacement, this
scenario is becoming increasingly important. Importantly, the size of the left
atrium and ventricle, as well as the level of pulmonary hypertension are influ-
enced by pre-existing disease and therefore have to be interpreted with caution
with respect to the severity of MR. Because of the difficulties inherent in imag-
ing valve prostheses, transesophageal echocardiography is usually necessary
for evaluation. Mitral prosthetic regurgitation can have several etiologies:
1 Bioprosthetic degeneration: the wear-and-tear lesions of bioprostheses may re-
main entirely clinically silent before a large tear suddenly manifests as torrential
regurgitation.
2 Infective endocarditis: endocarditis often leads to ring abscesses which destroy
the anchoring of the prosthesis in its bed. Regurgitation may range from par-
avalvular leakage to dehiscence, defined as abnormal mobility (“rocking“) of
the whole prosthesis, to embolism of the entire prosthesis. Furthermore, endo-
carditis can affect bioprosthetic leaflets in a similar manner as native valve
leaflets.
3 Paravalvular leakage or dehiscence (Fig. 2.7): may occur as the result of suture
insufficiency.
4 Mechanical (and rarely, biological) prosthetic thrombosis or pannus interference: may
fix the occluder or leaflets in a half-open, half-shut position, leading to both
severe stenosis and regurgitation.
5 Prosthetic strut fracture: this is a very rare cause of acute massive prosthetic re-
gurgitation, leading to embolization of the occluder.
Mitral regurgitation 23
LA
LV
RA
Figure 2.7 Lateral dehiscence
(arrow) of a mitral bioprosthesis.
Transesophageal four-chamber view
in systole, showing displacement and
tilting of the prosthesis towards the left
atrium. RA, right atrium. (Reproduced
with permission from Lambertz H,
Lethen H. Atlas der Transösophagealen
Echokardiographie. Stuttgart: Thieme,
2000.)
BCI2 6/17/05 10:04 PM Page 23
Role of imaging in management decisions in
mitral regurgitation
The decision to treat MR surgically depends on careful appreciation of the fol-
lowing issues:
13,14
•Presence of severe MR, at least if MR is the principal reason for surgery.
• Symptom status (dyspnea).
• Left ventricular function. Even mildly impaired or borderline left ventricular
function constitutes an indication for valve surgery, even in the absence
of symptoms. On the other hand, severely impaired left ventricular func-
tion (ejection fraction less than 30%) carries a high surgical risk for valve
replacement.
• Amenability of mitral pathology to repair surgery, especially if sinus rhythm
can likely be preserved.
These issues can almost always be resolved by careful clinical and echocar-
diographic evaluation of the patient. In a few cases, contrast ventriculography,
together with right heart catheterization, or MRI may be helpful.
References
1Croft CH, Lipscomb K, Mathis K, et al. Limitations of qualitative angiographic grading
in aortic or mitral regurgitation. Am J Cardiol 1984;53:1593–8.
2 Gillinov AM, Cosgrove DM, Blackstone EH, et al. Durability of mitral valve repair for
degenerative disease. J Thorac Cardiovasc Surg 1998;116:734–43.
3 Macnab A, Jenkins NP, Bridgewater BJM, et al. Three dimensional echocardiography
is superior to multiplane transesophageal echo in the assessment of regurgitant mitral
valve morphology. Eur J Echocardiogr 2004;5:212–22.
4 Kuhl HP, Schreckenberg M, Rulands D, et al. High-resolution transthoracic real-time
three-dimensional echocardiography. J Am Coll Cardiol 2004;43:2083–90.
5 Hundley WG, Li HF, Willard JE, et al. Magnetic resonance imaging assessment of the
severity of mitral regurgitation: comparison with invasive techniques. Circulation
1995;92:1151–8.
6 Carpentier A. Cardiac valve surgery: the “French correction”. J Thorac Cardiovasc Surg
1983;86:323–37.
7 Stewart WJ, Currie PJ, Salcedo EE, et al. Evaluation of mitral leaflet motion by
echocardiography and jet direction by Doppler color flow mapping to determine the
mechanism of mitral regurgitation. J Am Coll Cardiol 1992;20:1353–61.
8 Lancellotti P, Lebrun F, Pierard LA. Determinants of exercise-induced changes in
mitral regurgitation in patients with coronary artery disease and left ventricular
dysfunction. J Am Coll Cardiol 2003;42:1921–8.
9 Pierard LA, Lancellotti P. The role of ischemic mitral regurgitation in the pathogene-
sis of acute pulmonary edema. N Engl J Med 2004;351:1627–34.
10 Zoghbi WA, Enriquez-Sarano M, Foster E, et al. Recommendations for evaluation of
the severity of native valvular regurgitation with two-dimensional and Doppler
echocardiography. J Am Soc Echocardiogr 2003;16:777–802.
11 Enriquez-Sarano M, Tajik AJ, Schaff HV, et al. Echocardiographic prediction of left
ventricular function after correction of mitral regurgitation: results and clinical im-
plications. J Am Coll Cardiol 1994;24:1536–43.
24 Chapter 2
BCI2 6/17/05 10:04 PM Page 24
12 Leung DY, Griffin BP, Stewart WJ, Cosgrove DM III, Thomas JD, Marwick TH. Left
ventricular function after valve repair for chronic mitral regurgitation: predictive
value of preoperative assessment of contractile reserve by exercise echocardiogra-
phy. J Am Coll Cardiol 1996;28:1198–205.
13 Bonow RO, Carabello B, de Leon AC Jr, et al. ACC/AHA guidelines for the manage-
ment of patients with valvular heart disease: a report of the American College of
Cardiology/American Heart Association Task Force on practice guidelines (com-
mittee on management of patients with valvular heart disease). J Am Coll Cardiol
1998;32:1486–588.
14 Iung B, Baron G, Butchart EG, et al. A prospective survey of patients with valvular
heart disease in Europe: The Euro Heart Survey on Valvular Heart Disease. Eur Heart
J 2003;24:1231–43.
Mitral regurgitation 25
BCI2 6/17/05 10:04 PM Page 25
CHAPTER 3
Aortic stenosis
Benjamin M. Schaefer and Catherine M. Otto
26
Case Presentation
A 79-year-old man was admitted with syncope after walking up an incline. He
felt progressively weak, sat down, and subsequently lost consciousness, fully
regaining all capacity when the ambulance arrived. On examination there is a
3/6 late-peaking systolic murmur radiating to the carotids, a single second heart
sound, and carotid upstrokes are diminished and delayed. The
electrocardiogram (ECG) demonstrates left ventricular hypertrophy. He is
thought to have severe aortic stenosis and admitted to hospital for further
management.
Etiology
Valvular aortic stenosis is caused either by progressive calcification of a trileaflet
valve, a process thought to be similar but not identical with atherosclerosis, cal-
cification of a congenitally bicuspid valve, or rheumatic valve disease. Other
causes are rare and include a congentially unicuspid valve, and supravalvular
and subvalvular stenosis.
1
A normal aortic valve has three mobile, thin leaflets designated as the right,
left, and non-coronary cusps. A bicuspid valve has two leaflets in either
right–left or anterior–posterior configuration. The normal, non-stenotic aortic
valve has an opening area of 3–4 cm
2
; which is equivalent to the area of the left
ventricular outflow tract (LVOT) or aortic annulus. Acquired valvular stenosis is
characterized by leaflet thickening and calcification that can be detected using
various imaging modalities. As calcification and fibrosis (or commissural fusion
with rheumatic disease) progress, leaflet motion becomes restricted, eventual-
ly resulting in restriction of valve opening area. This progressive narrowing
results in an increasing antegrade velocity of blood flow across the valve, cor-
responding to a pressure gradient between the left ventricle and aorta during
systole. The constrained orifice and the high-velocity jet form the basis for
assessment of aortic stenosis severity.
BCI3 6/18/05 11:12 AM Page 26
Assessment of aortic stenosis
The evaluation of aortic stenosis can be divided into several components:
1 The anatomy and pathologic features of the valve leaflets
2 The severity of valve obstruction
3 The effect of chronic pressure overload on the left ventricle and pulmonary
vasculature
4 Associated dilatation of the ascending aorta
5 In selected cases, the dynamic changes in valve area with exercise or phar-
macologic intervention
Imaging of the valve
Direct imaging of the diseased aortic valve allows determination of the number
of valve leaflets, the etiology of stenosis, and the severity of leaflet calcification.
2
Imaging also is important to exclude other causes of outflow obstruction,
such as a subaortic membrane or obstructive hypertrophic cardiomyopathy.
Transthoracic two-dimensional (2D) echocardiography is the standard clinical
approach for imaging the aortic valve, although the basic principles apply to any
imaging modality including three-dimensional (3D) echocardiography, mag-
netic resonance imaging (MRI) and computed tomography (CT).
On echocardiography, the transthoracic parasternal long axis view is used to
determine the diameter of the LVOT and ascending aorta, and for visualization
of valve motion (Fig. 3.1) The right and the non-coronary cusps are usually seen
in this view and the degree of valve calcification can be assessed. A bicuspid
valve often has an asymmetric closure line, slight doming of the leaflets in sys-
tole, and a flat closure line or frank prolapse in diastole (Fig. 3.2). Calcific steno-
sis shows increased leaflet thickness and echogenicity with reduced systolic
motion. In the short axis view, a trileaflet valve can be distinguished from a
Aortic stenosis 27
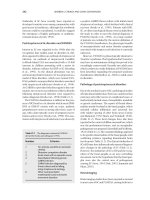
Figure 3.1 Parasternal (A) long and (B) short axis views of a calcified trileaflet aortic
valve. The valve is shown closed in diastole. L, left coronary cusp; LVOT, left ventricular
outflow tract; N, non-coronary cusp; R, right coronary cusp.
BCI3 6/18/05 11:12 AM Page 27
bicuspid valve by the number of leaflets in systole. Many bicuspid valves have a
prominent raphe in one leaflet so that frame-by-frame analysis and identifica-
tion of the number of commissures is needed for diagnosis of bicuspid valve. In
addition, once severe calcification is present it may not be possible to identify
the number of leaflets. Rheumatic disease is diagnosed based on commissural
fusion and calcification with a central triangular orifice, in contrast to the stel-
late orifice in calcific disease (Fig. 3.3).
Direct images of the valve are seldom used for planimetry of valve area be-
cause of inaccuracy resulting from reverberations from valve calcification and
the complex 3D shape of the valve orifice. In some patients, a valve orifice can
be visualized with transesophageal echocardiography (TEE), but caution
is needed to ensure the image plane is at the smallest valve orifice. Three-
dimensional echocardiographic or MRI of the valve may provide better delin-
eation of the stenotic orifice in systole,
3
but these approaches are rarely used
because the critical clinical information is obtained from the Doppler data (Fig.
3.4). Multislice CT quantification of aortic valve calcification volume correlates
with valve gradients and area,
4
which provides a new parameter for assessment
of disease severity, although the clinical utility of valve calcium scores is as yet
unknown. Valve calcification can be visualized on fluoroscopy and may ini-
tially be noted at the time of coronary angiography.
Severity of valve obstruction
Jet velocity and pressure gradient
Doppler echocardiography is the standard clinical approach for assessing steno-
sis grade, as maximum aortic jet velocity can be used to calculate mean systolic
gradient and also contributes to the calculation of valve area, using the continu-
ity equation. As the valve narrows, the velocity of blood flow increases with jet
28 Chapter 3
Figure 3.2 Bicuspid aortic valve. Two examples of a bicuspid valve are shown.
(A) Leaflet orientation is anterior–posterior with a prominent raphe in the anterior
leaflet. (B) Leaflet orientation is left–right.
BCI3 6/18/05 11:12 AM Page 28
Aortic stenosis 29
DIASTOLE
SYSTOLE
CALCIFIC RHEUMATIC
Figure 3.3 Schematic diagrams of valve anatomy is a short axis orientation of calcific
aortic stenosis showing the complex stellate orifice in systole (left) and rheumatic
stenosis (right) with a central triangular orifice with commissural fusion. Rheumatic
disease typically is accompanied by mitral valve involvement.
A
Figure 3.4 Electron beam tomographic and cardiac magnetic resonance images of
stenotic aortic valves. (A) Short axis electron beam view at the level of the aortic valve
showing severe valve calcification. (E-speed Electron Beam Angiography, General
Electric, San Francisco, CA; Image courtesy of Matt Budoff, MD.) (B) Cardiac magnetic
resonance imaging showing a cross-sectional view of a moderately stenotic aortic valve;
the gray line denotes the aortic valve area (AVA). (With permission from John et al.
2003
3
.)
BCI3 6/18/05 11:12 AM Page 29
velocity being a strong predictor of clinical outcome (Fig. 3.5). Aortic jet veloci-
ties (v) are converted to pressure gradients (DP), using the simplified Bernoulli
equation as:
DP = 4v
2
using the maximum jet velocity to calculate the maximum gradient and
averaging the instantaneous pressures gradients during systole for mean
gradient. Note that the maximum Doppler velocity corresponds to maximum
instantaneous gradient across the aortic valve, which should not be confused
with the peak-to-peak gradient measured by cardiac catheterization, a
non-physiologic measure, because these peaks do not occur simultaneously
(Fig. 3.6).
Aortic jet velocity is measured with continuous wave Doppler, taking care to
use optimal patient positioning, several acoustic windows, and careful trans-
ducer angulation to obtain a clear signal with a parallel intercept angle between
the ultrasound beam and aortic jet. Because the Doppler equation includes a
30 Chapter 3
Figure 3.5 Doppler echocardiography of a stenotic aortic valve. The outflow tract
velocity (A) is recorded from an apical view using a pulsed wave Doppler sample
volume positioned just on the left ventricular side of the aortic valve (at the same site at
the diameter measurement as shown in Fig. 3.1). Continuous wave Doppler (B and C
)
is used to determine the maximum aortic velocity. Lack of alignment between the
ultrasound beam and direction of flow can lead to underestimation of the velocity. Note
that the maximum velocity from an apical approach (B) is only 4.1 m/s corresponding
to a maximum gradient of 67 mmHg, whereas the maximum velocity from a high right
parasternal position (C) is 4.9 m/s, corresponding to a maximum pressures gradient of
95 mmHg. The higher velocity represents a more parallel alignment. Also notice that
the maximum velocity is measured as the edge of the more intense envelope of flow,
avoiding the faint signals resulting from the transit time effect.
BCI3 6/18/05 11:12 AM Page 30
term for the cosine of the intercept angle, any deviation from a parallel intercept
angle results in underestimation of jet velocity (Fig. 3.4). In general, an inter-
cept angle less than 20° is acceptable (error less than 6%). Underestimation of
jet velocity because of poor signal strength or a non-parallel intercept angle is
the most common pitfall in assessment of stenosis severity; avoidance of this
source of error depends on experienced examiners and correct interpretation of
the flow signals.
Overestimation of the jet velocity or pressure gradient occurs less often.
Causes of an inaccurate velocity signal include measuring the faint signals at the
edge of the velocity curve as a result of the transit time effect or misidentification
of the mitral regurgitant jet signal. Pressure gradient is overestimated if there
is an elevated velocity proximal to the stenosis; in this situation, proximal
velocity is included in the Bernoulli equation as:
DP = 4 (v
jet
2
- v
prox
2
)
The phenomenon of pressure recovery may be an issue in comparing Doppler
with invasive pressure gradient data for prosthetic valves (see Chapter 6) but
is less of a problem with native valve stenosis; the magnitude of this effect is
only a few mmHg and is most pronounced with a large valve area and small
ascending aorta.
Aortic stenosis 31
Normal
150
100
100
50
50
0
0
Aortic stenosis
LV
LV
Ao
Ao
LV presssure
Aortic pressure
Pressure (mmHg)
(a) (b)
Figure 3.6 Relationship of aortic and left ventricular pressures for (a) normal and (b)
stenotic aortic valve. The rate of rise aortic pressure in patients with aortic stenotic
is notably decreased, corresponding to a slow carotid upstroke. The maximum
instantaneous gradient (*) corresponds to the maximum Doppler gradient and typically
is greater that the peak left ventricular to peak aortic (“peak-to-peak”) gradient (+)
measured with cardiac catheterization.
BCI3 6/18/05 11:12 AM Page 31
Aortic valve area
A limitation of velocity and pressure gradient data is that a relatively low veloc-
ity, and pressure gradient, may be present if transaortic volume flow rate is
decreased, for example with associated left ventricular systolic dysfunction, mi-
tral regurgitation or a small, hypertrophied ventricle. In these situations, aortic
valve area (AVA) is calculated from Doppler data using the continuity equation
based on the concept that the stroke volume across the narrowed aortic valve
orifice is equal to the stroke volume proximal to the valve (Fig. 3.7)
SV
AVA
= SV
LVOT
because stroke volume is the product of the cross-sectional area (CSA) and
velocity time integral (VTI) of flow (e.g. the temporal and spatial mean flow
velocity):
AVA ¥ VTI
AS-Jet
= CSA
LVOT
¥ VTI
LVOT
Solving for aortic valve area (Fig. 3.7):
AVA = (CSA
LVOT
¥ VTI
LVOT
)/VTI
AS-Jet
In clinical practice, maximum velocities may be substituted for velocity time
integrals as the ratio of both are similar, so that the simplified continuity
equation is:
AVA = (CSA
LVOT
¥ V
LVOT
)/V
AS-Jet
Thus, the measurements needed for calculation of valve area are:
1 LVOT diameter measured from a parasternal long axis view for calculation of
a circular cross-sectional area.
2 LVOT velocity measured with pulsed wave Doppler from an apical view (for a
parallel intercept angle) with the sample volume positioned immediately adja-
cent to the aortic valve closure plane (to ensure that diameter and flow are
measured at the same place).
32 Chapter 3
CSA
LVOT
VTI
LVOT
VTI
As-Jet
Stenotic
valve
AVA
Figure 3.7 Schematic diagram of the continuity equation to calculate the aortic valve
area. AVA, aortic valve area; CSA, cross-sectional area; LVOT, left ventricular outflow
tract; VTI, velocity time integral.
BCI3 6/18/05 11:12 AM Page 32
3 Aortic jet velocity, taking care to obtain the highest velocity signal, indicating
a parallel intercept angle.
An accurate valve area calculation depends on attention to technical details for
each of these measurements. Slight errors in LVOT diameter measurement
translate into larger errors in valve area. However, LVOT diameter does not
change with changes in flow rate or over time in adults. In addition, the ratio of
LVOT to aortic velocity provides a simple measure of stenosis severity that is in-
dependent of body size.
Other approaches
In the past, cardiac catheterization was used to measure the pressure gradient
across the stenotic valve and, in conjunction with measurement of transaortic
volume flow rate, to calculate valve area using the Gorlin formula. However,
catheterization is expensive and entails some risk, because it requires either a
transeptal puncture for simultaneous left ventricular and aortic pressure meas-
urements, or retrograde passage of a catheter across the stenotic valve, which is
associated with cerebral embolization. Cardiac MRI has the potential to visual-
ize and measure blood flow and allows calculation of valve area, analogous to
the Doppler method. However, this approach is not yet established for routine
clinical care.
Chronic left heart pressure overload
Pressure overload of the left ventricle leads to concentric left ventricular hyper-
trophy. Women tend to develop a small, thick-walled chamber with diastolic
dysfunction but preserved systolic function. In contrast, men tend to have in-
creased left ventricle (LV) mass resulting from dilatation and are more likely to
have a decreased ejection fraction. Most patients with aortic stenosis have a
normal ejection fraction until very late in the disease course.
Echocardiography allows measurement of wall thickness and chamber di-
mensions, and calculation of 2D ejection fraction. LV mass can be determined by
echocardiography but is not routinely measured clinically.
5
Both 3D echocar-
diography and cardiac MRI allow more accurate determination of LV ejection
fraction and mass; however, these approaches are largely limited to research
applications.
Diastolic function is evaluated with standard Doppler techniques including
transmitral flow velocities, pulmonary vein flow patterns, and tissue Doppler
velocities to evaluate diastolic relaxation, compliance, and filling pressures.
6
In patients with long-standing aortic stenosis, pulmonary pressures may be-
come elevated. Pulmonary systolic pressure can be accurately assessed by
echocardiography. Measurement of pulmonary vascular resistance requires
right heart catheterization.
Associated dilatation of the ascending aorta
In patients with aortic valve disease, it is especially important to image the
aorta. Bicuspid aortic valve is associated with aortic dilatation in many patients,
probably as the result of a systemic connective tissue disorder.
7
Patients with
Aortic stenosis 33
BCI3 6/18/05 11:12 AM Page 33
trileaflet calcified valves also may have aortic involvement resulting from
atherosclerosis. The echocardiographic examination should include imaging
and measurement of the sinuses of Valsalva, sinotubular junction, and ascend-
ing aorta. If an abnormality is present, further evaluation with CT or MRI is
warranted. CT imaging is especially helpful as it allows 3D reconstruction of
the entire aorta (Fig. 3.8).
Dynamic changes in valve area
In patients with aortic stenosis and severe left ventricular systolic dysfunction,
it may be difficult to distinguish whether reduced valve leaflet opening is a re-
sult of severe valve stenosis or primary myocardial disease with only mild to
moderate stenosis. In these rare patients, evaluation of valve area at different
flow rate, with exercise or dobutamine infusion, may be helpful. If AVA
increases significantly, the principal problem is myocardial dysfunction, not
aortic stenosis. Patients in whom the ventricle fails to demonstrate contractile
reserve to stress have a particularly poor prognosis. However, stress evaluation
of aortic stenosis is technically difficult and should only be performed in experi-
enced laboratories.
Clinical relevance
Aortic stenosis severity is classified as:
• Mild: jet velocity <3 m/s, mean gradient <20 mmHg, valve area >1.5 cm
2
• Moderate: jet velocity 3–4 m/s, mean gradient 20–40 mmHg, valve area
1.0–1.5 cm
2
• Severe: jet velocity >4 m/s, mean gradient >40 mmHg, valve area <1.0 cm
2
Patients with symptomatic severe aortic stenosis should proceed to aortic valve
replacement because the prognosis with medical therapy is very poor.
34 Chapter 3
Figure 3.8 Three-dimensional
reconstruction of the aorta from
computed tomography (CT) imaging
in a patient with a bicuspid aortic valve
and dilated aorta.
BCI3 6/18/05 11:12 AM Page 34
Recently, attention has been focused on the natural history of asymptomatic
aortic stenosis using Doppler data to follow disease progression. Predictors of
symptom onset in initially asymptomatic patients include age over 50 years,
known coronary artery disease, and moderate or severe valve calcification.
8,9
There also is interest in the use of echocardiographic Doppler data and electron
beam CT quantitative assessment of valve calcification for assessing potential
therapeutic interventions.
10
Aortic stenosis 35
Case Presentation (Continued)
The patient was found to have a heavily calcified valve with concentric left
ventricular hypertrophy and an ejection fraction of 46%. Aortic jet velocity was
5.3 m/s, mean gradient 65 mmHg, and continuity equation valve area 0.8 cm
2
.
Because he had severe symptomatic aortic stenosis, valve replacement was
recommended. Preoperative coronary angiography was normal and he did well
postoperatively.
References
1Otto CM. Aortic stenosis. In: Otto CM, ed. Valvular Heart Disease, 2nd edn.
Saunders–Elsevier, Philadelphia, 2004: 197–246.
2 Otto CM. Valvular stenosis. In: Otto CM. The Textbook of Clinical Echocardiography, 3rd
edn. Elsevier–Saunders, Philadelphia, 2004: 277–314.
3 John AS, Dill T, Brandt RR, et al. Magnetic resonance to assess the aortic valve area in
aortic stenosis: how does it compare to current diagnostic standards? J Am Coll Cardiol
2003;42:519–26.
4 Morgan-Hughes GJ, Owens PE, Roobottom CA, Marshall, AJ. Three-dimensional
volume quantification of aortic valve calcification using multislice computed tomog-
raphy. Heart 2003;89:1191–4.
5 Aurigemma GP, Douglas PS, Gaasch WH. Quantitative evaluation of left ventricular
structure, wall stress and systolic function. In: Otto CM, ed. The Practice of Clinical
Echocardiogaphy, 2nd edn. W.B. Saunders, Philadelphia, 2002: 65–87.
6 Redfield MM, Jacobsen SJ, Burnett JC Jr, Mahoney DW, Bailey KR, Rodeheffer RJ.
Burden of systolic and diastolic ventricular dysfunction in the community: appreciat-
ing the scope of the heart failure epidemic. JAMA 2003;289:194–202.
7 Fedak PW, Verma S, David TE, Leask RL, Weisel RD, Butany J. Clinical and patho-
physiological implications of a bicuspid aortic valve. Circulation 2002;106:900–4.
8 Rosenhek R, Klaar U, Schemper M, Scholten C, et al. Mild and moderate aortic
stenosis: natural history and risk stratification by echocardiography. Eur Heart J
2004;25:199–205.
9 Rosenhek R, Binder T, Porenta G, et al. Predictors of outcome in severe, asymptomatic
aortic stenosis. N Engl J Med 2000;343:611–7.
10 Pohle K, Maffert R, Ropers D, et al. Progression of aortic valve calcification: associa-
tion with coronary atherosclerosis and cardiovascular risk factors. Circulation
2001;104:1927–32.
BCI3 6/18/05 11:12 AM Page 35
CHAPTER 4
Aortic regurgitation
Helmut Baumgartner and Gerald Maurer
36
Case Presentation
A 33-year-old man had a routine health check-up to get permission for
competitive sport. He was completely asymptomatic and had good exercise
capacity. On examination, his blood pressure was 160/60 mmHg and ausculation
revealed a 3/6 diastolic murmur at the left sternal edge. The electrocardiogram
(ECG) showed left ventricular hypertrophy and chest X-ray left ventricular
enlargement. The patient was referred to the cardiac outpatient department for
further evaluation.
Diagnosis and grading of severity
In general, aortic regurgitation (AR) is detected by physical examination or in-
cidentally by echocardiography. Clinical presentation includes a characteristic
decrescendo diastolic murmur and
—
as soon as moderate to severe
—
increased
systolic pressure, widened pulse pressure, and bounding pulses. Although
widened pulse pressure in the absence of other etiologies is a reliable indicator
of hemodynamically relevant AR, conversely the lack of this sign does not reli-
ably exclude severe AR, particularly during advanced adult life where other
disorders associated with abnormal systemic vascular distensibility may be
present. Symptoms usually develop slowly and comprise mostly shortness
breath and less commonly angina with exertion.
Diagnostic tools
The results of ECG (left ventricular [LV] hypertrophy with or without strain
pattern) and chest X-ray (LV enlargement, eccentric hypertrophy or dilatation
of the ascending aorta) are non-specific.
At present, echocardiography is the mainstay for diagnosing AR and
grading its severity. The sensitivity and specificity of color Doppler for detec-
tion of AR with demonstration of the regurgitant jet (Fig. 4.1) approach 100%.
Aortic root angiography or cardiac magnetic resonance imaging (CMRI)
may be required in rare instances when echocardiography is technically
impossible.
BCI4 6/18/05 11:13 AM Page 36
Grading aortic regurgitation severity
While echocardiography has a key role in grading AR severity, the issue of
quantification by this technique has not been sufficiently resolved. As there is
still no single measurement that can be used for reliable quantitative assess-
ment, an integrative approach incorporating the sum of information obtained
from two-dimensional echocardiography (2D echo), color Doppler, and con-
ventional continuous wave (CW) and pulsed wave (PW) Doppler must be
recommended.
1
Table 4.1 summarizes the most important parameters to be
considered and has been adapted from a consensus paper recently published in
the American
1
and European literature. Specific signs having a specificity of
more than 90%, supportive signs with more modest predictive accuracy, and
quantitative parameters for AR severity are listed. The consensus is that the
process of grading AR should be comprehensive, using a combination of these
features. When the evidence from the different parameters is congruent, it is
Aortic regurgitation 37
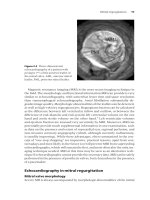
a)
c) d) e) f)
b)
LV
LV
LA
Ao
Ao
LA
Figure 4.1 Echocardiographic evaluation of aortic regurgitation (AR). (a) Narrow color
jet in mild AR (parasternal long axis view); (b) broad color jet and large convergence
zone in severe AR (parasternal long axis view); (c) continuous wave (CW) Doppler
tracing in mild AR (slow velocity decay); (d) CW Doppler tracing in severe AR (steep
velocity decay); (e) pulsed wave (PW) Doppler tracing from the decending aorta
(suprasternal approach) in mild AR (minimal diastolic flow reversal); (f) PW Doppler
tracing from the decending aorta (suprasternal approach) in severe AR (holodiastolic
flow reversal). Ao, aorta; LA, left atrium; LV, left ventricle.
BCI4 6/18/05 11:13 AM Page 37
easy to grade AR severity. However, when different parameters are contradic-
tory, one must look carefully for technical and physiologic explanations for
these discrepancies, and rely on the components showing the best quality
primary data and that are the most accurate in the context of the underlying
clinical condition.
2D echo signs
The clear demonstration of a flail cusp or of a wide coaptation defect is rather
rare. However, if present these signs are already highly specific for severe AR.
Moderate or greater enlargement of the left ventricle together with well-
preserved contractility reflects significant volume overload and is, in the
absence of other pathologies that cause LV volume overload (e.g. mitral regur-
gitation, ventricular septal defect), also a highly specific sign of severe AR. Like-
wise, moderate or greater enlargement of the LV without clear volume overload
in the absence of other etiologies explaining LV dilatation is a supportive sign of
severe AR but less specific.
38 Chapter 4
Table 4.1 Grading of aortic regurgitation.
Mild Moderate Severe
Specific signs for AR severity
Flail or wide coaptation defect
Vena contracta < 0.3 cm* Intermediate values Vena contracta > 0.6 cm*
Central jet width < 25% of LVOT* Intermediate values Central jet ≥ 65% of LVOT*
No or brief early diastolic flow Holodiastolic flow reversal in
reversal in Ao desc. Ao desc.
Supportive signs
PHT > 500 ms PHT < 200 ms
No/minimal flow convergence* Large flow convergence*
Moderate or greater LV
enlargement†
Quantitative parameters‡
R vol mL/beat < 30 30–44 45–59 ≥ 60
RF % < 30 30–39 40–49 ≥ 50
EROA cm
2
< 0.10 0.10–0.19 0.20–0.29 ≥ 0.30
AR, aortic regurgitation; Ao desc., aorta descending; EROA, effective regurgitant orifice area;
LV, left ventricle; LVF, left ventricular function; LVOT, left ventricular outflow tract; PHT,
pressure half-time; R vol, regurgitant volume; RF, regurgitant fraction.
* At a Nyquist limit of 50–60 cm/s.
† In the absence of other etiologies of LV dilatation.
‡ Quantitative parameters can help subclassify the moderate group into mild-to-moderate
and moderate-to-severe regurgitation as shown. However, numbers have to be viewed with
caution and only in the context of the other signs of severity because of the intrinsic limitations
of quantitative measurement techniques.
BCI4 6/18/05 11:13 AM Page 38
Doppler echocardiographic signs
Measurement of the narrowest width of the proximal jet (vena contracta) is
a simple valuable measurement for grading AR (Fig. 4.1).
2
Using a Nyquist
limit of 50–60 cm/s, a jet width less than 0.3 cm is highly specific for mild AR,
whereas a width of more than 0.6 cm is highly specific for severe AR.
1
A cut-off
of ≥0.5cm has high sensitivity but markedly less specificity. In highly eccentric
jets this simple measurement becomes unreliable. The ratio of jet width and left
ventricular outflow tract width has also been proposed with a cut-off of less
than 0.25 for mild and ≥0.65 for severe AR.
1
However, this measurement
has no apparent advantage over simple jet width measurement and is therefore
less commonly used.
PW Doppler recordings of the flow in the proximal descending aorta have
been found to yield additional important information.
1
No or only brief dias-
tolic flow reversal indicates mild AR, whereas holodiastolic flow reversal is
specific for severe AR (Fig. 4.1). Conversely, severe AR may be present in the
absence of holodiastolic flow reversal, particularly when the ascending aorta is
dilated.
CW Doppler can be used to record the flow velocity of the regurgitant jet.
The rate of deceleration and the derived pressure half-time reflect the rate
of equalization of aortic and LV diastolic pressure. With increasing severity of
AR, aortic diastolic pressure decreases more rapidly. The late diastolic jet
velocity is lower and pressure half-time shorter. Although this is rather con-
sidered to be a supportive sign and not highly specific, a pressure half-time of
more than 500 ms is usually consistent with mild AR, whereas values of
less than 200 ms (some would rather use less than 300 ms) is considered
compatible with severe AR (Fig. 4.1).
1
In particular, other etiologies of
higher end-diastolic LV pressure but also those of low diastolic pressure can
cause a steep velocity decay and yield false-positive results of severe AS. Con-
versely, a pressure half-time of more than 500 ms is much more specific for mild
AR.
Considerably less experience exists with the PISA (proximal isovelocity sur-
face area) method for the assessment of AR compared with mitral regurgitation.
The interposition of valve tissue when using the usual apical approach also lim-
its the application of this technique. Minimal or no flow convergence neverthe-
less indicates mild AR, whereas a larger flow convergence is consistent with
severe AR. Although rarely used, the PISA method has also been applied for
AR
3
and has been reported to yield regurgitant volume and when combined
with CW Doppler measurements of jet velocity effective regurgitant orifice area
(EROA). Thresholds of ≥60 mL and ≥0.30 cm
2
have been reported for severe AR.
Quantitation of flow with PW Doppler for the assessment of AR is
based on comparison of measurements of aortic stroke volume at the LVOT with
mitral or pulmonic stroke volume.
1
Total stroke volume can also be derived
from quantitative 2D measurements of LV end-diastolic and end-systolic vol-
umes. EROA can again be calculated from the regurgitant stroke volume and
the regurgitant jet velocity time integral by CW Doppler. As with the PISA
Aortic regurgitation 39
BCI4 6/18/05 11:13 AM Page 39
method, a regurgitant volume ≥60 mL and EROA ≥ 0.30cm
2
are consistent with
severe AR.
These two quantitative methods have also been proposed to subclassify the
moderate regurgitation group into mild-to-moderate and moderate-to-severe
regurgitation. However, both methods are controversial. There are a consider-
able number of sources of error resulting from intrinsic limitations. Instead of
adhering too much to calculated numbers for the grading of AR, many believe
that it is advisable to use the integrative approach with all the signs described
above to provide accurate judgment as a basis of clinical decision-making.
Alternative imaging tools
Although grading is possible by Doppler echocardiography in the vast majority
of patients, uncertainty may remain in some, particularly when ultrasound im-
aging quality is poor. In this case, cardiac catheterization is still commonly used.
However, invasive evaluation does also not provide true quantitation because it
mostly relies on aortic root angiography, which is graded semi-quantitatively, as
well as on hemodynamic measurements. In case of uncertainty of echocardio-
graphic grading, CMRI may be a useful next step. Although regurgitant volume
and regurgitant fraction can be calculated from stroke volume measurements
derived from LV and RV volume estimates, the currently preferred approach
involves quantification of forward and backward flow in the ascending aorta
(Fig. 4.2).
Additional information needed from imaging procedures
Mechanism of aortic regurgitation
Understanding the etiology and mechanisms leading to regurgitation is essen-
tial for proper management. Aortic valve repair, while performed infrequently
at this point, may be considered in suitable cases, such as bicuspid aortic valves
with leaflet prolapse.
Conversely, there may be severe AR with intact aortic leaflets in some cases of
aortic root dilation or of aortic dissection, where prolapse of the dissection
membrane prevents valve closure. In such instances, the valve may not require
replacement at the time of surgery for dissection. Obtaining information about
the mechanism of AR and its etiology is currently the domain of echocardiogra-
phy, particularly using the transeophageal approach (Table 4.2, Figs 4.3 and
4.4). Newer imaging tools such 3D echo (Fig. 4.4) and MRI may contribute to
the assessment of the complex spatial relationships of the aortic valve structures
and may ultimately improve the facility of aortic valve repair.
Ascending aorta
In all instances information about morphology and size of the ascending aorta
are needed. Aortic root and annular dilatation may cause AR even when leaflets
are normal. In presence of a bicuspid aortic valve, the aortic root is frequently
dilated, probably because of an abnormality of the wall, which may also explain
40 Chapter 4
BCI4 6/18/05 11:13 AM Page 40
Aortic regurgitation 41
a b
d
c
LV
LV
RVRV
RA
LA
LA
RA
Ao
Figure 4.2 Evaluation of AR by magnetic resonance imaging. (a) End-diastolic frame of
four-chamber view; (b) end-systolic frame of four-chamber view; (c) velocity image
acquired in a plane perpendicular to the proximal ascending aorta; (d) flow volume
curve in the ascending aorta indicating a large regurgitant volume and regurgitant
fraction. Ao, aorta; LA, left atrium; LV, left ventricle; PA, pulmonary artery; RA, right
atrium; RV, right ventricle.
Table 4.2 Etiology of aortic regurgitation (AR).
Primary valve disease
Congenital: Bicuspid aortic valve
Outlet supracristal ventricular septal
defect
Discrete subaortic stenosis
Rheumatic
Endocarditis*
Other inflammatory disorders
Degenerative
Traumatic leaflet rupture*
Secondary aortic regurgitation
Aortic root dilatation
Aortic dissection*
* Disorders leading to acute AR.
BCI4 6/18/05 11:13 AM Page 41