WINDOWS 2000 TROUBLE SHOOTING TCP/I P phần 4 doc
Bạn đang xem bản rút gọn của tài liệu. Xem và tải ngay bản đầy đủ của tài liệu tại đây (654.49 KB, 74 trang )
196 Chapter 5 • Using Network Monitoring and Troubleshooting Tools in Windows 2000
Log File Format
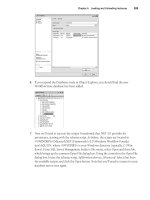
In the “Log file type:” drop-down list box, you can choose what format you
want the log file to be saved in. The main choices are binary format and
delimited text formats. If you save the logs in delimited text formats, you
can import the data into an Excel or Access database. Regardless of the
format you choose, you can still bring the information back to the System
Monitor Console for later analysis in the same way you were able to open
log files for later viewing using the Windows NT 4.0 Performance Monitor.
Alerts
To create an alert, you click the Alerts object in the left pane and then
right-click in the right pane and select New Alert Settings from the con-
text menu. Enter the name of the alert and click O
K. You will see what
appears in Figure 5.8.
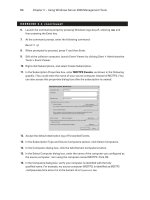
Figure 5.8 The General tab in the Alert dialog box.
You add counters for which you want to be alerted by clicking ADD;
in this example, we have selected the Pages/sec counter in the Memory
object. After selecting the counter, you need to set parameters that will
trigger the alert. In this case, we want to be alerted if the number of
pages/sec exceeds 20 per second. The sample interval is every 5 sec-
onds by default. Click the Action tab and you will see what appears in
Figure 5.9.
91_tcpip_05.qx 2/25/00 12:49 PM Page 196
Using Network Monitoring and Troubleshooting Tools in Windows 2000 • Chapter 5 197
You set what actions should take place after an alert is triggered. In
this case, we have configured the alert to be sent to the Application log
and a network message to be sent to the administrator’s workstation.
This is a NetBIOS name, and NetBIOS must be enabled on both the
machine generating the alert and the machine receiving an alert as a net-
work message in order for this to work. This is something to keep in mind
when you feel that your network has reached a point where you can com-
pletely disable NetBIOS. If you do reach that point, you must reenable
NetBIOS on the source and destination machines, at least temporarily, in
order for alerts to be sent via network messages.
You also have the choice of starting a log that you have already created
after an alert condition has been met. We might want to create a log that
tracks other memory-related parameters if the number of pages/sec exceeds
20. In that case, we would choose to “Start performance data log” and select
the name of the log from the drop-down list. You could also choose to start a
program after the alert condition parameters have been met.
Click the Schedule tab and you will see what appears in Figure 5.10.
Here you can schedule when you want to the system to look for alert
conditions. In this instance, we have selected the date and time when the
system should start looking for the alert condition, and set that the sys-
tem should stop looking after one day. You can see from the dialog box
the other options you have when scheduling alerts.
Figure 5.9 The Action tab in the Alert dialog box.
91_tcpip_05.qx 2/25/00 12:49 PM Page 197
198 Chapter 5 • Using Network Monitoring and Troubleshooting Tools in Windows 2000
Network Monitor
The Microsoft Network Monitor is a software protocol analyzer that allows
you to capture and analyze traffic on your network. The version of
Network Monitor that comes with the Windows 2000 server family is lim-
ited in its scope because it does not allow you to place the network
adapter in what is known as “promiscuous mode.” When an adapter is
placed in promiscuous mode, it is able to listen to all the traffic on the
segment, even if that traffic is not destined for the machine running the
Network Monitor software. However, one of the disadvantages of this state
of affairs is that promiscuous mode capturing can potentially overtax
your computer’s processor.
Even with these limitations, the Network Monitor is a very useful tool
for assessing the activity on the network. You can use the tool to collect
network data and analyze it on the spot, or save your recording activities
for a later time. Network Monitor allows you to monitor network activity
and set triggers for when certain events or data cross the wire. This could
be useful, for instance, if you are looking for certain “key words” in e-mail
communications moving through the network (we’ll look at an example of
how to do this later in this section).
Figure 5.10 The Schedule tab in the Alert dialog box.
91_tcpip_05.qx 2/25/00 12:49 PM Page 198
Using Network Monitoring and Troubleshooting Tools in Windows 2000 • Chapter 5 199
A more full-featured version of Network Monitor that allows for
promiscuous mode is included with Microsoft System Management Server
(SMS).
Filtering
The Network Monitor program allows you to capture only those frames
that you are interested in, based on protocol or source or destination
computer. You can apply even more detailed and exacting filters to data
that you have finished collecting, which allows you to pinpoint the precise
elements you might be looking for in the captured data. We’ll discuss how
to filter what data you want to capture, and how to fine-tune the cap-
tured data after you’ve collected it.
Security Issues
The Network Monitor program is a network sniffer. Any person with
administrative privileges can install it on a Windows 2000 server family
computer and start “listening” to activity on the wire. If you feel this is a
cause for concern, you are correct. This easy availability of such a power-
ful tool should lead to even further consideration of the security implica-
tions when you give someone administrative rights. Fortunately, the
Network Monitor is able to detect when someone else on the segment is
using Network Monitor, and provide you with his or her location.
However, don’t stake your career on this working correctly, because we
have had very rare success at it actually identifying all computers run-
ning Network Monitor on the same segment.
Installation
Network Monitor is not installed by default. If it isn’t installed on your
computer, you can install it via the Add/Remove Programs applet in the
Control Panel.
Using the Program
After you have installed the program, go to the Administrative Tools menu
and click Network Monitor; you will see what appears in Figure 5.11.
This Capture Window is the starting point on your adventure of net-
work monitoring. Note that there are four panes to this window.
NOTE
91_tcpip_05.qx 2/25/00 12:49 PM Page 199
200 Chapter 5 • Using Network Monitoring and Troubleshooting Tools in Windows 2000
Capture Window Panes
The top left pane is in the “gas gauge” type format, which provides infor-
mation on percent network utilization, broadcasts per second, and other
parameters in real time.
Just under that is a pane that provides information about individual
sessions as they are established, showing who established a session with
whom, and how much data was transferred between the two.
The right pane is the local machine’s session statistics pane, and pro-
vides detailed summary (is that an oxymoron?) information about the cur-
rent capturing session.
The bottom pane provides information about each detected host on
the segment, and statistics gathered on the host’s behavior.
Extra Tools
Before we get into the details of a capture, let’s look at some of the extra
tools available with Network Monitor.
Figure 5.11 The Network Monitor Capture Window.
91_tcpip_05.qx 2/25/00 12:49 PM Page 200
Using Network Monitoring and Troubleshooting Tools in Windows 2000 • Chapter 5 201
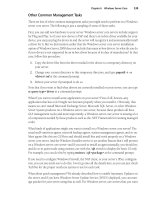
First, select the Tools menu, and then click Identify Network Monitor
Users. You will see the Identify Network Monitor Users dialog box as it
appears in Figure 5.12.
Figure 5.12 The Identify Network Monitor Users dialog box.
This dialog box provides you with the username and NetBIOS name of the
machine or machines currently running Network Monitor.
As mentioned earlier, you might not always get accurate readings right
away when running this utility. The Microsoft documentation regarding
how it finds other Network Monitor users is not clear on how the identifi-
cation process takes place. Machines running either the Network Monitor
Application or Agent are supposed to register NetBIOS names with the
service identifier of [BFh] and [BEh], respectively, but if you look at the
following, you will be led to think otherwise:
Local Area Connection:
Node IpAddress: [192.168.1.186] Scope Id: []
NetBIOS Local Name Table
Name Type Status
- - - - - - - - - - - -
EXETER <00> UNIQUE Registered
NOTE
91_tcpip_05.qx 2/25/00 12:49 PM Page 201
202 Chapter 5 • Using Network Monitoring and Troubleshooting Tools in Windows 2000
TACTEAM <00> GROUP Registered
EXETER <03> UNIQUE Registered
EXETER <20> UNIQUE Registered
TACTEAM <1E> GROUP Registered
INet~Services <1C> GROUP Registered
IS~EXETER <00> UNIQUE Registered
ADMINISTRATOR <03> UNIQUE Registered
Local Area Connection:
Node IpAddress: [192.168.1.3] Scope Id: []
NetBIOS Local Name Table
Name Type Status
- - - - - - - - - - - -
DAEDALUS <00> UNIQUE Registered
TACTEAM <00> GROUP Registered
DAEDALUS <03> UNIQUE Registered
DAEDALUS <20> UNIQUE Registered
TACTEAM <1E> GROUP Registered
TSHINDER <03> UNIQUE Registered
INet~Services <1C> GROUP Registered
IS~DAEDALUS <00> UNIQUE Registered
DAEDALUS <01> UNIQUE Registered
These are the printouts of the nbtstat –n commands run on two of the
Windows 2000 computers identified by Network Monitor as running
Network Monitor. Neither of them has registered NetBIOS names indicat-
ing that they are running either the Network Monitor Agent or
Application. The WINS database on this network also contains no entries
to this effect.
The moral of this story? Take advantage of this application, but take a
couple of precautions: 1) Let it run for an hour or so before concluding
that no other Network Monitor users are on the network, and 2) Don’t bet
your job on it!
Buffers
Now click the Capture command and click Buffer Settings. You’ll see what
appears in Figure 5.13.
The buffer size, in megabytes, determines the amount of data you can
capture in a single recording session.
91_tcpip_05.qx 2/25/00 12:49 PM Page 202
Using Network Monitoring and Troubleshooting Tools in Windows 2000 • Chapter 5 203
The default value is 1MB, but you can choose up to 1024MB (1GB).
However, since this data is stored in memory during the recording phase,
your practical limit is the amount of available RAM.
Even if you are running Network Monitor on a machine with a giga-
byte of RAM, you still need to be careful because it needs to write this
information to disk. You need the equivalent amount of free disk space as
well. You can also choose how much of each frame you want to capture.
Typically, you’ll choose Full to maximize your ability to find the things
you’re looking for.
Select the Options menu, and then click the Change Temporary
Capture Directory command. You’ll see a scary message like the one in
Figure 5.14.
Figure 5.13 The Capture Buffer Settings dialog box.
TIP
Figure 5.14 A scary message about changing the Temporary Capture Directory.
The whole program is for advanced users only! We’re still trying to figure
out what the danger is that they want to communicate regarding changing the
91_tcpip_05.qx 2/25/00 12:49 PM Page 203
204 Chapter 5 • Using Network Monitoring and Troubleshooting Tools in Windows 2000
location of the temporary folder, which is the temporary folder location
defined in the system environment variable.
Click O
K and you can then choose another folder to contain the tem-
porary capture files. You might want to do this if you’ve chosen a buffer
size that is larger than the amount of disk space you have available on
the partition that contains your temp directory.
Collecting Data
Now that we’re finished with the preliminaries, let’s get to the job of col-
lecting some data. The first thing you should try out is to start a capture
without filters, just to get a feel for how the capture process works.
There are a couple of ways to get the capture started: You can select the
Capture menu, and then click Start, or you can click the little right-pointing
arrow in the toolbar. Either one will begin the capture. When it is running,
you’ll see the gas gauges moving, and the statistics being collected on the
recording session.
After letting the capture run for a little bit, or after the % Buffer Used
value is 100, click the button that has the eyeglasses next to a square
(the stop and view button). This stops the capturing process and allows
you to see the frames that have been captured. You’ll see the Capture
Summary window as seen in Figure 5.15.
This window provides a list of all the frames that were captured dur-
ing the session. If you scroll to the bottom of the list, you’ll note that
there is a summary frame that contains statistics about the current cap-
ture. Take note of the column headers, which all should be self-explana-
tory.
Notice something unusual about the data in Figure 5.15? How about
the information that appears in the “Src MAC Addr” and “Dst MAC Addr”
fields? Those don’t look like MAC addresses to me.
If you did notice this seeming anomaly, congratulations! MAC address-
es aren’t much fun to look at, so we took advantage of another utility that
translates the MAC addresses to Machine Names. Select the Display
menu, and then click the Find All Names command. It will search for
names and then inform you of its results, and transform the fields con-
taining MAC addresses to NetBIOS names if it can find this information.
Now, double-click one of the frames, and you will see the display
transform into a tripane view as seen in Figure 5.16.
NOTE
91_tcpip_05.qx 2/25/00 12:49 PM Page 204
Using Network Monitoring and Troubleshooting Tools in Windows 2000 • Chapter 5 205
The top pane is just like the one you just saw. The middle pane con-
tains translated information from the captured frame that provides details
of the frame headers and protocol information. The bottom pane shows
the raw Hex and translations of the collected frame data. At the very bot-
tom of the windows, in the status bar area, there is a description of the
frame selected in the top pane (which in this case is Ethernet/802.3 MAC
Layer), the frame number out of the total number of frames, and an “off-
set” value for the selected character in the bottom pane.
In the preceding example, we selected frame number 244, which is an
ARP broadcast frame. Notice in the middle pane some of the details. It
indicates the hardware type and speed, and the source and destination IP
and hardware address. Note that the destination hardware address is the
Ethernet broadcast address [FFFFFFFFFFFF] because the whole purpose
of the ARP broadcast is to resolve the IP address to a hardware address.
The capture was taken from EXETER. The ARP broadcast was issued
by CONSTELLATION for DAEDALUS, which is the machine with the IP
address of 192.168.1.3. Do you think we would find the ARP reply later in
the capture? The answer is no. That is because the reply will not be sent
Figure 5.15 The Capture Summary window.
91_tcpip_05.qx 2/25/00 12:49 PM Page 205
206 Chapter 5 • Using Network Monitoring and Troubleshooting Tools in Windows 2000
to the hardware broadcast address, but to CONSTELLATION’s hardware
address; therefore, the Network Monitor on EXETER will not be able to
capture that conversation. The only reason we were able to see the ARP
Request is because it was directed to the hardware broadcast address,
which means that every machine on the segment had to evaluate the
request to see if it was for them.
The bottom pane in this instance isn’t very exciting. It shows the Hex
data on the left and an ASCII translation on the right. However, it can get
interesting, as shown in Figure 5.17.
Looking at the ASCII translation in this case, we see that we have a
problem user on the network, perhaps an overly enthusiastic Linux fan.
We are able to actively search for text strings in captured data in order to
find out about the existence of just this kind of communication. In this
case, the offensive text string was found embedded in an SMB packet
transmitting a Microsoft Mail message from the e-mail server to the desti-
nation computer. Other frames in the capture indicate the source of the
message.
Figure 5.16 Tripane view in the Capture Summary window.
91_tcpip_05.qx 2/25/00 12:49 PM Page 206
Using Network Monitoring and Troubleshooting Tools in Windows 2000 • Chapter 5 207
Filtered Captures
The capture we did earlier was an unfiltered capture. The advantage of
doing an unfiltered capture is that you can gather data on every commu-
nication into and out of the computer doing the capture, so you can be
sure that you’re not missing anything. However, you could end up collect-
ing a whole lot of information that you don’t need, and the extra informa-
tion only serves to obscure the data that you’re actually looking for.
Perhaps you’re only interested in the information exchange taking place
between your computer and one other computer, or two other computers.
You can limit the frames that are captured by creating a capture filter.
A capture filter is one of the two types of filters you’ll be working with, the
other being the display filter, which we’ll explore in a little bit.
Figure 5.17 Capture file with revealing ASCII data.
NOTE
91_tcpip_05.qx 2/25/00 12:49 PM Page 207
208 Chapter 5 • Using Network Monitoring and Troubleshooting Tools in Windows 2000
The purpose of the capture filter is to limit the frames that are actual-
ly saved in the capture buffer. This allows you to make better use of your
buffer space, because the limited amount of buffer you have can be
devoted to looking at the precise targets of interest. It also reduces the
amount of “extraneous” information that could cause you to overlook
something important during your investigations.
To create a capture filter, select the Capture menu, and click Filter.
First you’ll see a warning that tells you that for “security” reasons, you
can only capture traffic moving to and from the machine running Network
Monitor. Click O
K to move away from that dialog box, and you’ll see what
appears in Figure 5.18.
Figure 5.18 The Capture Filter dialog box.
There are two ways you can filter the capture information:
■
By machine address pairs
■
By a specified pattern in the frames that is examined during the
capture sequence
Filtering by Address Pairs
Let’s first see how we filter via address pairs. We can define up to four
address pairs to filter. For example, suppose there are 30 computers on
the segment that’s running Network Monitor, and we don’t want to cap-
ture information destined to and coming from all 30 of those machines,
just four of them. We can do that.
91_tcpip_05.qx 2/25/00 12:49 PM Page 208
Using Network Monitoring and Troubleshooting Tools in Windows 2000 • Chapter 5 209
To start adding address pairs, double-click the [AND] (Address Pairs)
statement. You should see what appears in Figure 5.19.
Take a close look at the elements of this dialog box. Near the top are
two option buttons for Include and Exclude. Any address pair that you
select for Include will be included in the capture. Any address pair that
you set for Exclude will be excluded from the capture. For example, if you
choose to include *Any (which indicates all frames coming to and leaving
this computer), you could choose to exclude a pair of computers so that
you can ignore messages being sent to and arriving from that machine.
Figure 5.19 The Address Expression dialog box.
Under the Include and Exclude options are three panes: Station 1,
Direction, and Station 2. Station 1 and Station 2 will define the comput-
ers named in the address pairs that will be included or excluded from the
filter, with Station 1 always being the machine running the Network
Monitor application. The Direction arrows allow you to filter based on the
direction of the traffic. The
"#
symbol represents traffic leaving Station
1 to Station 2 and arriving from Station 2 to Station 1, the
#
represents
traffic leaving Station 1 to Station 2, and the
"
represents traffic arriving
from Station 2 to Station 1.
If we were using the full version of Network Monitor that comes with
Microsoft Systems Management Server, Station 1 could be any computer on
the network and not just the local machine.
NOTE
91_tcpip_05.qx 2/25/00 12:49 PM Page 209
210 Chapter 5 • Using Network Monitoring and Troubleshooting Tools in Windows 2000
The chance is good that the machine you want to designate as Station
2 is not included on the list. To add the machine of interest to the list,
click E
DIT ADDRESSES. You will see what appears in Figure 5.20.
Figure 5.20 The Addresses Database dialog box.
This shows the Addresses Database in its current state on the
machine running the Network Monitor. The first column gives the
machine’s NetBIOS name, the second column the machine’s addresses,
the third column denotes the type of address included in the second col-
umn, and the fourth column includes a comment about the entry in the
database.
What we want to do is add an entry, so therefore we need to click A
DD.
You will see what appears in Figure 5.21.
Figure 5.21 The Add Address Information dialog box.
91_tcpip_05.qx 2/25/00 12:49 PM Page 210
Using Network Monitoring and Troubleshooting Tools in Windows 2000 • Chapter 5 211
In the Add Address Information dialog box you enter the name of the
machine, whether this is a permanent name for the machine, the
address, the type of address you are entering, and an optional comment.
A hint here is that before you enter the address, you must choose what
type of address you wish to enter. The dialog box defaults to a MAC
address, and if you try to enter an IP address when it says “ETHERNET” in
the type box, it won’t work.
Click O
K and the address is entered into the database.
These addresses will only stay in the database for the time that you
have Network Monitor open. If you find that you’ve created a lot of
addresses for machines on your network, you certainly don’t want to have
to do that again. To prevent such a waste of time, you can save these
addresses. To do so, click S
AVE, choose a location and a name for the file,
and these addresses will be saved so that you can load them on a subse-
quent monitoring session.
Click C
LOSE, which returns you to the Address Expression dialog box
that you were at previously. I’m going to select EXETER for Station 1, CON-
STELLATION for Station 2, and choose the double arrow for the direction of
traffic. After doing so, the screen looks like it does in Figure 5.22.
TIP
Figure 5.22 The completed Capture Filter.
91_tcpip_05.qx 2/25/00 12:49 PM Page 211
212 Chapter 5 • Using Network Monitoring and Troubleshooting Tools in Windows 2000
With this capture filter in place, only traffic between EXETER and
CONSTELLATION will be retained in the capture filter, and all other pack-
ets will be rejected. This implies that all packets continue to be examined
by the application, and that is true.
The filtering process can be processor-intensive, especially if you have set
up complex filters. Keep this in mind before running an extended capture
session on a machine that is already heavily taxed.
Now we’re ready to start the capture session. Click O
K in the Capture
Filter dialog box to remove it from sight. To start the capture, we’ll click
the right-pointing arrow in the toolbar.
After letting the capture run for a very short period of time, you can
click the “stop and view” button on the toolbar. The collected data appear
in Figure 5.23.
TIP
Figure 5.23 The results of a filtered data collection.
91_tcpip_05.qx 2/25/00 12:49 PM Page 212
Using Network Monitoring and Troubleshooting Tools in Windows 2000 • Chapter 5 213
Display Filters
Now that we have some captured data, we’ll look at a second type of filter,
known as a display filter. The display filter allows us to look for very spe-
cific elements of the captured data, and allows for a much more refined
filtering than we can accomplish with the capture filter.
A display filter can be used as a database search tool, where the captured
frames are the data in our database.
Imagine that we had captured this data because we wanted to see
what types of messages were being passed around the network regarding
Windows 2000. First, we’d have to decide what kind of messages we want
to look for. In this case, let’s assume that we want to see if users have
been using the net send command to exchange ideas or opinions regard-
ing Windows 2000.
To get started, select the Display menu, and click Filter. You should
see what appears in Figure 5.24.
NOTE
Figure 5.24 The Display Filter dialog box.
What we want to do is filter out everything except the protocol of inter-
est, and then identify a key phrase contained within the protocol of
91_tcpip_05.qx 2/25/00 12:49 PM Page 213
214 Chapter 5 • Using Network Monitoring and Troubleshooting Tools in Windows 2000
interest. Since we’re looking at net send messages being sent between the
users, we know that they use the SMB protocol. That’s where we’ll start.
Double-click the line that says “Protocol==Any”. You will see the
Expression dialog box as it appears in Figure 5.25.
Figure 5.25 The Expression dialog box.
Notice that the Protocol tab is where we are located. By default, all
protocols are enabled, which means that the filter is letting frames from
all protocols appear. Our goal is to allow only frames from the SMB proto-
col to appear, so we can sift through just those frames to find what our
users are saying about Windows 2000.
The first step is to disable all the protocols by clicking D
ISABLE ALL.
After clicking D
ISABLE ALL
, all the protocols are moved to the right side,
into the Disabled Protocols section. Now, scroll through the list of dis-
abled protocols and find the SMB protocol. Click on the SMB protocol and
then click E
NABLE. Your screen should appear as it does in Figure 5.26.
When the display filter is enabled, we will see only the SMB frames.
However, we don’t want to see all the SMB frames, we just want to see
those that have the term “Windows 2000” in them. In order to drill down
to just those frames, click the Property tab.
After clicking the Property tab, scroll down the list of protocols until
you find the SMB protocol. Double-click the protocol to see all the SMB
frame properties. Then scroll down the list of SMB frame properties until
you find the Data property. You should see what appears in Figure 5.27.
91_tcpip_05.qx 2/25/00 12:49 PM Page 214
Using Network Monitoring and Troubleshooting Tools in Windows 2000 • Chapter 5 215
In Figure 5.27, we have selected the “contains” option in the Relation
text box, and then entered the value “Windows 2000.” This will filter out
any SMB frames that do not contain the text string “Windows 2000.” Note
toward the bottom of this dialog box there are two option buttons, Hex
and ASCII, and that ASCII is selected.
Figure 5.26 The SMB protocol is now the only enabled protocol.
Figure 5.27 The SMB protocol Properties dialog box.
Click OK, then click OK again, and we see a single frame that contains a
reference to Windows 2000, as it appears in Figure 5.28.
91_tcpip_05.qx 2/25/00 12:49 PM Page 215
216 Chapter 5 • Using Network Monitoring and Troubleshooting Tools in Windows 2000
Apparently, our rollout of Windows 2000 on the network is being well
received!
Event Viewer
The Event Viewer can be used to check on the status of a number of net-
work services. Windows 2000 systems are configured to report significant
fault situations to the Event Viewer. You should make it a regular prac-
tice, perhaps the first thing you do every day, to check out the Event
Viewer on all of your primary servers to see if any of the Windows 2000
services running on these servers are reporting error conditions (see
Figure 5.29).
Normal status events are reported with a blue “i”; hence the phrase,
“may your Event Viewer always show blue.”
Red and white “Xs” indicate an error condition serious enough to war-
rant investigation. In this example, we can see that two important net-
work services, the DHCPServer and WINS, are both reporting error
conditions.
Figure 5.28 The result of the display filter.
91_tcpip_05.qx 2/25/00 12:49 PM Page 216
Using Network Monitoring and Troubleshooting Tools in Windows 2000 • Chapter 5 217
We are viewing the System Log in this case. Most of the networking
services will report fault conditions to the System Log; however, you should
investigate the Application Log as well.
To find out the nature of the problem, double-click one of the errors to
see the details of the problem (see Figure 5.30).
The Event Viewer reports that the Jet Database returned error num-
ber 1032. Now, how do we figure out what Event 1032 might be? The key
is the Windows 2000 Resource Kit.
Interpreting Error Messages
The Resource Kit contains a section called “Error and Event Messages
Help,” which provides a comprehensive list of error messages that you
might encounter in the Event Viewer. We can’t guarantee that all the
Figure 5.29 The Windows 2000 Event Viewer.
NOTE
91_tcpip_05.qx 2/25/00 12:49 PM Page 217
218 Chapter 5 • Using Network Monitoring and Troubleshooting Tools in Windows 2000
errors you encounter will be found here, but this one was. When we did a
search for this error, we came up with the following:
Event Message:
The DHCP service encountered the following error when backing up the registry
configuration: code
Event
Source Log Event ID Event Type
DhcpServer 1032
Explanation:
An internal error occurred in the Dynamic Host Configuration Protocol (DHCP)
service.
User Action:
Look up the indicated error in the event log in Event Viewer, and take
appropriate action. If this message appears often, you might want to restore
an earlier version of your DHCP database from backup, or reinstall DHCP.
In this case, we have to take a leap of faith, since it recommends that
we look in the Event Viewer, which is where we found the error in the
first place. However, it does sound like our DHCP database might be dam-
aged, and we are given a couple of options: either restore the DHCP
Server database from a backup, or reinstall the DHCP server service—not
very encouraging.
Figure 5.30 Details of a DHCPServer error.
91_tcpip_05.qx 2/25/00 12:49 PM Page 218
Using Network Monitoring and Troubleshooting Tools in Windows 2000 • Chapter 5 219
DNS Log
The Event Log does contain an added feature in addition to what was not
found in Windows NT: the DNS log. Because of the added importance of
DNS in the normal functioning of domain-related activity, Microsoft
deemed the DNS service important enough to warrant its own log in the
Event Viewer.
If you are experiencing any DNS-related problems, you should check
here first before getting into more involved DNS monitoring (such as DNS
trace logs).
Using TCP/IP Utilities
The group of command-line TCP/IP utilities included with Windows 2000
is similar to those available in Windows NT 4.0. We have the familiar set
of TCP/IP tools such as:
■
PING
■
NSLOOKUP
■
TRACERT
■
ARP
■
IPCONFIG
■
NBTSTAT
■
NETSTAT
These basic TCP/IP command-line tools have either the same or
enhanced functionality compared to what they could do in Windows NT
4.0.
In addition to these tools, Windows 2000 offers some new command-
line TCP/IP tools, including PATHPING and NETDIAG.
We will see what each of these tools can do, and then look at some
examples of how to apply their functionality to investigate a particular
problem.
PING
The PING (Packet INternet Groper) command uses ICMP echo messages to
communicate with destination computers. The PING command is used
most often to test basic TCP/IP connectivity. You can ping a computer by
IP address or by host name. The PING command has the following switch-
es:
-t Ping the specified host until stopped.
To see statistics and continue - type Control-Break
91_tcpip_05.qx 2/25/00 12:49 PM Page 219
220 Chapter 5 • Using Network Monitoring and Troubleshooting Tools in Windows 2000
To stop - type Control-C.
-a Resolve addresses to hostnames.
-n count Number of echo requests to send.
-l size Send buffer size.
-f Set Don’t Fragment flag in packet.
-i TTL Time To Live.
-v TOS Type Of Service.
-r count Record route for count hops.
-s count Timestamp for count hops.
-j host-list Loose source route along host-list.
-k host-list Strict source route along host-list.
-w timeout Timeout in milliseconds to wait for each reply.
-t Switch
The –t switch is useful when you want to continuously monitor a connec-
tion. For example, you want to restart a machine remotely, and then want
to know when the machine is up again so you can reestablish your
remote connection. Use the ping –t command and watch when the desti-
nation computer begins to respond, and then reestablish the connection.
-n Switch
If you don’t want to continuously ping a remote host, you can specify the
name of echo request messages sent to the destination by using the –n
switch. For example, if we want to ping constellation.tacteam.net 10
times, we would type at the command prompt:
ping constellation.tacteam.net –n 10
It would then ping 10 times and stop after the tenth attempt.
-r Switch
The –r command shows you the routes taken with each ping attempt. For
example, if we type:
ping shinder.net -n 3 -r 9
we get the following output:
Pinging shinder.net [204.215.60.153] with 32 bytes of data:
Reply from 204.215.60.153: bytes=32 time=100ms TTL=252
Route: 209.44.40.10 ->
209.44.40.69 ->
204.215.60.1 ->
204.215.60.153 ->
91_tcpip_05.qx 2/25/00 12:49 PM Page 220