Báo cáo y học: "Hybrid dynamic/static method for large-scale simulation of metabolism" pptx
Bạn đang xem bản rút gọn của tài liệu. Xem và tải ngay bản đầy đủ của tài liệu tại đây (1.04 MB, 11 trang )
BioMed Central
Page 1 of 11
(page number not for citation purposes)
Theoretical Biology and Medical
Modelling
Open Access
Research
Hybrid dynamic/static method for large-scale simulation of
metabolism
Katsuyuki Yugi
†
, Yoichi Nakayama*
†
, Ayako Kinoshita and Masaru Tomita
Address: Institute for Advanced Biosciences, Keio University, Fujisawa, Kanagawa, 252–8520, Japan.
Email: Katsuyuki Yugi - ; Yoichi Nakayama* - ; Ayako Kinoshita - ;
Masaru Tomita -
* Corresponding author †Equal contributors
Abstract
Background: Many computer studies have employed either dynamic simulation or metabolic flux
analysis (MFA) to predict the behaviour of biochemical pathways. Dynamic simulation determines
the time evolution of pathway properties in response to environmental changes, whereas MFA
provides only a snapshot of pathway properties within a particular set of environmental conditions.
However, owing to the large amount of kinetic data required for dynamic simulation, MFA, which
requires less information, has been used to manipulate large-scale pathways to determine
metabolic outcomes.
Results: Here we describe a simulation method based on cooperation between kinetics-based
dynamic models and MFA-based static models. This hybrid method enables quasi-dynamic
simulations of large-scale metabolic pathways, while drastically reducing the number of kinetics
assays needed for dynamic simulations. The dynamic behaviour of metabolic pathways predicted by
our method is almost identical to that determined by dynamic kinetic simulation.
Conclusion: The discrepancies between the dynamic and the hybrid models were sufficiently small
to prove that an MFA-based static module is capable of performing dynamic simulations as
accurately as kinetic models. Our hybrid method reduces the number of biochemical experiments
required for dynamic models of large-scale metabolic pathways by replacing suitable enzyme
reactions with a static module.
Background
Recent progress in high-throughput biotechnology [1-3]
has made advances in understanding of cell-wide molecu-
lar networks possible at the systems level [4,5]. To recon-
struct cellular systems using the high-throughput data that
are becoming available on their components, computer
simulations are being revisited as an integrative approach
to systems biology. Mathematical modelling of biochem-
ical networks has been attempted since the 1960s, and
before genome-scale pathway information became availa-
ble, they mostly employed numerical integration of ordi-
nary differential equations for reaction rates [6-10]. This
kind of dynamic simulation model provides the time evo-
lution of pathway properties such as metabolite concen-
tration and reaction rate. To create accurate simulations,
dynamic models require kinetic parameters and detailed
rate-laws such as the MWC model [11] and those derived
using the King-Altman method [12]. However, with few
exceptions such as human erythrocyte metabolism
[13,14], it is virtually impossible to collect a complete set
Published: 04 October 2005
Theoretical Biology and Medical Modelling 2005, 2:42 doi:10.1186/1742-4682-2-42
Received: 25 April 2005
Accepted: 04 October 2005
This article is available from: />© 2005 Yugi et al; licensee BioMed Central Ltd.
This is an Open Access article distributed under the terms of the Creative Commons Attribution License ( />),
which permits unrestricted use, distribution, and reproduction in any medium, provided the original work is properly cited.
Theoretical Biology and Medical Modelling 2005, 2:42 />Page 2 of 11
(page number not for citation purposes)
of kinetic properties for large-scale metabolic pathways.
Therefore, the applicability of the dynamic method has
been limited to relatively small pathways.
Another approach, such as metabolic flux analysis (MFA)
using stoichiometric matrices, has been employed for
large-scale analyses of metabolism [4,15,16]. Assuming a
steady-state condition, MFA provides a flux distribution as
the solution of the mass balance equation without the
need for rate equations and kinetic parameters [16,17].
Since it is a "static" approach, the ability of MFA to predict
the dynamic behaviour of metabolic pathways is limited.
It provides a snapshot of a certain pathway in a single
state, but is insufficient to predict the dynamic behaviour
of metabolism [18]. Recently, this approach was extended
to allow the prediction of dynamic behaviour. This exten-
sion, dynamic flux balance analysis (DFBA) [19], provides
optimal time evolution based on pre-defined constraints,
including kinetic rate equations. However, this extension
was not intended to reduce the masses of information
necessary for developing dynamic cell-scale simulation
models. In addition, this DFBA study did not define the
criteria for segmenting a whole metabolic pathway into
parts defined by kinetic rate equations and a stoichiomet-
ric model. Therefore this effort does not suffice as a
generic modelling approach.
Here we propose a method for dynamic kinetic simula-
tion of cell-wide metabolic pathways by applying the
kinetics-based dynamic method to parts of a metabolic
pathway and the MFA-based static method to the rest.
Because the static module does not require any kinetic
properties except the stoichiometric coefficients, this
method can drastically reduce the number of enzyme
kinetics assays needed to obtain the dynamic properties of
the pathway. We have evaluated the accuracy of the hybrid
method in comparison to a classical dynamic kinetic sim-
ulation using small virtual pathways and an erythrocyte
metabolism model.
Results
Evaluation of errors
The hybrid simulation method integrates the two types of
simulation method within one model: the static module
comprises enzymatic reactions without their kinetic prop-
erties and the dynamic module covers the rest of the path-
way, thereby enabling the static module to be calculated
in a quasi-dynamic fashion (Figure 1). At steady-state, a
hybrid model of a hypothetical pathway that included an
over-determined static module (Figure 2a) yielded an
almost identical solution to a dynamic model of the path-
way. The reaction rates were calculated by numerical inte-
gration of the rate equations. We employed the errors
between the dynamic and hybrid models in the first inte-
gration step as an index to estimate the accumulation of
errors in the subsequent integration steps (one-step error;
see Methods for a detailed definition). The one-step error
was 8.592 × 10
-16
of the maximum for the reaction rates.
All the metabolite concentrations in the hybrid model
were identical to those in the dynamic model (Table 1).
When the concentration of metabolite A was increased
two-fold, the hybrid and the dynamic models displayed
similar time evolutions (Figure 3a and 3b). The maximum
one-step errors after this perturbation were 4.000 × 10
-11
and 8.889 × 10
-6
for metabolite concentrations and
reaction rates, respectively (Table 1).
The hybrid model was also as accurate as the dynamic
model in the case of a simple pathway with an underde-
termined static module (Figure 2b). The maximum one-
step errors at steady state were 5.049 × 10
-12
for metabolite
concentrations and 2.837 × 10
-6
for reaction rates (Table
2). The time courses after a two-fold increase in the con-
centration of metabolite A were very similar between the
dynamic and the hybrid model (Figure 3c and 3d). The
maximum errors at the first integration step after the per-
turbation were 3.575 × 10
-7
for the metabolite concentra-
tions and 0.00120 for the reaction rates.
In contrast, the models did not agree as closely when (i)
the static module involved enzymes of which the
reactions were bottlenecks of dynamic behaviour, i.e.
were not sufficiently susceptible to the boundary reaction
Table 1: Errors between the dynamic model and the hybrid model of the pathway shown in Fig. 2a. The maximum errors were
measured within one numerical integration step. "Perturbation" denotes whether the errors were measured under a steady-state
condition (-) or after a two-fold increase of metabolite A (+)
Perturbation Maximum error (concentration) Maximum error (reaction rate)
Boundary - 0 0
+8.000 × 10
-11
(C) 0
Static part - 0 8.592 × 10
-16
(E_CD)
+4.000 × 10
-11
(D,E,F,G) 8.889 × 10
-6
(E_CD)
Theoretical Biology and Medical Modelling 2005, 2:42 />Page 3 of 11
(page number not for citation purposes)
rates, and (ii) a boundary reaction rate underwent a large
change in response to changes in substrate concentra-
tions. For example, the hybrid model of the hypothetical
pathway with an over-determined static module exhibited
approximately 10-fold higher one-step errors in the reac-
tion rates of the static module when the rate constants of
a boundary reaction E_BC were altered from k
f
= 0.01s
-1
,
k
r
= 0.001s
-1
to k
f
= 0.1s
-1
, k
r
= 0.091s
-1
.
Correlation between elasticity and errors
Relationships between kinetic properties and one-step
errors were examined in depth using a simple linear path-
way at a steady state (Figure 2c) and 2a glycolysis model
[13,20] (Figure 2d). Elasticity is a coefficient defined by
metabolic control analysis. It represents the sensitivity of
reaction rate to changes in substrate concentration (See
Eq. (4) in Methods). The one-step errors of all the reac-
tions in the static module (E_CD, E_DE, and E_EF) were
proportional to the elasticity of the boundary reaction
E_BC (Figure 4a). In addition, the errors of E_CD and
E_DE were negatively correlated with their own elasticities
(Figure 4b, c and 4d). It was also observed in the glycolysis
model that the one-step errors of reaction rates in static
modules are proportional to the elasticities of the bound-
ary reactions (Figure 4e). These results were in good agree-
ment with the implications derived from Eq. (2), that a
static module should be composed of reactions with large
elasticities and boundary reactions with small elasticities.
Application to erythrocyte metabolism
The same analysis was performed using an erythrocyte
metabolism model [14] to evaluate the applicability of
Table 2: Errors between the dynamic model and the hybrid model of the pathway shown in Fig. 2b. The maximum errors were
measured within one numerical integration step. "Perturbation" denotes whether the errors were measured under a steady-state
condition (-) or after a two-fold increase of metabolite A (+)
Perturbation Maximum error (concentration) Maximum error (reaction rate)
Boundary - 5.049 × 10
-12
(F) 5.609 × 10
-12
(E_FG)
+3.575 × 10
-7
(C) 1.323 × 10
-7
(E_FG)
Static part - 7.176 × 10
-15
(D) 2.837 × 10
-6
(E_CD, E_DF)
+1.192 × 10
-7
(D) 0.00120 (E_CD)
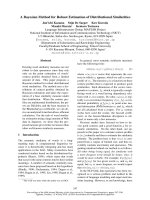
Summary of the hybrid methodFigure 1
Summary of the hybrid method. (i) In the dynamic module (V
1
, V
2
, V
9
, and V
10
), the rate equations provide the reaction
rates. (ii) In the static module, the reaction rate distribution (V
3
, V
4
, V
5
, V
6
, V
7
, and V
8
) is calculated from the matrix equation
at the right, which corresponds to v = S
#
b. S
#
denotes the Moore-Penrose pseudo-inverse of S. (iii) Numerical integration of
all the reaction rates (V
1
-V
10
) determines the concentrations of the metabolites (X
1
-X
13
). The metabolites X
5
, X
7
, and X
11
are
at the boundary.
Theoretical Biology and Medical Modelling 2005, 2:42 />Page 4 of 11
(page number not for citation purposes)
the hybrid method to more realistic and more complex
pathways. A group of enzymes surrounded by glucose-6-
phosphate dehydrogenase (G6PDH), transketolase I
(TK1), transketolase II (TK2) and ribulose-5-phosphate
isomerase (R5PI) was replaced with a static module (Fig-
ure 5) to verify the implications of Eq. (2), that a static
module should be composed of reactions with large elas-
ticities and boundary reactions with small elasticities.
These enzymes were selected because they exhibit rela-
tively small elasticity ratios (see Methods for definition)
compared to others in this pathway. The static module is
an over-determined system (eight metabolites and five
reactions).
The hybrid and dynamic erythrocyte models yielded sim-
ilar dynamics in response to a three-fold increase of FDP
concentration (Figure 3e and 3f). The errors between the
dynamic and hybrid models of the erythrocyte pathway
were quantified by the procedure used for the hypotheti-
cal pathways. In a steady-state condition without an
increase in FDP, the maximum error, 2.17 × 10
-4
, was
observed in the reaction rate of 6-phosphogluconate
dehydrogenase (6PGODH) (Table 3). (Note that this was
true only when the gluconolactone-6-phosphate (GL6P)
concentration was excluded. Owing to its small initial
concentration (7.572 nM), the error in GL6P was sensitive
to small changes and was associated with a large error of
0.00780.) The error in the 6PGODH rate remained the
maximum error when the FDP concentration was
perturbed.
When the boundary reaction was relocated from G6PDH,
which forms a bottleneck of dynamic response in a tran-
sient state and has low elasticity at steady state, to
phosphoglucoisomerase (PGI), which has a larger elastic-
ity, the time courses calculated by the hybrid model were
different from those produced by the dynamic model.
Discussion
In the simulation experiments using hypothetical path-
ways and an erythrocyte model, the discrepancies between
the dynamic and the hybrid models were sufficiently
small to prove that an MFA-based static module is capable
of performing dynamic simulations as accurately as a
kinetic model. The key idea behind our method is to dis-
tinguish between dependent and independent variables
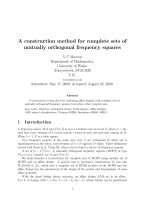
Hypothetical pathways for simulation experimentsFigure 2
Hypothetical pathways for simulation experiments. Simple pathway models employed to evaluate the accuracy of the
hybrid method in comparison with conventional kinetic simulation. The reactions in the boxes were replaced with a static
module in the hybrid models. (a) A pathway model with an over-determined static module. (b) A model including an underde-
termined static module. (c) A simple linear pathway model. (d) A pathway map of the glycolysis model [13, 20]. See Tables 4
and 5 in Additional file 1 for the abbreviations of the metabolites and the enzymes, respectively.
Theoretical Biology and Medical Modelling 2005, 2:42 />Page 5 of 11
(page number not for citation purposes)
(reactions). Although independent reactions can be
affected by other dependent/independent reactions
through effectors such as ADP in the phosphofructokinase
reaction, the time evolution of adjacent reaction rates are
mainly determined by independent reactions which con-
stitute bottlenecks of dynamic behaviour in the metabolic
network. Therefore, static modules should consist of only
such dependent reactions, whereas dynamic modules can
include both independent and dependent reactions. Our
hybrid method reduces the number of biochemical exper-
iments required for dynamic models of large-scale meta-
bolic pathways by replacing suitable enzyme reactions
with a static module. The optimal conditions for this
method are (a) a system with few bottleneck reactions in
order to enlarge the static modules, (b) small fluctuations
in the reaction rates in static modules, and (c) accurately
identifiable bottleneck reactions. How can such enzymes
be identified? One obvious criterion for the enzymes to be
suitably modelled by a static module is not to incorporate
a bottleneck reaction in a transient state. Thus, the
enzymes should not reach the maximum velocity quickly
or be restrained at lower activities by allosteric regulation.
Although the model comprising dynamic and static mod-
ules as a whole can represent transient states, it is assumed
that the reactions in the static modules achieve or nearly
achieve steady states within one numerical integration
step. The existence of one or more bottleneck reactions in
the static module may cause inconsistencies, because the
hybrid method solves algebraic equations for static mod-
ules under a steady state assumption, although metabo-
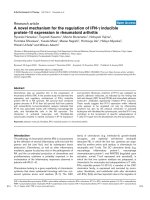
Comparisons of time courses produced by dynamic and hybrid modelsFigure 3
Comparisons of time courses produced by dynamic and hybrid models. The coloured lines and the broken black
lines represent the time courses calculated by dynamic and hybrid models, respectively. Refer to Fig. 2 for pathway nomencla-
ture. The hybrid model in Fig. 2a yielded similar time courses of change in the reaction rates and the metabolite concentrations
to the corresponding dynamic model. (a) The reaction rates of E_BC (yellow) and E_DF (blue). (b) The concentrations of com-
pounds D (yellow) and H (blue). The time courses of the pathway model in Fig. 2b were also in agreement with the dynamic
model. (c) The reaction rates of E_BC (yellow), E_CF (green), E_CE (red), and E_CD (blue). (d) The concentrations of com-
pounds E (yellow) and H (blue). The results of these models were also in good agreement for the erythrocyte model. (e) The
reaction rates of the hybrid model differed only slightly from those of the dynamic model. The lines in blue, purple, yellow,
green, and red denote the reaction rates of GSSGR, G6PDH, TK2, TA and R5PI, respectively. (f) The hybrid and dynamic mod-
els yielded almost identical time courses in the concentrations of metabolites such as X5P (yellow), GSSG (blue), and NADP
(red).
Theoretical Biology and Medical Modelling 2005, 2:42 />Page 6 of 11
(page number not for citation purposes)
lites will be accumulated or depleted in real cells.
Therefore, bottleneck reactions must be excluded from
static modules. Another situation that should be avoided
involves reaction rates in static modules that are affected
by changes in enzyme concentration, such as those caused
by changing levels of transcriptional/ post-transcriptional
control. Such reactions should be included in dynamic
modules.
A similar cause of inconsistency is the reversibility of reac-
tions. Since the hybrid method assumes that reactions in
the static module are reversible, inclusion of an irreversi-
ble step may cause inconsistencies, particularly in the
presence of a perturbation downstream of the irreversible
step (data not shown).
The accuracy of the calculation can also be affected by a
time lag. In the static module of the hybrid model, time
lags between the upstream and downstream reactions are
not represented because the boundary reactions affect all
subsequent reactions in the static module within one inte-
gration step regardless of the number of enzyme reactions.
Depending on the simulation time scale, the static mod-
ule should be limited to minimize the influence of time
lags. This influence can be estimated by the ratio of elas-
ticities, which can be an important criterion for including
a reaction in the static module.
The correlation between elasticity and one-step error (Fig-
ure 4) indicates that, to ensure the accuracy of the simula-
tion, the static module of a pathway should include
reactions with larger elasticities and should be surrounded
by boundary reactions with small elasticities. A large elas-
ticity indicates that the enzyme is capable of changing its
reaction rate rapidly in response to changes in substrate
concentrations [21]. The result shown in Figure 4
demonstrates that enzymes with large elasticity contribute
to the accuracy of the static module. On the other hand,
boundary reactions with small elasticities, large substrate
concentrations and/or small reaction rates change their
Correlation between elasticity and errorFigure 4
Correlation between elasticity and error. (a) The error between the hybrid model and the dynamic model was positively
correlated with the elasticity of the boundary reaction. (b,c,d) The elasticity of the reactions replaced by a static module was
negatively correlated with the error. (e) The correlation between error and elasticity was also observed in the glycolysis
model.
Theoretical Biology and Medical Modelling 2005, 2:42 />Page 7 of 11
(page number not for citation purposes)
activities little in response to substrate concentrations
over a short period of time; perturbations are thus damp-
ened by boundary reactions before being transmitted to
the static modules. As a result, the reaction rates in the
static modules do not change much after perturbations.
Such a moderate time evolution allows even reactions that
are not very fast to realize a reaction-rate distribution, v,
that can be calculated from v = S
#
b in as little as one
numerical integration step. This allows the hybrid model
to produce results that are in agreement with the dynamic
model when the boundary reactions weaken
perturbation.
The results we obtained when we relocated the boundary
of the static module in the erythrocyte model support the
importance of elasticity ratios. When G6PDH was
included inside the static module, PGI became the new
boundary reaction instead of G6PDH. The elasticity of
PGI is large (elasticity = -452.496) compared to its neigh-
bour G6PDH (elasticity = 0.0955). The relocated bound-
ary is therefore composed of a pair of reactions that might
produce unacceptable calculation errors, and in fact led to
inconsistencies between the hybrid and dynamic models.
Thus, the analytical conclusion presented in Eqs. (2) and
(3) also holds for complex pathways, and elasticity pro-
vides a criterion for identifying groups of enzymes that
can be approximated with sufficient accuracy by static
modules. However, a large amount of experimental data
is still required to determine the elasticities of all enzy-
matic reactions. In addition, the demarcation of the static
module using elasticities determined by conventional
biochemical experiments is unrealistic with respect to
their throughput. Hence, the comprehensive determina-
tion of bottleneck reactions is the key task in the construc-
tion of large-scale metabolic pathway models using the
hybrid method. Recent advances in flux measurement,
quantitative metabolomics and proteomics allow large-
scale measurement of flux distributions [22], intracellular
metabolite concentrations and amounts of enzymes [23].
Recently, a method for high-throughput metabolomic
analyses using capillary electrophoresis assisted by
advanced mass spectrometry (CE-MS) and LC-MS/MS has
been developed by the metabolomics group at our insti-
tute [24-27]. This technology allows us to determine the
concentrations of more than 500 different metabolites
quantitatively in a few hours. Furthermore, we are
developing a method to calculate whole reaction rates of
metabolic systems. This method has already achieved pre-
liminary successes in determining the reaction rates of gly-
colysis in E. coli and human red blood cells. Pulse-chase
analyses using
13
C labeled molecules and the CE-MS/LC-
MS high-throughput system have also been used success-
fully by the same metabolomics group to determine fluxes
in the E. coli central carbon pathway.
Several approaches have been proposed to quantify elas-
ticity and other coefficients of metabolic control analysis
from experimental data such as flux rates, metabolite con-
centrations or enzyme concentrations [28-31]. Thus, the
hybrid method, in combination with the 'omics' data of
metabolism, enables a dynamic kinetic simulation of cell-
wide metabolism.
Conclusion
Using this hybrid method, the cost of developing large-
scale computer models can be greatly reduced since pre-
cise modelling with dynamic rate equations and kinetic
parameters is limited to bottleneck reactions. This drasti-
cally reduces the number of experiments needed to obtain
the kinetic properties required for the dynamic simulation
of metabolic pathways.
Methods
Calculation procedure
The hybrid method works within one numerical integra-
tion step as follows: (i) all the reaction rates in the
dynamic module are calculated from dynamic rate equa-
tions (V
1
, V
2
, V
9
, and V
10
in Figure 1); (ii) the reaction rate
distribution in the static module (V
3
, V
4
, V
5
, V
6
, V
7
, and
V
8
) is derived from the balance equation Sv = b, where S
denotes the stoichiometric matrix, v the flux distribution,
and b the rates of the dynamic exchange reactions at the
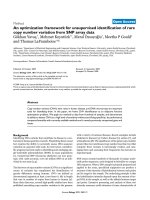
A pathway map of the erythrocyte modelFigure 5
A pathway map of the erythrocyte model. The eryth-
rocyte model contains 39 metabolites and 41 reactions (not
all are shown here). The reactions represented by red
arrows are placed in the static module of the hybrid model.
The other reactions belong to the dynamic module. The
abbreviations of metabolites and enzymes are described in
Tables 4 and 5 in Additional file 1, respectively.
Theoretical Biology and Medical Modelling 2005, 2:42 />Page 8 of 11
(page number not for citation purposes)
system boundary (V
2
, V
9
, and V
10
) that are calculated in
step (i); and (iii) the concentrations of the metabolites
(X
1
-X
13
) are determined by numerical integration of the
reaction rates calculated in steps (i) and (ii). All the reac-
tions in the static module are assumed to be reversible.
The calculation of the reaction rate distribution in the
static module is similar to that in the MFA method. The
only difference is that the exchange reactions between the
dynamic and static modules are represented by kinetic
rate equations instead of constant fluxes. In this study, we
term a dynamic exchange reaction of a static module a
"boundary reaction". Dynamic boundary reactions pro-
vide quasi-dynamic changes in the reaction rate distribu-
tion in the static module. The reaction rate distribution in
the static module is calculated at every integration step
that refers to the boundary reaction rates, which are deter-
mined by concentrations of metabolites inside and out-
side the static module. The time evolution of the
metabolite concentration in the static module is calcu-
lated at every integration step by numerical integration of
the reaction rates as well as the metabolites in the
dynamic module.
In step (ii), the Moore-Penrose pseudo-inverse is
employed to calculate the reaction rate distribution of the
static module at each numerical integration step. This
should result in a smaller computational cost than linear
programming, which is commonly used to determine the
flux distribution of the underdetermined system. When
the linear equation Sv = b is determined, S
#
, the Moore-
Penrose pseudo-inverse of S, is identical to S
-1
, the inverse
of S. Thus, the reaction rate distribution of the static mod-
ule is solved uniquely as v = S
-1
b. If the equation Sv = b is
over-determined, v = S
#
b provides the least squares esti-
mate of the reaction rate distribution [32] which
minimizes |Sv-b|
2
. Through this procedure, the error is
distributed equally among the reaction rates of the static
module.
In the case of an underdetermined static module, the solu-
tion was chosen from the solution space of the balance
equation Sv = b to minimize the error of the ideal reaction
rate distribution specified by the user. The optimal solu-
tion v
best
is represented in Eq. (1) below [see Supplemen-
tary Text 1 in Additional file 1 for the derivation]:-
v
best
= i + S
#
(b - Si)(1)
where v
best
is the closest solution to the ideal reaction rate
distribution i in the solution space [Figure 6 in Additional
file 1].
Evaluation of errors at steady state
To compare the accuracy of the hybrid method with the
conventional dynamic kinetic method analytically, we
first employed a pathway model comprising the three
sequential reactions shown below. The whole pathway is
assumed to be at a steady-state.
In the remainder of this report, a "dynamic model" refers
to a metabolic pathway model that is represented by
kinetic rate equations only. Let v
1
, v
2
and v
3
be the reaction
rates of the three sequential reactions. In the hybrid
model, the reaction rate v
2
was represented as a static
module of this pathway. When the concentration of
metabolite A, the substrate of v1, is perturbed, the discrep-
ancy between v2 in the hybrid model and v2 in the
dynamic model is as described below [see Supplementary
Text 2 in Additional file 1 for the derivation]:
where v
2d
, v
2k
, [A], [B],
ε
v1
A
and
ε
v1
B
denote the reaction
rate v
2
in the dynamic model, v
2
in the hybrid model, con-
centration of metabolite A, concentration of metabolite B,
elasticity of v
1
with respect to metabolite A, and elasticity
of v2, respectively. The variables with ∆ are increments
after a small time step ∆t. The parameter p represents a
ratio of the reaction rate in the static module to the influx,
as in ∆v
2h
= p∆v
1
. The ratio p is determined by the stoichi-
ometric matrix of the pathway.
Table 3: Comparisons of the dynamic model and the hybrid model of the erythrocyte pathway shown in Fig. 5. The maximum errors
were measured within one numerical integration step. "Perturbation" denotes whether the errors were measured under a steady-
state condition (-) or after a three-fold increase of FDP concentration (+).
Perturbation Maximum error (concentration) Maximum error (reaction rate)
Boundary - 7.796 × 10
-3
(GL6P) 1.555 × 10
-7
(R5PI)
+1.153 × 10
-7
(GL6P) 3.020 × 10
-5
(TK1)
Static part - 1.111 × 10
-8
(GSSG) 2.170 × 10
-4
(6PGODH)
+4.282 × 10
-12
(GO6P) 2.170 × 10
-4
(6PGODH)
→→⇒→→ABCD
vv v123
∆∆ ∆ ε ε∆
vv A
v
A
v
B
tp
dh A
v
B
v
22
1
1
2
2
2−= ⋅⋅
⋅⋅⋅−
()
[]
[] []
Theoretical Biology and Medical Modelling 2005, 2:42 />Page 9 of 11
(page number not for citation purposes)
In Eq. (2), the left bracket term on the right-hand side
indicates the magnitude of the perturbation transmitted
to the static module. This term indicates that the error
between the hybrid and dynamic models is proportional
to the increment of metabolites and the elasticity of the
boundary reactions. The right bracket describes the sus-
ceptibility of the reaction rate v
2
to v
1
. When
ε
v2
B
satisfies
the relationship below, v
2
in the hybrid model exhibits
identical time evolution to the dynamic model:
Since a small ∆t (<<1.0s) is usually employed for accurate
simulations of metabolic pathways, Eq. (3) implies that a
reaction with large elasticity can be appropriately replaced
by a static module.
For more complex pathways, such a theoretical analysis is
not practical because large numbers of variables and
parameters might impede clear discussions. Instead, sim-
ulation experiments were performed to compare the accu-
racy of hybrid models with dynamic models by numerical
methods.
The accuracy of the hybrid model was evaluated numeri-
cally in comparison with a conventional kinetic model of
the same metabolic pathway under two conditions: a
steady-state condition and a time evolution after a two-
fold increase of metabolites that are catalyzed by bound-
ary reactions. The errors under steady-state conditions
were employed as controls to evaluate discrepancies in
dynamic behaviour. These computer simulations were
performed using the E-Cell Simulation Environment ver-
sion 1.1 or 3.1.102 for RedHat Linux 9.0/i386. The errors
of reaction rates and metabolite concentrations were
measured as below:-
where v
d
and v
h
denote either the reaction rates or the con-
centrations in the dynamic and hybrid models, respec-
tively. The values of v
d
and v
h
were taken at the first
numerical integration step, in which the concentration
increase influences the initial steady-state values of the
reaction rates and metabolite concentrations. In this arti-
cle, this is termed "one-step error". We used one-step
errors to represent the discrepancies between the two sim-
ulation methods in transient dynamics.
The one-step errors were evaluated using two simple path-
ways; the static module of one is determined, while the
other is underdetermined (Figure 2a and 2b). All the reac-
tion rates in these simple pathways were represented as v
= k
f
[S]-k
r
[P] where v, k
f
, k
r
, [S], and [P] are a reaction rate,
a forward rate constant, a reverse rate constant, a substrate
concentration and a product concentration, respectively.
In the pathway with the over-determined static module,
the rate constants were k
f
= 0.05s
-1
and k
r
= 0.091s
-1
for
E_CD and E_CE, k
f
= 0.1s
-1
and k
r
= 0.091s
-1
for E_DF and
E_EG, and k
f
= 0.01s
-1
and k
r
= 0.001
-1
for the other reac-
tions in the pathway of Figure 2a. The initial metabolite
concentrations were 1.0 mM for A, B and C, and 0.5 mM
for the other metabolites. Metabolite A was increased two-
fold to evaluate the errors in transient dynamics. In the
pathway with an underdetermined static module, the
kinetic parameters were k
f
= 0.01s
-1
and k
r
= 0.001s
-1
for
E_AB, E_BC, and E_FG; k
f
= 0.1s
-1
and k
r
= 0.098s
-1
for
E_CD and E_DF; k
f
= 0.1s
-1
and k
r
= 0.097s
-1
for E_CE and
E_EF; and k
f
= 0.1s
-1
and k
r
= 0.96s
-1
for E_CF. The steady-
state flux distribution was employed for the ideal reaction
rate distribution in the static module; the ideal reaction
rates were 2
µ
M/s for E_CD and E_DF, 3
µ
M/s for E_CE
and E_EF, and 4
µ
M/s for E_CF. All the initial metabolite
concentrations were 1.0 mM. The concentration of metab-
olite A was increased two-fold to evaluate the error.
Correlation between elasticity and error
Elasticity is a coefficient used to quantify the sensitivity of
the enzyme to its substrates and is defined as below in the
context of metabolic control analysis [21]:
where [S] and v denote the substrate concentration and
the reaction rate of the enzyme, respectively. Correlation
between the one-step errors and elasticities of each
enzyme at a steady state was examined using a linear path-
way and a glycolysis model [13,20] (Figure 2c and 2d,
respectively). In the linear pathway model, the reaction
rate v is represented by the same equation as in the two
hypothetical models above. The kinetic parameters were
k
f
= 0.01s
-1
and k
r
= 0.009s
-1
for E_AB, E_BC, and E_FG and
k
f
= 0.1s
-1
and k
r
= 0.099s
-1
for E_CD, E_DE, and E_EF. All
the initial metabolite concentrations were 1.0 mM. The
two rate constants of reactions E_BC, E_CD, E_DE, and
E_DF were altered within the range 0.01<k
f
<1.0. The value
of k
r
was determined to satisfy k
f
-k
r
= 0.01 to sustain the
initial steady-state concentrations. The concentration of
metabolite A was increased two-fold to evaluate the
errors. For error measurements in the glycolysis model,
each enzymatic reaction was replaced, one by one, with a
static module. The substrate concentrations of the bound-
ary reactions were increased three-fold.
Application to erythrocyte metabolism
A cell-wide model of erythrocyte metabolism [14] was
employed to evaluate the applicability of the hybrid
ε
∆
B
v
B
v
p
t
2
2
3=⋅
()
[]
error =
−||vv
v
dh
d
ε
∂
∂
S
v
S
v
v
S
=
()
[]
[]
4
Theoretical Biology and Medical Modelling 2005, 2:42 />Page 10 of 11
(page number not for citation purposes)
method in a more realistic and complex pathway. This
erythrocyte model reproduces steady-state metabolite
concentrations similar to experimental data. The static
region was determined using a ratio of elasticities as
below:
where
ε
b
and
ε
x
denote the elasticities of a boundary reac-
tion and of reaction X, respectively. All the elasticities of
the model were calculated by numerical differentiation of
each rate equation. A group of enzymes with small r val-
ues were regarded as appropriate candidates for inclusion
in a static module. The concentration of fructose-1,6-
diphosphate (FDP) was increased three-fold to measure
the errors in dynamic behaviours.
Competing interests
The author(s) declare that they have no competing
interests.
Authors' contributions
Yugi contributed to the development and implementa-
tion of the hybrid method into the E-Cell system, and
developed methods for analyzing errors at a steady state.
Nakayama provided the concept of hybrid method and
directed the project. Kinoshita contributed to the develop-
ment of simulation models and the analyses, and Tomita
is a project leader.
Additional material
Acknowledgements
We thank Nobuyoshi Ishii for insightful discussions; Yoshihiro Toya for the
preparation of one of the small virtual pathway models; Pawan Kumar Dhar,
Yasuhiro Naito, Shinichi Kikuchi and Kazuharu Arakawa for critically read-
ing the manuscript; and Kouichi Takahashi for providing technical advice.
This work was supported in part by a grant from Leading Project for
Biosimulation, Keio University, The Ministry of Education, Culture, Sports,
Science and Technology (MEXT); a grant from CREST, JST; a grant from
New Energy and Industrial Technology Development and Organization
(NEDO) of the Ministry of Economy, Trade and Industry of Japan (Devel-
opment of a Technological Infrastructure for Industrial Bioprocess Project);
and a grant-in-aid from the Ministry of Education, Culture, Sports, Science
and Technology for the 21 st Century Centre of Excellence (COE) Program
(Understanding and Control of Life's Function via Systems Biology).
References
1. Blattner FR, Plunkett GIII, Bloch CA, Perna NT, Burland V, Riley M,
Collado-Vides J, Glasner JD, Rode CK, Mayhew GF, Gregor J, Davis
NW, Kirkpatrick HA, Goeden MA, Rose DJ, Mau B, Shao Y: The
complete genome sequence of Escherichia coli K-12. Science
1997, 277(5331):1453-1462.
2. Fiehn O, Kopka J, Dormann P, Altmann T, Trethewey RN, Willmitzer
L: Metabolite profiling for plant functional genomics. Nature
Biotechnology 2000, 18(11):1157-1161.
3. Wang Y, Liu CL, Storey JD, Tibshirani RJ, Herschlag D, Brown PO:
Precision and functional specificity in mRNA decay. Proceed-
ings of the National Academy of Sciences of the United States of America
2002, 99(9):5860-5865.
4. Edwards JS, Palsson BO: The Escherichia coli MG1655 in silico
metabolic genotype: its definition, characteristics, and capa-
bilities. Proceedings of the National Academy of Sciences of the United
States of America 2000, 97(10):5528-5533.
5. Shen-Orr SS, Milo R, Mangan S, Alon U: Network motifs in the
transcriptional regulation network of Escherichia coli. Nature
Genetics 2002, 31:64-68.
6. Bakker BM, Michels PA, Opperdoes FR, Westerhoff HV: What con-
trols glycolysis in bloodstream form Trypanosoma brucei?
Journal of Biological Chemistry 1999, 274(21):14551-14559.
7. Barkai N, Leibler S: Robustness in simple biochemical
networks. Nature 1997, 387(6636):913-917.
8. Bhalla US, Iyengar R: Emergent properties of networks of bio-
logical signaling pathways. Science 1999, 283(5400):381-387.
9. Cornish-Bowden A, Cardenas ML: Information transfer in meta-
bolic pathways: effects of irreversible steps in computer
models. European Journal of Biochemistry 2001, 268(24):6616-6624.
10. Chance B, Garfinkel D, Higgins J, Hess B: Metabolic control mech-
anisms V: a solution for the equations representing interac-
tion between glycolysis and respiration in ascites tumor
cells. Journal of Biological Chemistry 1960, 235(8):2426-2439.
11. Monod J, Wyman J, Changeux JP: On the nature of allosteric
transitions: a plausible model. Journal of Molecular Biology 1965,
12:88-118.
12. King EL, Altman C: A schematic method of deriving the rate
laws for enzyme catalyzed reactions. Journal of Physical Chemistry
1956, 60:1375-1378.
13. Joshi A, Palsson BO: Metabolic dynamics in the human red cell:
part I. a comprehensive kinetic model. Journal of Theoretical
Biology 1989, 141(4):515-528.
14. Ni TC, Savageau MA: Model assessment and refinement using
strategies from biochemical systems theory: application to
metabolism in human red blood cells. Journal of Theoretical
Biology 1996, 179(4):329-368.
15. Henriksen CM, Christensen LH, Nielsen J, Villadsen J: Growth ener-
getics and metabolic fluxes in continuous cultures of Penicil-
lium chrysogenum. Journal of Biotechnology 1996, 45:149-164.
16. Ibarra RU, Edwards JS, Palsson BO: Escherichia coli K-12 under-
goes adaptive evolution to achieve in silico predicted opti-
mal growth. Nature 2002, 420(6912):186-189.
17. Aiba S, Matsuoka M: Identification of metabolic model: citrate
production from glucose by Candida lipolytica. Biotechnology
and Bioengineering 1979, 21(8):1373-1386.
18. Varner J, Ramkrishna D: Mathematical models of metabolic
pathways. Current Opinion in Biotechnology 1999, 10(2):146-150.
19. Mahadevan R, Edwards JS, Doyle FJ: Dynamic flux balance analy-
sis of diauxic growth in Escherichia coli. Biophysical Journal 2002,
83(3):1331-1340.
20. Mulquiney PJ, Kuchel PW: Model of 2,3-bisphosphoglycerate
metabolism in the human erythrocyte based on detailed
enzyme kinetic equations: equations and parameter
refinement. Biochemical Journal 1999, 342(Pt 3):581-596.
21. Fell DA: Metabolic control analysis: a survey of its theoretical
and experimental development. Biochemical Journal 1992,
286:313-330.
22. Wittmann C, Heinzle E: Genealogy profiling through strain
improvement by using metabolic network analysis: meta-
bolic flux genealogy of several generations of lysine-produc-
ing corynebacteria. Applied and Environmental Microbiology 2002,
68(12):5843-5859.
23. Ghaemmaghami S, Huh WK, Bower K, Howson RW, Belle A,
Dephoure N, O'Shea EK, Weissman JS: Global analysis of protein
expression in yeast. Nature 2003, 425(6959):737-741.
Additional File 1
Derivations of equations (Eqs. (1) and (2)), supplementary tables (Table
4 and Table 5) and figure (Figure 6).
Click here for file
[ />4682-2-42-S1.doc]
r
b
X
=
ε
ε
Publish with BioMed Central and every
scientist can read your work free of charge
"BioMed Central will be the most significant development for
disseminating the results of biomedical research in our lifetime."
Sir Paul Nurse, Cancer Research UK
Your research papers will be:
available free of charge to the entire biomedical community
peer reviewed and published immediately upon acceptance
cited in PubMed and archived on PubMed Central
yours — you keep the copyright
Submit your manuscript here:
/>BioMedcentral
Theoretical Biology and Medical Modelling 2005, 2:42 />Page 11 of 11
(page number not for citation purposes)
24. Soga T, Kakazu Y, Robert M, Tomita M, Nishioka T: Qualitative and
quantitative analysis of amino acids by capillary electro-
phoresis-electrospray ionization-tandem mass
spectrometry. Electrophoresis 2004, 25(13):1964-1972.
25. Soga T, Ohashi Y, Ueno Y, Naraoka H, Tomita M, Nishioka T: Quan-
titative metabolome analysis using capillary electrophoresis
mass spectrometry. J Proteome Res 2003, 2(5):488-494.
26. Soga T, Ueno Y, Naraoka H, Ohashi O, Tomita M, Nishioka T:
Simultaneous determination of anionic intermediates for
Bacillus subtilis metabolic pathways by capillary electro-
phoresis electrospray Ionization mass spectrometry. Analyti-
cal Chemistry 2002, 74:2233-2239.
27. Ishii N, Robert M, Nakayama Y, Kanai A, Tomita M: Toward large-
scale modeling of the microbial cell for computer
simulation. J Biotechnol 2004, 113(1-3):281-294.
28. Delgado J, Liao JC: Determination of flux control coefficients
from transient metabolite concentrations. Biochemical Journal
1992, 282(Pt 3):919-927.
29. Acerenza L, Cornish-Bowden A: Generalization of the double-
modulation method for in situ determination of elasticities.
Biochemical Journal 1997, 327(Pt1):217-223.
30. de la Fuente A, Snoep JL, Westerhoff HV, Mendes P: Metabolic con-
trol in integrated biochemical systems. European Journal of
Biochemistry 2002, 269(18):4399-4408.
31. Wu L, Wang W, van Winden WA, van Gulik WM, Heijnen JJ: A new
framework for the estimation of control parameters in met-
abolic pathways using lin-log kinetics. European Journal of
Biochemistry 2004, 271(16):3348-3359.
32. Stephanopoulos GN, Aristidou AA, Nielsen J: Metabolic Engineer-
ing: Principles and Methodologies. San Diego , Academic Press;
1998.