Additional Praise for Fixed Income Securities Tools for Today’s Markets, 2nd Edition phần 4 docx
Bạn đang xem bản rút gọn của tài liệu. Xem và tải ngay bản đầy đủ của tài liệu tại đây (1.04 MB, 52 trang )
turity is the same as computing DV01. In other words, the key rate expo-
sures of the hedging securities equal their DV01s. To illustrate the conve-
nience of par yield key rates with par hedging bonds, suppose in the
example of the previous section that the 10-year bond sold at par like the
other three hedging bonds. In that case, the hedging equations (7.3)
through (7.6) reduce to the following simpler form:
(7.8)
(7.9)
(7.10)
(7.11)
To compute the hedge amount in this case, simply divide each key rate ex-
posure by the DV01 (per unit face value) of the hedging bond of corre-
sponding maturity.
The disadvantage of using par yields, particularly when combined with
the assumption that intermediate yields are found by the lines drawn in
Figure 7.1, is that the changes in the forward rate curve implied by these
yields changes have a bizarre shape. The problem is similar to that of the
forward curve emerging from linear yield interpolation in Figure 4.3:
Kinks in the yield curve translate into sizable jumps in the forward curve.
Changing key rates to spot rates has the same disadvantage.
Setting key rates to forward rates naturally solves this problem: The
shifted forward curve is only as odd as the shapes in Figure 7.1. The prob-
lem with shifting forward rates is that spot rate changes are no longer local.
Changing the forward rates from two to five years while keeping all other
forward rates constant, for example, changes all the spot rates from two
years and beyond. True, the effect on a 30-year rate is much less than the ef-
fect on a five-year rate, but the key rate interpretation of shocking one part
of the term structure at a time is lost. Forward shifts will, however, be the
more natural set of shifts in bucket analysis, described in the next section.
.
.
15444
100
67 25637
30
F =
.
.
08308
100
42 36832
10
F =
.
.
04375
100
3 77314
5
F =
.
.
01881
100
98129
2
F =
Choosing Key Rates 141
With respect to the terms of the key rates, it is clearly desirable to
spread them out over the maturity range of interest. More subtly, well-cho-
sen terms make it possible to hedge the resulting exposures with securities
that are traded and, even better, with liquid securities. As an example, con-
sider a swap market in an emerging market currency. A dealer might make
markets in long-term swaps of any maturity but might observe prices and
hedge easily only in, for example, 10- and 30-year swaps. In that case there
would not be much point in using 10-, 20-, and 30-year par swap yields as
key rates. If all maturities between 10 and 30 years were of extremely lim-
ited liquidity, it would be virtually impossible to hedge against changes in
those three ill-chosen key rates. If a 20-year security did trade with limited
liquidity the decision would be more difficult. Including a 20-year key rate
would allow for better hedging of privately transacted, intermediate-matu-
rity swaps but would substantially raise the cost of hedging.
BUCKET SHIFTS AND EXPOSURES
A bucket is jargon for a region of some curve, like a term structure of interest
rates. Bucket shifts are similar to key rate shifts but differ in two respects.
First, bucket analysis usually uses very many buckets while key rate analysis
tends to use a relatively small number of key rates. Second, each bucket shift
is a parallel shift of forward rates as opposed to the shapes of the key rate
shifts described previously. The reasons for these differences can be ex-
plained in the context for which bucket analysis is particularly well suited,
namely, managing the interest rate risk of a large swap portfolio.
Swaps are treated in detail in Chapter 18, but a few notes are neces-
sary for the discussion here. Since this section focuses on the risk of the
fixed side of swaps, the reader may, for now, think of swap cash flows as if
they come from coupon bonds. Given the characteristics of the swap mar-
ket, agreements to receive or pay those fixed cash flows for a particular set
of terms (e.g., 2, 5, and 10 years) may be executed at very low bid-ask
spreads. Unwinding those agreements after some time, however, or enter-
ing into new agreements for different terms to maturity, can be costly. As a
result, market making desks and other types of trading accounts tend to re-
main in swap agreements until maturity. A common problem in the indus-
try, therefore, is how to hedge extremely large books of swaps.
The practice of accumulating swaps leads to large portfolios that
change in composition only slowly. As mentioned, this characteristic
142 KEY RATE AND BUCKET EXPOSURES
makes it reasonable to hedge against possible changes in many small seg-
ments of the term structure. While hedging against these many possible
shifts requires many initial trades, the stability of the underlying portfolio
composition assures that these hedges need not be adjusted very frequently.
Therefore, in this context, risk can be reduced at little expense relative to
the holding period of the underlying portfolio.
As discussed in previous sections, liquid coupon bonds are the most
convenient securities with which to hedge portfolios of U.S. Treasury
bonds. While, analogously, liquid swaps are convenient for hedging portfo-
lios of less liquid swaps, it turns out that Eurodollar futures contracts play
an important role as well. These futures will be treated in detail in Chapter
17, but the important point for this section is that Eurodollar futures may
be used to hedge directly the risk of changes in forward rates. Furthermore,
they are relatively liquid, particularly in the shorter terms. The relative ease
of hedging forward rates makes it worthwhile to compute exposures of
portfolios to changes in forward rates.
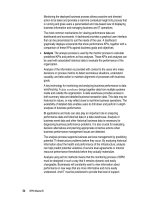
Figure 7.2 graphs the bucket exposures of receiving the fixed side of
$100 million of a 6% par swap assuming, for simplicity, that swap rates
are flat at 6%. (It should be emphasized, and it should become clear
shortly, that the assumption of a flat term structure is not at all necessary
for the computation of bucket exposures.) The graph shows, for example,
that the exposure to the six-month rate 2.5 years forward is about $4,200.
Bucket Shifts and Exposures 143
FIGURE 7.2 Bucket Exposures of a Six-Year Par Swap
–$3,000
–$2,000
–$1,000
$0
$1,000
$2,000
$3,000
$4,000
$5,000
Years Forward
Bucket Exposure
0 .5 1 2 2.5 3 3.5 4.5 5
5.5
1.5
4
In other words, a one-basis point increase in the six-month rate 2.5 years
forward lowers the value of a $100 million swap by $4,200. The sum of
the bucket exposures, in this case $49,768, is the exposure of the swap to a
simultaneous one-basis point change to all the forwards. If the swap rate
curve is flat, as in this simple example, this sum exactly equals the DV01 of
the fixed side of the swap. In more general cases, when the swap rate curve
is not flat, the sum of the forward exposures is usually close to the DV01.
In any case, Figure 7.2 and this discussion reveal that this swap can be
hedged by paying fixed cash flows in a swap agreement of similar coupon
and maturity or by hedging exposures to the forward rates directly with
Eurodollar futures.
Table 7.3 shows the computation of the particular bucket exposure
mentioned in the previous paragraph. The original forward rate curve is
flat at 6%, and the par swap, by definition, is priced at 100% of face
amount. For the perturbed forward curve, the six-month rate 2.5 years for-
ward is raised to 6.01%, and all other forwards are kept the same. The
new spot rate curve and discount factors are then computed using the rela-
144 KEY RATE AND BUCKET EXPOSURES
TABLE 7.3 Exposure of a $100 million 6% Par Swap to the Six-Month Rate 2.5
Years Forward
Initial forward curve flat at 6%
Bucket exposure: $4,187
Years Cash Flow Perturbed Perturbed Discount
Forward ($millions) Forward Spot Factor
0 3 6.00% 6.0000% 0.970874
0.5 3 6.00% 6.0000% 0.942596
1 3 6.00% 6.0000% 0.915142
1.5 3 6.00% 6.0000% 0.888487
2 3 6.00% 6.0000% 0.862609
2.5 3 6.01% 6.0017% 0.837444
3 3 6.00% 6.0014% 0.813052
3.5 3 6.00% 6.0012% 0.789371
4 3 6.00% 6.0011% 0.766380
4.5 3 6.00% 6.0010% 0.744058
5 3 6.00% 6.0009% 0.722386
5.5 103 6.00% 6.0008% 0.701346
Perturbed value ($millions): 99.995813
tionships of Part One. Next, the fixed side of the swap is valued at
99.995813% of face value by discounting its cash flows. Finally, the
bucket exposure for $100 million of the swap is
(7.12)
Say that a market maker receives fixed cash flows from a customer in a
$100 million, six-year par swap and pays fixed cash flows to another cus-
tomer in a $141.8 million, four-year par swap. The cash flows of the result-
ing portfolio and the bucket exposures are given in Table 7.4. A negative
exposure means that an increase in that particular forward rate raises the
value of the portfolio. The bucket exposures sum to zero so that the portfo-
lio is neutral with respect to parallel shifts of the forward rate curve. This
discussion, therefore, is a very simple example of a growing swap book that
is managed so as to have, in some sense, no outright interest rate exposure.
−×−
()
=$,, . % %$,100 000 000 99 995813 100 4 187
Bucket Shifts and Exposures 145
TABLE 7.4 Bucket Exposures for a Position Hedged for Parallel
Shifts
Initial forward curve flat at 6%
Coupon 6.00% 6.00%
Maturity 6.0 4.0
Face ($mm) 100.000 –141.801
Portfolio Bucket
Years Cash Flow Flows Exposure
Forward ($millions) ($millions) ($)
0.00 3.000 –4.254 –1.254 –2,029
0.50 3.000 –4.254 –1.254 –1,970
1.00 3.000 –4.254 –1.254 –1,913
1.50 3.000 –4.254 –1.254 –1,857
2.00 3.000 –4.254 –1.254 –1,803
2.50 3.000 –4.254 –1.254 –1,750
3.00 3.000 –4.254 -–1.254 –1,699
3.50 3.000 –146.055 –143.055 –1,650
4.00 3.000 0.000 3.000 3,832
4.50 3.000 0.000 3.000 3,720
5.00 3.000 0.000 3.000 3,612
5.50 103.000 0.000 103.000 3,507
Total: 0
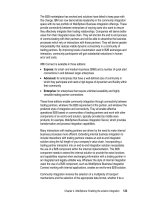
Figure 7.3 graphs the bucket exposures of this simple portfolio. Since a
six-year swap has been hedged by a four-year swap, interest rate risk re-
mains from six-month rates 4 to 5.5 years forward. The total of this risk is
exactly offset by negative exposures to six-month rates from 0 to 3.5 years
forward. So while the portfolio has no risk with respect to parallel shifts of
the forward curve, it can hardly be said that the portfolio has no interest
rate risk. The portfolio will make money in a flattening of the forward
curve, that is, when rates 0 to 3.5 years forward rise relative to rates 4 to
5.5 years forward. Conversely, the portfolio will lose money in a steepen-
ing of the forward curve, that is, when rates 0 to 3.5 years forward fall rel-
ative to rates 4 to 5.5 years forward.
A market maker with a portfolio characterized by Figure 7.3 may very
well decide to eliminate this curve exposure by trading the relevant for-
ward rates through Eurodollar futures. The market maker could certainly
reduce this curve exposure by trading par swaps and could neutralize this
exposure completely by entering into a sufficient number of swap agree-
ments. But hedging directly with Eurodollar futures has the advantages of
simplicity and, often, of liquidity. Also, should the forward exposure pro-
file change with the level of rates and the shape of the curve, adjustments
to a portfolio of Eurodollar futures are preferable to adding even more
swaps to the market maker’s growing book.
146 KEY RATE AND BUCKET EXPOSURES
FIGURE 7.3 Bucket Exposures of a Six-Year Swap Hedged with a Four-Year Swap
–$3,000
–$2,000
–$1,000
$0
$1,000
$2,000
$3,000
$4,000
$5,000
Years Forward
Bucket Exposure
0 .5 1 1.5
2
2.5 3 3.5
4
4.5 5
5.5
As each Eurodollar futures contract is related to a particular three-
month forward rate and as 10 years of these futures trade at all times,
3
it is
common to divide the first 10 years of exposure into three-month buckets.
In this way any bucket exposure may, if desired, be hedged directly with
Eurodollar futures. Beyond 10 years the exposures are divided according
to the same considerations as when choosing the terms of key rates.
IMMUNIZATION
The principles underlying hedging with key rate or bucket exposures can
be extrapolated to a process known as immunization. No matter how
many sources of interest rate risk are hedged, some interest rate risk re-
mains unless the exposure to each and every cash flow has been perfectly
hedged. For example, an insurance company may, by using actuarial ta-
bles, be able to predict its future liabilities relatively accurately. It can then
immunize itself to interest rate risk by holding a portfolio of assets with
cash flows that exactly offset the company’s future expected liabilities.
The feasibility of immunization depends on the circumstances, but it is
worth pointing out the spectrum of tolerances for interest rate risk as re-
vealed by hedging techniques. On the one extreme are hedges that protect
against parallel shifts and other single-factor specifications described in
Part Three. Away from that extreme are models with relatively few factors
like the two- and multi-factor models of Chapter 13, like the empirical ap-
proach discussed in Chapter 8, and like most practical applications of key
rates. Toward the other extreme are bucket exposures and, at that other
extreme, immunization.
MULTI-FACTOR EXPOSURES AND RISK MANAGEMENT
While this chapter focuses on how to quantify the risk of particular changes
in the term structure and on how to hedge that risk, key rate and bucket ex-
posures may also be applied to problems in the realm of risk management.
The introduction to Chapter 5 mentioned that a risk manager could
combine an assumption that the annual volatility of interest rates is 100
basis points with a computed DV01 of $10,000 per basis point to conclude
Multi-Factor Exposures and Risk Management 147
3
The longer-maturity Eurodollar futures are not nearly so liquid as the earlier ones.
that the annual volatility of a portfolio is $1 million. But this measure of
portfolio volatility has the same drawback as one-factor measures of price
sensitivity: The volatility of the entire term structure cannot be adequately
summarized with just one number. As to be discussed in Part Three, just as
there is a term structure of interest rates, there is a term structure of volatil-
ity. The 10-year par rate, for example, is usually more volatile than the 30-
year par rate.
Key rate and bucket analysis may be used to generalize a one-factor es-
timation of portfolio volatility. In the case of key rates, the steps are as fol-
lows: (1) Estimate a volatility for each of the key rates and estimate a
correlation for each pair of key rates. (2) Compute the key rate 01s of the
portfolio. (3) Compute the variance and volatility of the portfolio. The
computation of variance is quite straightforward given the required inputs.
For example, if there are only two key rates, R
1
and R
2
, if the key rate 01s
of the portfolio are KR01
1
and KR01
2
, and if the portfolio value is P, then
the change in the value of the portfolio is
(7.13)
where ∆ denotes a change. Furthermore, letting
σ
2
with the appropriate
subscript denote a particular variance and letting
ρ
denote the correla-
tion between changes in the two key rates, the variance of the portfolio
is simply
(7.14)
The standard deviation or volatility of the portfolio is simply, of course,
the square root of this variance. Bucket analysis may be used in the same
way, but a volatility must be assigned to each forward rate and many more
correlation pairs must be estimated.
σσσ ρσσ
P
2
1
2
1
2
2
2
2
2
1212
2=++×××KR01 KR01 KR01 KR01
∆∆ ∆PR R=+KR01 KR01
11 2 2
148 KEY RATE AND BUCKET EXPOSURES
149
CHAPTER
8
Regression-Based Hedging
D
V01 and duration measure price sensitivity under any given assump-
tions about term structure movement. Yield-based DV01 and modified
duration assume parallel yield shifts, key rates assume the particular local
perturbations described in Chapter 7, and the models of Part Three make
more complex assumptions. The goal of all these choices is to approxi-
mate the empirical reality of how interest rates behave. When practition-
ers hedge with DV01, for example, they express the view that a large part
of the variation of nearby yields may be explained by parallel shifts. The
general approach may be summarized as empirically analyzing term
structure behavior, capturing the important features of that behavior in a
relatively simple model, and then calculating price sensitivities based on
that model.
An alternative approach is to use empirical analysis directly as the
model of interest rate behavior. This chapter shows how regression analy-
sis is used for hedging. The first section, on volatility-weighted hedges,
maintains the assumption of a single driving interest rate factor and, there-
fore, of perfect correlation across bond yields, but allows changes to be
other than parallel. The second section, on single-variable regression hedg-
ing, continues to assume that only one bond is used to hedge any other
bond, but allows bond yields to be less than perfectly correlated. The third
section, on two-variable regression hedging, assumes that two bonds are
used to hedge any other bond, implicitly recognizing that even two bonds
cannot perfectly hedge a given bond. To conclude the chapter, the fourth
section presents a trading case study about how 20-year Treasury bonds
might be hedged and, at the same time, asks if those bonds were fairly
priced in the third quarter of 2001.
VOLATILITY-WEIGHTED HEDGING
Consider the following fairly typical market maker problem. A client sells
the market maker a 20-year bond. In the best of circumstances the market
maker would immediately sell that same bond to another client and pocket
the bid-ask spread. More likely, the market maker will immediately sell the
most correlated liquid security, in this case a 30-year bond,
1
to hedge inter-
est rate risk. When another client does appear to buy the 20-year bond, the
market maker will sell that bond and lift the hedge—that is, buy back the
30-year bond sold as the hedge.
A market maker who believes that the 20- and 30-year yields move in
parallel would hedge with DV01, as described in Chapter 6. But what if a
1.1-basis point increase in the 20-year yield is expected to accompany a
one-basis point increase in the 30-year yield? In that case the market maker
would trade F
30
face amount of the 30-year bond to hedge F
20
face amount
of the 20-year bond such that the P&L of the resulting position is zero.
Mathematically,
(8.1)
where DV01
20
and DV01
30
are, as usual, per 100 face value. Note the role
of the negative signs in the P&L on the left-hand side of equation (8.1). If
the 20-year yield increases by 1.1 basis points then a position of F
20
face
amount of 20-year bonds experiences a P&L of –F
20
×1.1×DV01
20
/100.
This number is negative for a long position in 20-year bonds (i.e., F
20
>0)
and positive for a short position in 20-year bonds (i.e., F
20
<0).
The hedge described in equation (8.1) is called a volatility-weighted
hedge because, unlike simple DV01 hedging, it recognizes that the 20-year
yield tends to fluctuate more than the 30-year yield. The effectiveness of
this hedge is, of course, completely dependent on the predictive power of
the volatility ratio. To illustrate, say that both yields are 5.70% and that
the 20- and 30-year bonds in question sell for par. In that case, using the
−× × −× =FF
20
20
30
30
11
100 100
0.
DV01 DV01
150 REGRESSION-BASED HEDGING
1
The text purposely ignores bond futures contracts, discussed in Chapter 20. Since
the cheapest-to-deliver security of the bond futures contract may very well have a
maturity of approximately 20 years, a market maker might very well choose to sell
the bond futures contract to hedge the purchase of a 20-year bond.
equations of Chapter 6, the DV01s are .118428 and .142940, respectively.
With a volatility ratio equal to 1.1, solving equation (8.1) for F
30
shows
that the purchase of $10 million face amount 20-year bonds should be
hedged with a position of
(8.2)
or a short of about $9.1 million face amount of 30-year bonds. (Note that
a strict DV01 hedge would entail selling only about $8.3 million 30-year
bonds. Since, however, the 20-year yield is now assumed more volatile than
the 30-year yield, more 30-year bonds must be sold to hedge anticipated
price changes in the 20-year bonds.)
The number 1.1 in equations (8.1) and (8.2) is called the risk weight
2
of the hedging security, in this case of the 30-year bond. To understand this
usage, rearrange the terms of equation (8.1) as follows:
(8.3)
In words, the quantity 1.1 gives the total DV01 risk of the hedging position
as a fraction of the DV01 risk of the underlying position.
If a long position of $10 million 20-year bonds is hedged according to
equation (8.2) and it turns out that the 20-year yield increases not by 1.1
but by 1.3 basis points when the 30-year yield increases by 1 basis point,
the position will change in value by
(8.4)
Similarly, if the ratio turns out to be 1.3 and the 30-year rate increases by 5
basis points, the supposedly hedged position will lose five times the amount
indicated by equation (8.4) or about $12,000.
The simplest way to estimate the volatility ratio is to compute the two
volatilities from recent data. Collect a time series on 20-year yields and on
−×+ =−$, , .
.
$, ,
.
$,10 000 000 1 3
118428
100
9 113 670
142940
100
2 369
11
30 30
20 20
. =
−×
×
F
F
DV01
DV01
FF
30 20 20 30
11
10 000 000 1 1
118428
142940
9 113 670
=− × ×
=− × ×
=−
.
$, , .
.
.
$, ,
DV01 DV01
Volatility-Weighted Hedging 151
2
The definition of the term risk weight here is not the same as that used by
Bloomberg in the trading case study of Chapter 4.
30-year yields, compute changes of these yields from one day to the next or
from one week to the next, and then calculate the standard deviation of
these changes. This procedure requires a bit of work and a few important
decisions. First, in bond markets, data usually exist for particular issues and
not for particular maturities. So, to obtain a time series on 20- or 30-year
yields requires some splicing of data from different bond issues. Of course,
if an investigator is content to use a relatively short history, yields of indi-
vidual issues may be used. In swap markets this problem does not arise be-
cause data series are usually for new par swaps of fixed maturities. Second,
in bond markets, it is important to avoid estimating the volatility of a par-
ticular bond over a period in which it sometimes had, and sometimes did
not have, particular liquidity or financing advantages. (See Chapter 15.)
Third, choosing a time period to analyze is crucial to the applicability of the
results. Since the goal is to predict the volatility ratio in the future as accu-
rately as possible, it is enormously important to perform a study using rele-
vant observations. Sometimes these relevant observations are exclusively
from the recent past and sometimes they are from disjoint, past periods that
were characterized by economic and market conditions similar to those of
the present. The thinking behind these choices, rather than the technicalities
of computing hedge ratios, is what makes hedging a challenge. Fourth, yield
changes may be computed over each day, each week, each month, and so
on. It can be shown that the smaller the time interval, the more accurate the
estimate of volatility. If, however, the data series has many small errors, it
may be better to use changes over longer time intervals. For example, a se-
ries that repeats the same yield observation for two or three consecutive
days probably suffers from stale data. Using daily changes on such a series
will clearly underestimate volatility. Hence, in that case, computing weekly
changes would probably produce more accurate results.
Using data from January 1995 to September 2001 on one-day changes
in 20- and double-old 30-year yields
3
in the U.S. Treasury market produces
152 REGRESSION-BASED HEDGING
3
A double-old bond is not the most recently issued bond in a particular maturity
range, nor the second most recently issued bond in that maturity range, but the
third most recently issued. Double-old bonds tend to be relatively liquid but tend
not to have the financing advantages and liquidity premium associated with more
recently issued bonds. Therefore, double-old bonds are particularly suitable for em-
pirical study. Chapter 15 will discuss the impact of the issuance cycle on bond pric-
ing in more detail.
volatilities of 5.27 and 4.94 basis points per day, respectively. The ratio of
these volatilities is about 1.066. If it were felt that this time period were ap-
plicable to the present, 1.066 might be used instead of 1.1 as the risk
weight of 30-year bonds for hedging 20-year bonds.
One way to assess the safety or danger of using an estimate like that
described in the previous paragraph is to see how the volatility ratio
changes over time. Figure 8.1 graphs the volatility ratio over the time pe-
riod mentioned. The volatility on a particular day is computed from yield
changes over the previous 30 days. The volatility ratio over these many
smaller time periods ranges from .95 to 1.2. Perhaps more troubling is that
the ratio fluctuates dramatically over relatively short periods of time. Fur-
thermore, the most recent time period displays the greatest fluctuations. In
practice, volatility-weighted hedging works well for securities that are sim-
ilar in cash flow (e.g., coupon bonds with comparable terms). As this ex-
ample shows, 20- and 30-year coupon bonds may not be similar enough
for this kind of hedging.
ONE-VARIABLE REGRESSION-BASED HEDGING
Another popular hedge is based on a regression of changes in one yield on
changes in the other yield. Let ∆y
t
20
and ∆y
t
30
be the changes in the 20- and
One-Variable Regression-Based Hedging 153
FIGURE 8.1 Ratio of 20-Year Yield Volatility to 30-Year Yield Volatility
0.8
0.85
0.9
0.95
1
1.05
1.1
1.15
1.2
1.25
Jan-95 Dec-95 Dec-96 Nov-97 Nov-98 Oct-99 Oct-00 Sep-01
Volatility Ratio
30-year yields from dates t–∆t to date t. Regression analysis often begins
with the following model of the behavior of these changes
4
:
(8.5)
Changes in the 30-year yield, called the independent variable, are used to
predict changes in the 20-year yield, called the dependent variable. The in-
tercept,
α
, and slope,
β
, need to be estimated from the data. The error
term,
ε
t
, reflects how much the actual 20-year yield change on a particular
day differs from the change predicted by the constants
α
and
β
and by the
change in the 30-year yield. The regression model assumes that the error,
on average, equals zero and that it is uncorrelated with changes in the in-
dependent variable.
In words, equation (8.5) says that changes in the 20-year yield are lin-
early related to changes in the 30-year yield. Assume, for example, that the
data give estimates of
α
=0 and
β
=1.06. If on a particular day ∆y
t
30
=3 basis
points, then the predicted change in the 20-year yield, written ∆y
ˆ
t
20
, is
(8.6)
If ∆y
t
20
=4 basis points, then the error that day, according to equation (8.5) is
(8.7)
The estimates of
α
and
β
are usually obtained by minimizing the sum
of the squares of the error terms over the observation period—that is, by
minimizing
(8.8)
This estimation criterion is also known as least squares.
∆ε
t
t
2
∑
εαβ
tt t
tt
yy
yy
=−−
≡−
=− =
∆∆
∆∆
20 30
20 20
4 3 18 82
ˆ
∆∆
ˆˆ
yy
tt
20 30
0 1 06 3 3 18
=+×
=+ ×=
αβ
∆∆yy
ttt
20 30
=+× +αβ ε
154 REGRESSION-BASED HEDGING
4
Sometimes the percentage changes in yields are used instead of changes. It is a sep-
arate empirical question to determine which specification better describes empirical
reality.
Figure 8.2 graphs the changes in the 20-year yield against changes in
the 30-year yield over the sample period mentioned in the previous section.
The data do for the most part fall along a line, supporting the empirical
model specified in equation (8.5).
Estimating the constants of the equation by least squares can be done
in many computer programs, statistical packages, and spreadsheets. A typ-
ical regression output for this application is summarized in Table 8.1. Ac-
cording to the table,
α
, the constant of the regression, is estimated at
.0007. It is typically the case in regressions of changes in yields on other
changes in yields that this constant is close to zero. In this case, for exam-
ple, the 20-year yield does not tend to drift consistently up or down when
the 30-year yield is not moving. This intuition is supported not only by the
very small estimate of
α
but by its t-statistic as well. The t-statistic mea-
sures the statistical significance of the estimated coefficient. With enough
data, a common rule of thumb regards a t-statistic less than two as indicat-
ing that the data cannot distinguish between the estimated coefficient and a
coefficient of zero. In this example, the estimate of .0007 is not statistically
distinguishable from zero.
According to Table 8.1 the estimated value of
β
is about 1.057, indi-
cating that this value should be used as the risk weight for computing the
quantity of 30-year bonds to hedge 20-year bonds. Applying equation
(8.3) with this risk weight calls for a sale of about $8.76 million face
One-Variable Regression-Based Hedging 155
FIGURE 8.2 20-Year Yield Changes versus 30-Year Yield Changes
-10
0
10
20
30
–15 –10 -5 0 5 10 15 20 25 30
30-Year Yield Change (bps)
20-Year Yield Change (bps)
amount of 30-year bonds to hedge a $10 million long face amount position
of 20-year bonds. The t-statistic of the risk weight is, not surprisingly,
vastly greater than 2: It would be inconceivable for changes in the 20-year
yield to be uncorrelated with changes in the 30-year yield.
The standard error of the regression equals the standard deviation
of the error terms. In this example, a standard error of .6973 means that
a one-standard-deviation error in the prediction of the change in 20-year
yields based on 30-year yields is about .7 basis points per day. At a 20-
year DV01 of .118428, the hedged $10 million face position in 20-year
bonds hedged would be subject to a daily one-standard-deviation profit
or loss of
(8.9)
This hedging risk is large relative to a market maker’s bid-ask spread.
If a market maker is able to collect a spread of .25 or even .5 basis
points, equation (8.9) shows that this spread can easily be wiped out by
the unpredictable behavior of 20-year yields relative to 30-year yields.
Like the conclusion about the volatility-weighted approach, the one-
variable regression hedge of a 20-year bond with a 30-year bond does
not seem adequate.
The “R-squared” of the regression is 98.25%. This means that
98.25% of the variance of changes in the 20-year yield can be explained by
changes in the 30-year yield. In the one-factor case, the R-squared is actu-
ally the square of the correlation between the two changes. Here, the corre-
lation between changes in the 20- and 30-year yields is
√
.9825
——–
=.9912.
.
.
$, , $,6973
118428
100
10 000 000 8 258×× =
156 REGRESSION-BASED HEDGING
TABLE 8.1 Regression Analysis of Changes in
20-Year Yields on 30-Year Yields
Number of observations 1,680
R-squared 98.25%
Standard error 0.6973
Regression Coefficients Value t-Statistic
Constant 0.0007 0.0438
Change in 30-year yield 1.0570 306.9951
Some additional insight into regression hedging can be gained by fo-
cusing on the following fact about the regression-based risk weight:
(8.10)
The symbols
σ
20
and
σ
30
denote the volatilities of the dependent and inde-
pendent variables, respectively, and
ρ
denotes the correlation between
them. In the case of the 20- and 30-year yields, the previous section re-
ported that
σ
20
=5.27 and
σ
30
=4.94. The R-squared of the regression gives
ρ
=.9912. Substituting these values into equation (8.10) produces
β
=1.057
as reported in Table 8.1.
According to equation (8.10), the higher the volatility ratio of 20-year
yield changes to 30-year yield changes, the larger the 30-year risk weight.
(A similar result is discussed in the previous section.) Also, the larger the
correlation between the yield changes, the larger the 30-year risk weight.
Intuitively, the greater this correlation, the greater the usefulness of the 30-
year bond in hedging the 20-year bond. At the opposite extreme, for exam-
ple, when
ρ
=0, the 30-year bond is not helpful at all in hedging the 20-year
bond. In that (unlikely) case, the regression-based risk weight is zero for
any volatility ratio.
Equation (8.10) also reveals the difference between the volatility-
weighted hedge and the regression-based hedge. The risk weight of the for-
mer equals the ratio of volatilities while the risk weight of the latter is the
correlation times this ratio. In this sense, a volatility-weighted hedge as-
sumes that changes in the two bond yields are perfectly correlated (i.e.,
that
ρ
=1.0), while the regression approach recognizes the imperfect corre-
lation between changes in the two yields.
This section concludes by revisiting least squares as a criterion for esti-
mating equation (8.5). Since
β
is used as the risk weight on the 30-year bond,
(8.11)
Substituting this expression into the error term of the regression, given
in the first line of (8.7),
(8.12)
εα
tt t
y
FDV
FDV
y=−+∆∆
20
30 30
20 20
30
01
01
β=
−F
F
30 30
20 20
DV01
DV01
β
ρσ
σ
=
20
30
One-Variable Regression-Based Hedging 157
Rearranging terms and dropping
α
, since it is usually quite small,
(8.13)
The term in brackets is the P&L of a short position in 20-year bonds
hedged with a long position in 30-year bonds, so
ε
t
equals this P&L per
unit of risk in 20-year bonds. Similarly, the standard deviation and vari-
ance of
ε
t
equals the standard deviation and variance of this P&L per unit
of risk in 20-year bonds. Since, in this context, minimizing the sum of the
squared errors is equivalent to minimizing the variance or standard devia-
tion of the errors,
5
the least squares criterion is equivalent to minimizing
the standard deviation of the P&L of a regression-based hedged position.
TWO-VARIABLE REGRESSION-BASED HEDGING
The change in the 20-year yield is probably better predicted by changes in
both 10- and 30-year yields than by changes in 30-year yields alone. Con-
sequently, a market maker hedging a long position in 20-year bonds may
very well consider selling a combination of 10- and 30-year bonds rather
than 30-year bonds alone. Appropriate risk weights for the 10- and 30-
year bonds may be found by estimating the following regression model:
(8.14)
The coefficients
β
10
and
β
30
give the risk weights of the two-variable re-
gression hedge. More precisely, the face amount of the 10-year and 30-year
bonds used to hedge a particular face amount of 20-year bonds is deter-
mined by the following equations:
(8.15)
β
10
10 10
20 20
=
−F
F
DV01
DV01
∆∆∆yyy
tttt
20
10
10
30
30
=+ × + × +αβ β ε
ε
ttt
F
FyFy=+
[]
1
20 20
20 20
20
30 30
30
DV01
DV01 DV01∆∆
158 REGRESSION-BASED HEDGING
5
When a constant is included in the regression equation, it is a property of least
squares that the average error equals zero.
and
(8.16)
Once again, these regression coefficients are called risk weights be-
cause they give the DV01 risk in each hedging bond as a fraction of the
DV01 of the security or portfolio being hedged. To understand why this
hedge works, note that the P&L of the hedged position is
(8.17)
Rearranging slightly and using equations (8.15) and (8.16),
(8.18)
But, according to the regression model (8.14), the term in brackets, on av-
erage, equals –
α
. Usually
α
is approximately equal to zero, but, in any
case, according to the regression model, the term in brackets does not de-
pend on changes in yields. In other words, so long as the regression model
may be relied on to describe changes in yields, the hedge described by
equations (8.15) and (8.16) does create a portfolio that is, on average, im-
mune to interest rate changes.
Table 8.2 gives the results of estimating the regression model in
(8.14). For the same reasons that double-old 30-year bonds are used in the
one-variable regression, double-old 10-year and double-old 30-year bonds
are used here. The value of the constant and its associated t-statistic show
that
α
may be taken as approximately equal to zero. The coefficients on
the 10- and 30-year yield changes indicate that about 16.1% of the DV01
of the 20-year holding should be offset with 10-year DV01, and about
87.7% should be offset with 30-year DV01. The t-statistics on both these
coefficients confirm that both risk weights are statistically distinguishable
from zero.
In the one-variable regression of the previous section the 30-year risk
weight is 1.057 or 105.7%. In the two-factor regression the risk weight on
the 30-year falls to 87.7% because some of the DV01 risk is transferred to
PLF y y y
ttt
& =+−
[]
20 20 10
10
30
30 20
DV01 ββ∆∆∆
PLFyFyFy
ttt
& =− − −
10 10
10
30 30
30
20 20
20
DV01 DV01 DV01∆∆∆
β
30
30 30
20 20
=
−F
F
DV01
DV01
Two-Variable Regression-Based Hedging 159
the 10-year. So long as changes in the 10-year yield are positively corre-
lated with changes in the 20-year yield, it is to be expected that the hedge
will allocate some risk to the 10-year. Since the 30-year had all the risk in
the one-variable case, it follows that the 30-year should lose some risk allo-
cation when the 10-year is added to the analysis.
In the one-variable case the risk weight of the 30-year is greater than
one because the correlation between the yields is quite close to one and be-
cause the volatility of the 20-year yield exceeds that of the 30-year. See
equation (8.10). In the two-variable case, since most of the hedging risk is
still allocated to the 30-year, the sum of the two risk weights still exceeds
one. If it had happened that the two-variable analysis gave a much higher
risk weight on the 10-year than on the 30-year, the sum of the two risk
weights might have been less than one. The correlation between each of the
independent variables and the dependent variable is quite close to one and
the volatility of changes in the 10-year yield in the sample, at about 5.9 ba-
sis points per day, is greater than the volatility of the 30-year yield in the
sample, at about 4.9 basis points per day.
While the regression results of Table 8.2 strongly support the inclusion
of a 10-year security in the hedge portfolio, the overall quality of the hedge
has not improved dramatically from the one-variable case. The R-squared
increased by only about .4%, and the standard error is still relatively high
at about .62 basis points.
This and the previous section presented the science of regression hedg-
ing. The following section shows that a proper hedging program requires
an understanding of the relevant markets in addition to the ability to run
and understand regression analysis.
160 REGRESSION-BASED HEDGING
TABLE 8.2 Regression Analysis of Changes in
20-Year Yields on 10- and 30-Year Yields
Number of observations 1,680
R-squared 98.63%
Standard error 0.6170
Regression Coefficients Value t-Statistic
Constant 0.0067 0.4441
Change in 10-year yield 0.1613 21.5978
Change in 30-year yield 0.8774 99.0826
TRADING CASE STUDY: The Pricing of the 20-Year U.S. Treasury Sector 161
TRADING CASE STUDY: The Pricing of the 20-Year
U.S. Treasury Sector
In September 2001 many market participants claimed that the 20-
year sector was cheap. These claims were backed up by a wide variety
of analyses and arguments. The one common thread across these
claims, however, was the recommendation that the purchase of 20-
year bonds should be hedged with a 10-year risk weight of over 40%
and a 30-year risk below 70%.
6
These weights differ qualitatively
from the regression-based weights derived in the previous section: ap-
proximately 16% for the 10-year and 88% for the 30-year.
For any given risk weights
β
10
and
β
30
, whether they derive from a
regression model or not, an index of the relative value of the 20-year
sector, I, may be defined as follows:
(8.19)
Equation (8.18) reveals that the change in I is proportional to the
P&L from a long position in the 20-year bond hedged with the given
risk weights. It follows that I is an index of the cumulative profit from
this hedged position. High values of I, with the 20-year yield low rel-
ative to 10- and 30-year yields, indicate that the 20-year bond is rela-
tively rich. Low values of I, with the 20-year yield high relative to the
others, indicate that the 20-year bond is relatively cheap.
Figure 8.3 graphs the index I over the sample period studied in
this chapter for the case of equal risk weights, that is,
β
10
=.5 and
β
30
=.5. While these weights do not necessarily match those suggested
by market participants who advocated buying the 20-year sector, they
do capture the common thread of having a much greater 10-year risk
weight and a much lower 30-year risk weight than the weights esti-
mated in the previous section.
According to the figure, the index fluctuated between approxi-
mately –.1 and –.24 from the beginning of the sample until August
Iy yy
ttt
=+−ββ
10
10
30
30 20
6
Several of the more sophisticated approaches included an additional risk
weight on bonds of shorter maturity (e.g., two- or five-year bonds).
162 REGRESSION-BASED HEDGING
1998. Then, Long Term Capital Management (LTCM) suffered its
losses, and, in the ensuing market action, many traders were forced to
liquidate basis positions in the futures market (see Chapter 20) by
covering short futures positions and selling longs in the 20-year sec-
tor. These forced sales of 20-year bonds cheapened the sector dramat-
ically, as shown in the figure. After that episode the sector fitfully
recovered and fell again. A dramatic recovery took place, however,
when in early 2000 the U.S. Treasury announced that it would begin
to buy back its bonds in this and nearby sectors to deal with the new
reality of budget surpluses. The market soon came to believe that this
buyback program would not, in the end, be sufficient to prop up val-
ues in the sector. Despite that disillusionment, the dramatic cheapening
of the 20-year sector starting in March 2000 is remarkable. Falling
from a value of about 0 at the height of buyback optimism to a value
of about –.43 at the end of the sample implies an enormous cheapen-
ing of 43 basis points.
When examining indexes of value it is often a good idea to deter-
mine whether a risk factor has been omitted. In other words, is there
FIGURE 8.3 Index of 20-Year Bonds versus 10- and 30-Year Bonds; Equal
Risk Weights
–0.50
–0.45
–0.40
–0.35
–0.30
–0.25
–0.20
–0.15
–0.10
–0.05
0.00
0.05
Jan-95 Dec-95 Dec-96 Nov-97 Nov-98 Oct-99 Oct-00 Sep-01
Index
LTCM
Buybacks
TRADING CASE STUDY: The Pricing of the 20-Year U.S. Treasury Sector 163
a variable other than the cheapness of the 20-year sector that can ex-
plain Figure 8.3? Figure 8.4 shows that there is.
Figure 8.4 superimposes the slope of the 10s–30s curve (i.e.,
y
30
t
– y
10
t
) on Figure 8.3. The explanatory power of the curve variable is
remarkable: Whenever the curve steepens the 20-year bond cheapens,
at least as measured by the index I. As might be expected, the magni-
tude of the curve change does not seem to explain the full magnitude
of the reaction of I to the idiosyncratic effects of the fall of LTCM or
of the buyback announcement. The magnitude of the curve change
does, however, seem to explain the magnitude of the apparent cheap-
ening of the 20-year bond from the height of buyback optimism to the
end of the sample period.
The evidence of Figure 8.4 does not necessarily mean that the
20-year sector is not cheap. It does strongly imply, however, that
whatever cheapness characterizes the 20-year sector is highly corre-
lated with the slope of the yield curve from 10 to 30 years. Put an-
other way, purchasing the allegedly cheap 20-year bond and selling
10- and 30-year bonds with equal risk weights will exhibit a P&L
FIGURE 8.4
Evenly Weighted 20-Year Index and 10s–30s Curve
–0.50
–0.45
–0.40
–0.35
–0.30
–0.25
–0.20
–0.15
–0.10
–0.05
0.00
0.05
Jan-95 Dec-95 Dec-96 Nov-97 Nov-98 Oct-99 Oct-00 Sep-01
Index
–60
–40
–20
0
20
40
60
80
100
120
Curve
Index Curve
164 REGRESSION-BASED HEDGING
profile similar to that of a simple curve trade that has nothing to do
with the 20-year bond, namely, selling 10-year bonds and buying 30-
year bonds. Both positions make money when the yield curve be-
tween 10 and 30 years flattens.
The regression hedge presented in the previous section does not
suffer from this problem. Define an index, I
˜
, based on the risk
weights from the two-variable regression. Specifically,
(8.20)
Figure 8.5 graphs this index over the sample period.
The LTCM dislocation and the buyback program are evident in
this figure as they were in Figures 8.3 and 8.4. However, unlike those
figures, Figure 8.5 shows an index that has not cheapened at all since
March 2000. It seems that the risk weights used to I
˜
construct ade-
quately hedge against curve risk.
It is no surprise that the regression methodology outlined in the
previous section does control for curve risk. The estimated regression
relationship can be written as a function of the change in the 10- and
30-year yields:
(8.21)
But this relationship can also be written as a function of the 10-year
yield and of the curve:
(8.22)
Equation (8.22) says that the 20-year yield will change by about 1.04
basis points for every basis point change in the 10-year with a fixed
curve. Also, the 20-year yield will change by about .88 basis points
∆∆∆∆yyyy
tttt
20 10 30 10
1 0387 8774≈+−
()
∆∆∆yyy
ttt
20 10 30
1613 8774≈+
˜
Iy yy=×+×−161 877
10 30 20
TRADING CASE STUDY: The Pricing of the 20-Year U.S. Treasury Sector 165
for every basis point change in the curve with a fixed 10-year yield. In
short, the regression-based hedge can be thought of as hedging
against changes in 10- and 30-year yields or as hedging against
changes in the level of yield and the curve.
To complete the discussion, Figure 8.6 tests the index I
˜
as Figure
8.4 tests the index I, namely by superimposing the curve on the index.
Figure 8.6 shows that, LTCM and buybacks aside, I
˜
is not very much
related to the curve. As a result, a trade based on I
˜
is a pure play on
the 20-year sector relative to the 10- and 30-year sectors. Unfortu-
nately for the trade’s prospects, however, the 20-year sector does not
appear particularly rich or cheap by recent historical experience as
measured by the index I
˜
.
FIGURE 8.5
Index of 20-Year Bonds versus 10- and 30-Year Bonds;
Regression Risk Weights
–0.10
–0.05
0.00
0.05
0.10
0.15
0.20
0.25
0.30
Jan-95 Dec-95 Dec-96 Nov-97 Nov-98 Oct-99 Oct-00 Sep-01
Index
LTCM
Buybacks