Additional Praise for Fixed Income Securities Tools for Today’s Markets, 2nd Edition phần 7 potx
Bạn đang xem bản rút gọn của tài liệu. Xem và tải ngay bản đầy đủ của tài liệu tại đây (683.02 KB, 52 trang )
that assume volatility follows a process of their own). A less convincing ex-
ample of the need to fit parameters might be a parameter of mean rever-
sion. First, since it would be hard to find an economic rationale for
frequent changes to this parameter, changes to this parameter might be
covering up serious model deficiencies. Second, since mean reversion para-
meters are so intimately connected with term structure movements, it is not
clear why changing a mean reversion parameter frequently is better than
adding another factor. Adding another factor has the advantage of internal
consistency, and changes in that factor are probably easier to interpret than
changes in a mean reversion coefficient.
While some argument can probably be advanced for fitting any para-
meter, the cumulative effect of fitting many parameters makes a model dif-
ficult to use. Hedging a portfolio becomes much more complicated as
changes to many parameters have to be hedged at the same time. P&L at-
tribution also becomes more complicated as there is an additional term for
each parameter. These complexity issues grow particularly fast with time-
dependent parameters. A user who feels that the problem at hand demands
the flexibility of fitting many parameters might be advised to switch to one
of the multi-factor approaches mentioned in Chapter 13 rather than trying
to force multi-factor behavior onto a low-dimensional model.
HEDGING TO THE MODEL VERSUS HEDGING
TO THE MARKET
As mentioned several times in this chapter, when using a term structure
model one can calculate factor exposures either at model values (i.e., at
an OAS of zero), or at market values (i.e., at the prevailing OAS). As
usual, the choice depends on the application at hand and is explored in
this section.
The important issues can be easily explained with the following very
simple example. Consider two zero coupon bonds maturing in 10 years
that are identical in every respect but trade separately. Furthermore, as-
sume that for some reason, presumably temporary, one bond yields 5%
while the other yields 5.10%. To take advantage of this obvious mispricing
a trader decides to buy the bond yielding 5.10% and sell the bond yielding
5%. What hedge ratio should be used?
The model hedge ratio is equal face amounts. The two securities are
identical, and, therefore, their model prices respond to any change in the
Hedging to the Model versus Hedging to the Market 297
environment in the same way. An arbitrage argument is equivalent. Buy-
ing the zero yielding 5.10% and selling an equal face amount of the zero
yielding 5% will generate cash today without generating any future cash
payments. A third equivalent argument is to find the face amounts that set
the portfolio DV01 to zero, calculating DV01 at the model yield. What-
ever the model yield is, it is the same for both securities. Therefore, the
two DV01 values are the same and the hedged portfolio consists of equal
face amounts.
The market hedge ratio sets the portfolio DV01 to zero, with calcula-
tions at market yields. Using equation (6.23), the DV01 values of the two
bonds are
(14.23)
and
(14.24)
Consequently, the market hedge is to sell .058932/.059539 or .9898 of the
bonds yielding 5% against the purchase of every unit of bond yielding
5.10%.
If an investor or trader plans to hold the zeros until they sell at the
same yield or until they mature, the model hedge ratio is best. This
hedge ratio guarantees that at the horizon of the trade the P&L will be
independent of the level of interest rates. In fact, at the horizon of the
trade the positions cancel and there is no cash flow at all. By contrast,
the P&L of the market hedge depends on the interest rate at the horizon.
If, for example, both yields suddenly equalize at 6%, the price of both
zeros is 55.3676 and the liquidation of the position generates
(1–.9898)×55.3676 or .5648. But if yields suddenly equalize at 4%, the
price of both zeros is 67.2971 and the liquidation of the position gener-
ates (1–.9898)×67.2971 or .6864.
A market maker, on the other hand, might not plan to hold the zeros
for very long. The trade has no risk if held to maturity, but many market
makers cannot hold a trade for that long. Furthermore, at times before ma-
turity the trade might very well lose money, as the spread between the yield
could increase well beyond the original 10 basis points. For this trader the
10
100 1 051 2
058932
21
+
()
=
.
.
10
100 1 05 2
059539
21
+
()
=
.
.
298 TRADING WITH TERM STRUCTURE MODELS
market hedge might be best. If both yields rise or fall by the same number
of basis points, the P&L is, by construction, zero. With the model hedge, if
both yields fall by the same amount the trade records a loss: The DV01 of
the short position is greater than the DV01 of the long position. For 100
face of each, for example, a sudden (admittedly unrealistic) fall of 100 ba-
sis points would result in a loss of 6.4 cents:
(14.25)
In summary, hedging to the model ensures that P&L at convergence or
at maturity is independent of rates but exposes the position to P&L fluctu-
ations before then. Hedging to the market immunizes P&L to market
moves without any convergence but exposes the position to P&L variance
if there is any convergence. In the context of relative value trades, like the
butterfly analyzed in the case study, the point of the trade is to hold until
convergence. Therefore, as assumed in the case, the trade should be hedged
to model.
This discussion suggests yet another possibility for hedging, some-
where between the market and model hedges. Say that a trader decides to
put on a trade and hold it until the OAS falls to 5 basis points. In that case
the P&L can be immunized against rate changes by hedging using deriva-
tives that assume an OAS of 5 basis points. This reasoning is particularly
appropriate for securities, like mortgages, that tend to trade cheap relative
to most model specifications.
100
1 041 2
100
1 051 2
100
1042
100
1052
064
20 20 20 20
+
()
−
+
()
−
+
()
−
+
()
=−
.
Hedging to the Model versus Hedging to the Market 299
PART
FOUR
Selected Securities
303
CHAPTER
15
Repo
REPURCHASE AGREEMENTS AND
CASH MANAGEMENT
Suppose that a corporation has accumulated cash to spend on constructing
a new facility. While not wanting to leave the cash in a non-interest-bear-
ing account, the corporation would also not want to risk these earmarked
funds on an investment that might turn out poorly. Balancing the goals of
revenue and safety, the corporation may very well decide to extend a short-
term loan and simultaneously take collateral to protect its cash. Holding
collateral makes it less important to keep up-to-the-minute information on
the creditworthiness of the borrower. If the borrower does fail to repay the
loan, the corporation can sell the collateral and keep the proceeds.
Municipalities are another example of entities with cash to lend for
short terms. A municipality collects taxes a few times a year but pays
money out over the whole year. Tax revenues cannot, of course, be in-
vested in risky securities, but the cash collected should not lie idle, either.
Short-term loans backed by collateral again satisfy both revenue and
safety considerations.
Repurchase agreements, or repos, allow entities to effect this type of
loan. Say that a corporation has $100 million to invest. In an overnight re-
purchase agreement the corporation would purchase $100 million worth
of securities from the borrower and agree to sell them back the next day
for a higher price. If the repo rate were 5.45%, the agreement would spec-
ify a repurchase price of
(15.1)
$,,
.
$,,100 000 000 1
0545
360
100 015 139×+
=
Since the corporation pays $100 million on one day and receives that sum
plus another $15,139 the next day, the corporation has effectively made a
loan at an actual/360 rate of 5.45%.
If the corporation were willing to commit the funds for a week, it
might enter into a term repurchase agreement in which it would agree to
repurchase the securities after seven days. In that case, if the seven-day rate
were also 5.45%, the repurchase price would be
(15.2)
Once again, the corporation has effectively made a loan at 5.45%, this
time for seven days, collecting interest of $105,972.
The legal status of a repurchase agreement has not been definitively
settled as a securities trade or as collateralized borrowing. Were repo de-
clared to be collateralized borrowing, the right to sell a borrower’s collat-
eral immediately in the event of a default might be restricted in order to
protect the borrower’s other creditors.
1
It is for this reason that partici-
pants in the repo market are usually careful to avoid the terms borrowing
or lending. This chapter, however, neglects the legal treatment of repur-
chase agreements in the event of insolvency and does not differentiate be-
tween a repurchase agreement and a secured loan.
Before concluding this section, the discussion focuses on repo collat-
eral. First, because the typical lender of cash in the repo market values
safety highly, only securities of great creditworthiness and liquidity are ac-
cepted as collateral. The most common choices are U.S. Treasury securi-
ties and, more recently, mortgages guaranteed by the U.S. government.
Second, even holding U.S. Treasuries as collateral, a lender faces the risk
that the borrower defaults at the same time U.S. Treasury prices decline in
value. In that eventuality, selling the collateral might not fully cover the
loss of the loan amount. Therefore, repo agreements include haircuts re-
quiring the borrower of cash to deliver securities worth more than the
amount of the loan. Furthermore, repo agreements often include repricing
provisions requiring the borrower of cash to supply extra collateral in de-
clining markets and allowing the borrower of cash to withdraw collateral
$,,
.
$,,100 000 000 1
7 0545
360
100 105 972×+
×
=
304 REPO
1
See Stigum (1989).
in advancing markets. For simplicity, this chapter ignores haircuts and
repricing provisions.
REPURCHASE AGREEMENTS AND FINANCING
LONG POSITIONS
The previous section describes typical lenders of cash in the repo market;
This section describes the typical borrowers of cash, namely, financial insti-
tutions in the business of making markets in U.S. government securities.
Say that a mutual fund client wants to sell $100 million face amount of the
U.S. Treasury’s 5
7
/
8
s of November 15, 2005, to a trading desk. The trading
desk will buy the bonds and eventually sell them to another client. Until
that other buyer is found, however, the trading desk needs to raise money
to pay the mutual fund. Rather than draw on the scarce capital of its finan-
cial institution for this purpose, the trading desk will repo or repo out the
securities, or sell the repo. This means it will borrow the purchase amount
from someone, like the corporation described in the previous section, and
use the 5
7
/
8
s of November 15, 2005, that it just bought as collateral. As-
sume for now that the repo rate for this transaction is 5.10%. (A later sec-
tion discusses the determination of repo rates.)
To be more precise, assume that the trade just described takes place on
February 14, 2001, for settle on February 15, 2001. The bid price of the 5
7
/
8
s
of November 15, 2005, is 103-18, and the accrued interest is 1.493094.
2
Hence, the amount due the mutual fund on February 15, 2001, is
(15.3)
The trading desk will borrow this amount
3
from the corporation on Febru-
ary 15, 2001, overnight (i.e., for one day) at the market repo rate of 5.10%.
On the same day, the desk will deliver the $100 million face amount of the
bonds as collateral. Figure 15.1 charts these cash and repo trades.
$,, . %$,,100 000 000 103
18
32
1 493094 105 055 594×++
=
Repurchase Agreements and Financing Long Positions 305
2
In a coupon period of 181 days, 92 days have passed.
3
In this simple example, the corporation is willing to lend exactly the amount re-
quired by the trading desk. In reality, a financial institution’s repo desk will make
sure that the institution as a whole has borrowed the right amount of money to fi-
nance its security holdings.
On February 16, 2001, when the repo matures, the desk will owe the
corporation the principal of the loan, $105,055,594, plus interest of
(15.4)
After making this total payment of $105,070,477, the desk will take back
the 5
7
/
8
s it had used as collateral. Put another way, the cost of financing the
overnight position in the bonds is $14,883.
Suppose that on February 16, 2001, another client, a pension fund, de-
cides to buy the 5
7
/
8
s. To keep the example relatively simple, assume that
the bid price of the 5
7
/
8
s is still 103-18. Assume that the bid-ask spread for
these bonds is one tick so that the asking price is 103-19. Finally, note that
the accrued interest has increased by one day of interest to 1.509323. The
trading desk will then unwind its position as follows.
$,,
.
$,105 055 594
051
360
14 883×=
306 REPO
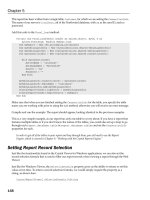
FIGURE 15.1 A Trading Desk Selling the Repo to Finance a Customer Bond Sale
$100mm face of
5.875s of 11/15/2005
Mutual Fund
Trading Desk
Corporation
$105,055,594
$100mm face of
5.875s of 11/15/2005
$105,055,594
For $100 million of the 5
7
/
8
s the pension fund will pay
(15.5)
The desk will use $105,070,477 of these proceeds to pay off its debt to
the corporation, take back the $100 million face of the 5
7
/
8
s it had used
as collateral, and deliver these bonds to the pension fund. Figure 15.2
charts this sequence of trades. Note that the trading desk makes $32,596
on these trades, the difference between the proceeds from the sale to the
pension fund ($105,103,073) and the loan repayment to the corporation
($105,070,477). The sources of this profit are examined in the section
on carry.
If a client does not emerge to purchase the $100 million bonds, the
trading desk will have to finance its position again. In other words, the
$,, . %$,,100 000 000 103
19
32
1 509323 105 103 073×++
=
Repurchase Agreements and Financing Long Positions 307
FIGURE 15.2 A Trading Desk Unwinding the Trade of Figure 15.1
$100mm face of
5.875s of 11/15/2005
Pension Fund
Trading Desk
Corporation
$105,103,073
$100mm face of
5.875s of 11/15/2005
$
105
,
070
,
477
desk will have to sell the repo again. It might simply extend the term of the
original agreement with the corporation or sell the repo to another repo
player, like a municipality.
REVERSE REPURCHASE AGREEMENTS AND
SHORT POSITIONS
Rather than wanting to sell the 5
7
/
8
s of November 15, 2005, as in the pre-
vious section, assume that the mutual fund wants to buy the bonds from a
trading desk. Also assume that the trading desk doesn’t happen to have
that bond in inventory. The trading desk may very well sell the bonds any-
way (i.e., go short the bonds), planning to buy them from another client at
a later time. When the trade settles and the mutual fund pays for the
bonds, the trading desk is obliged to deliver the 5
7
/
8
s. But since the desk
never had the 5
7
/
8
s in the first place, it will have to borrow them from
somewhere. The usual solution is to do a reverse repurchase agreement, to
reverse or reverse in the securities, or to buy the repo. The trading desk
finds some party that owns the 5
7
/
8
s, perhaps another investment bank;
lends that bank the cash received from the mutual fund; takes the 5
7
/
8
s as
collateral; and, finally, delivers that collateral to the mutual fund.
To be more precise, assume again that the trade takes place on Febru-
ary 14, 2001, for settlement on February 15, 2001, and that prices and
bid-ask spreads are as assumed in the previous section. The mutual fund
buys $100 million face amount of the bonds for
(15.6)
On the settlement date, the trading desk receives this from the mutual
fund; lends it to the other investment bank;
4
takes $100 million face
amount of the 5
7
/
8
s as collateral; and delivers that collateral to the mutual
fund. Figure 15.3 charts this transaction.
$,, . %$,,100 000 000 103
19
32
1 493094 105 086 844×++
=
308 REPO
4
Since this section ignores haircuts and other transaction costs, the text is not care-
ful about the exact amount borrowed or lent against a fixed amount of collateral.
For example, the text is inconsistent about whether the bid or ask price is used in
determining the loan amount because the haircut arrangement will have a large im-
pact on this determination.
Note that there is no difference between a reverse repurchase agree-
ment from the point of view of the trading desk and a repurchase agree-
ment from the point of view of the other investment bank. Nevertheless,
the term reverse repo is useful to emphasize that the lender of cash is moti-
vated by the need to borrow particular bonds.
Suppose that on February 15, 2001, a pension fund wants to sell $100
million face amount of the 5
7
/
8
s to the trading desk at the bid price of 103-
18 and accrued interest of 1.509323 for total proceeds of $105,071,823.
Upon settlement the next day, the trading desk pays this amount to the
pension fund; takes delivery of the bonds; and hands over the bonds to the
other investment bank in exchange for the loan repayment of
(15.7)
$,,
.
$,,105 086 844 1
0510
360
105 101 731×+
=
Reverse Repurchase Agreements and Short Positions 309
FIGURE 15.3 A Trading Desk Buying the Repo to Short a Bond to a Customer
$100mm face of
5.875s of 11/15/2005
Mutual Fund
Trading Desk
Investment Bank
$105,086,844
$100mm face of
5.875s of 11/15/2005
$105,086,844
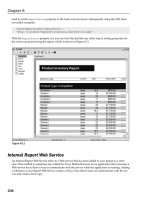
Figure 15.4 illustrates this unwinding of the original cash and reverse repo
trade. Note that the trading desk made $29,908 in this trade: It collected
$105,101,731 from the investment bank and paid $105,071,823 to the
pension fund. The next section discusses why the desk made less in this
trade than in the trade of the previous section.
The purchase and delivery of securities that had been sold and bor-
rowed is called covering a short. Had the trading desk not found a client
on February 15, 2001, wishing to sell the bonds, the desk would have had
to roll its short position. The desk can roll its short either by extending its
repo with the other investment bank or by finding another entity, like a
commercial bank, willing to lend the 5
7
/
8
s.
While this and the previous section describe how trading desks may
find themselves both borrowing and lending cash in the repo market, on
average across the money market, brokers and dealers are net borrowers of
cash to finance their inventories.
310 REPO
FIGURE 15.4 A Trading Desk Unwinding the Trade of Figure 15.3
$100mm face of
5.875s of 11/15/2005
Pension Fund
Trading Desk
Investment Bank
$105,071,823
$100mm face of
5.875s of 11/15/2005
$105,101,731
CARRY
Practitioners like to divide the profit or loss of a trade into a component
due to price changes and a component due to carry. Carry is defined as the
interest earned on a position minus the cost of financing the position. To be
more precise, define the following variables:
P(0),P(d): Flat prices per dollar principal on the trade date and d days
later
AI(0),AI(d): Accrued interest on the trade date and d days later
r: Repo rate
c: Coupon rate
D: Actual days between last and next coupon payments
Then, the P&L from purchasing the bond and selling it d days later is
(15.8)
To illustrate, return to the trade described in Figures 15.1 and 15.2.
The P&L from the trade may be broken down as follows. The market for
the bond did not change over the day, but because of the bid-ask spread the
price change contribution to P&L is
(15.9)
The interest income from the position over the day is
(15.10)
Finally, the cost of financing the position is given in equation (15.4) as
$14,883. Hence, the carry is $16,229–$14,883 or $1,346, and the total
profit is $31,250+$1,346 or $32,596.
$,, . . %$,100 000 000 1 509323 1 493094 16 229−
()
=
$,, %$,100 000 000 1 32 31 250×
()
=
P&L
Price change Interest income Financing cost
Price change Carry
=
()
+
()
−
()
+
()
()
+
()
=
()
−
()
+
()
−
()
−
()
+
()
()
()
=
()
−
()
+−
()
+
()
()
()
=+ −
=+
P d AI d P AI rd
PdPAIdAI PAIrd
Pd P cd D P AI rd
0 0 1 360
0 0 0 0 360
0 0 0 360
Carry 311
Intuitively, the carry in this trade is positive because the coupon rate of
the bond, 5.875%, is greater than the repo rate, 5.10%. The difference be-
tween the two rates is not perfectly indicative of carry, however, as can be
seen from the third equation line of (15.8). First, interest income is earned
on the face value, while the repo rate is applied to the full price. Second, in-
terest income is calculated using an actual/actual day count, while repo in-
terest is calculated using a 30/360 day count.
The trade just described makes more money for the desk than the
trade described in Figures 15.3 and 15.4 because carry hurts the latter
trade. In that trade, since the desk shorts the bond, it pays the coupon
rate and receives the repo rate. The breakdown of the P&L is the
$31,250 from the bid-ask spread minus a carry of $1,342 for a total
profit of $29,908.
Carry is particularly useful for computing breakeven price changes.
For example, an investor might plan to purchase the 5
7
/
8
s of November
15, 2005, for an invoice price of 105.103073 and hold them for 30 days.
If the 30-day term rate for financing the bonds is 5.10%, how big a price
decline can occur before the investment shows a loss? Since the relevant
coupon period has 181 days, the accrued interest per $100 million face
amount is
(15.11)
and the financing cost is
(15.12)
for a carry of $40,190. Therefore, so long as the price of the bond does not
fall by more than about 4 cents per 100 face value over the 30-day period,
the investment will prove profitable.
Similarly, carry is useful for calculating breakeven holding periods. For
example, a trader might plan to short the 5
7
/
8
s of November 15, 2005, at
an invoice price of 105.055594 in the expectation that the price will even-
tually fall to 105. If the financing rate is certain to stay at 5.10%, how
quickly does the price have to fall to 105 before the trade loses money? To
answer this question, assume that the answer is d days. Then the carry of
the position, which will be negative, is
$,, . %.% $,100 000 000 105 103073 5 10 446 688
30
360
×××=
$,, % $,100 000 000 5 486 878
1
2
7
8
30
181
×× × =
312 REPO
(15.13)
If the price does fall to 105, the price change component of the profit from
the short position will be
(15.14)
The negative carry will just offset this profit if
(15.15)
that is, if d is about 41 days. If the target price is realized before 41 days
have elapsed the trade makes money. If the target price is realized after 41
days, then, despite the correct prediction that the price would fall to 105,
the trade loses money.
Positive carry trades have the desirable property that they earn money
as they go. But this by no means implies that the expected return of a posi-
tive carry trade is greater than that of a negative carry trade. Consider the
choice between investing in a premium bond or in a discount bond where
the repo rate for both is between the coupon rates. The premium bond of-
fers positive carry, but its price will be pulled down toward par. The dis-
count bond suffers from negative carry, but its price will be pulled up
toward par. Clearly, carry considerations alone are not sufficient to deter-
mine which bond earns the higher expected return nor which furnishes the
better return per unit of risk borne. In the examples of this chapter, the
trading desk made more money on its positive carry trade, Figures 15.1
and 15.2, than on its negative carry trade, Figures 15.3 and 15.4, because
of the arbitrary assumption that the bond price did not change from one
day to the next. A more complete analysis would be required to reveal the
full risk and return characteristics of each trade.
Viewing carry from a theoretical standpoint, Part Three showed that
the expected return of any fairly priced portfolio equals the short-term rate
plus an appropriate risk premium. This required expected return is the
same whether it comes in the form of positive carry and a relatively small
or negative expected price change or in the form of negative carry and a
relatively large expected price change.
−×××+××=−$,, % $,, .% $,100 000 000 5 105 055 594 5 10 55 594
1
2
7
8 181 360
dd
$,, . %$,100 000 000 105 055594 105 55 594×−
()
=
−×××+××$,, % $,, .%100 000 000 5 105 055 594 5 10
1
2
7
8 181 360
dd
Carry 313
GENERAL COLLATERAL AND SPECIALS
Investors using the repo market to earn interest on cash balances with the
security of U.S. Treasury collateral do not usually care about which partic-
ular Treasury securities they take as collateral. These investors are said to
accept general collateral (GC). Other participants in the market, however,
do care about the specific issues used as collateral. Commercial and invest-
ment banks engaging in repurchase agreements to finance particular secu-
rity holdings have to deliver those particular securities as collateral. Also,
trading operations that are short particular securities need to take those
particular securities as collateral. These parties require special collateral.
The collection of these needs and interests constitutes supply and de-
mand for general collateral and for individual issues. The repo market
equilibrates the supply and demand for general collateral to emerge with a
GC interest rate for repurchase agreements in which the lender of cash will
accept any Treasury security as collateral. The repo market also equili-
brates the supply and demand for individual securities or specials to
emerge with a set of special rates for repurchase agreements in which the
lender of cash must take particular Treasury securities as collateral. Table
15.1 lists the GC rate and a set of special rates for repurchase agreements
settling on February 15, 2001.
5
The general collateral rate on February 15, 2001, was 5.44%, 6 basis
points below the fed funds target rate
6
of 5.50%. The GC rate is typically
below the fed funds target rate because loans through repurchase agree-
ment are effectively secured by collateral, while loans in the fed funds mar-
ket are not. The spread between the fed funds target rate and the GC rate
varies with the supply and demand for U.S. Treasury collateral.
Typically, and as shown in Table 15.1, the most recently issued Trea-
314 REPO
5
Purchases and sales of the 5s of February 15, 2011, did not settle until February
15, 2001. Therefore, there is no overnight repo for these bonds from February 14,
2001, to February 15, 2001, and these bonds are not included in Table 15.1. Start-
ing from the next day, however, this bond issue did trade in the overnight repo mar-
ket as the new 10-year bond. The same is true for the 5.375s of February 15, 2031,
the new 30-year settling on February 15, 2001.
6
The fed funds rate is the rate at which banks lend money to one another. The Fed-
eral Reserve sets a fed funds target rate and keeps the fed funds rate close to that
target. See Chapter 17.
sury securities trade special in the repo market. On-the-run (OTR) refers to
the most recently issued security of a particular maturity, old refers to the
next most recent, and double-old to the issue before that. That these issues
typically trade special indicates that there is usually a strong demand to
short these issues and, therefore, a need to borrow them through the repo
market. Someone taking the OTR five-year as collateral is willing to lend
money overnight at 3.85%, 159 basis points below the GC rate, in order to
cover or initiate a short sale. (No investor without a particular interest in
the OTR five-year would take it as collateral and earn 3.85% instead of
taking general collateral and earning 5.44%.) Conversely, the owner of the
OTR five-year enjoys the advantage of borrowing money at 159 basis
points below GC by lending this bond. The next section discusses current
issues and their special rates in more detail.
Some issues trade special because they are close substitutes for on-the-
run issues. The 6.50s of May 15, 2005, and the 5.875s of November 15,
2005, mature on the same day as the old five-year and the OTR five-year,
General Collateral and Specials 315
TABLE 15.1 Selected Repo Rates for Settlement on February 15,
2001
General collateral rate: 5.440%
Treasury Issue
Special
Coupon Maturity Comment Repo Rate
6.000% 07/31/02 5.150%
5.750% 10/31/02 5.200%
5.625% 11/30/02 Double-old 2-year 5.350%
5.125% 12/31/02 Old 2-year 4.750%
4.750% 01/31/03 On-the-run 2-year 4.880%
5.500% 02/28/03 5.150%
6.500% 05/15/05 5.200%
6.750% 05/15/05 Old 5-year 5.350%
6.500% 08/15/05 5.200%
5.750% 11/15/05 On-the-run 5-year 3.850%
5.875% 11/15/05 5.100%
5.625% 02/15/06 5.300%
6.500% 02/15/10 Old 10-year 5.350%
5.750% 08/15/10 On-the-run 10-year 4.250%
6.125% 08/15/29 Old 30-year 5.350%
6.250% 05/15/30 On-the-run 30-year 5.350%
respectively. These issues trade somewhat special because some traders
short these issues instead of the most recent issues. The extent to which
special repo rates are below GC is entirely a question of supply and de-
mand for collateral of specific issues. For example, the 6.50s of May 15,
2005, trade 15 basis points more special than the old five-year, while the
5.875s of November 15, 2005, trade 125 basis points less special than the
OTR five-year.
Other issues trade special for reasons not apparent without under-
standing who owns and who has shorted particular issues. Arbitrage
traders deciding that a particular sector of the Treasury market is rich rela-
tive to swaps
7
might form a large short base (i.e., a constituency that shorts
a particular bond or set of bonds) in that sector and cause the issues in that
sector to trade special. A large sale of a particular security from the dealer
community to an investor that does not participate in the repo market
might suddenly make it difficult for shorts to borrow that security and,
therefore, might cause that security to trade special.
While not shown in Table 15.1, there is also a market for term GC
and special rates. This market allows borrowers and lenders of cash to
lock in a fixed rate over longer time periods, though typically less than a
few months. With respect to GC, the term market allows participants to
avoid overnight interest rate risk and the risk arising from changes in the
supply and demand for U.S. Treasury collateral. The term market for spe-
cials also allows participants to avoid these risks and, in addition, to re-
duce risks arising from the fluctuating supply and demand of collateral in
particular securities.
SPECIAL REPO RATES AND THE AUCTION CYCLE
Current issues tend to be more liquid. This means that their bid-ask spreads
are particularly low and that trades of large size can be conducted rela-
tively quickly. This phenomenon is partly self-fulfilling. Since everyone ex-
pects a recent issue to be liquid, investors and traders who demand
liquidity and who trade frequently flock to that issue and thus endow it
with the anticipated liquidity. Also, the dealer community, which trades as
316 REPO
7
See Chapter 18.
part of its business, tends to own a lot of a new issue until it seasons and is
distributed to buy-and-hold investors.
The extra liquidity of newly issued Treasuries makes them ideal candi-
dates not only for long positions but for short positions as well. Most
shorts in Treasuries are for relatively brief holding periods: a trading desk
hedging the interest rate risk of its current position, a corporation or its un-
derwriter hedging an upcoming sale of its own bonds, or an investor bet-
ting that interest rates will rise. All else being equal, holders of these
relatively brief short positions prefer to sell particularly liquid Treasuries
so that, when necessary, they can cover their short positions quickly and at
relatively low transaction costs.
Investors and traders long an on-the-run security for liquidity reasons
require compensation to sacrifice liquidity by lending those securities in the
repo market. At the same time, investors and traders wanting to short the
on-the-run securities are willing to pay for the liquidity of shorting these
securities when borrowing them in the repo market. As a result, the on-the-
run securities tend to trade special in the repo market.
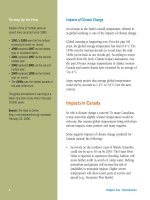
Figures 15.5, 15.6, and 15.7 graph the special spread of the five-, 10-,
and 30-year on-the-run security over time. This special spread is defined as
the overnight general collateral rate minus the overnight special rate of the
then on-the-run security. The vertical lines indicate Treasury auctions in
that maturity. These are either auctions of new on-the-run securities, in
which case the on-the-run security changes over the vertical line, or re-
openings of existing on-the-run securities (i.e., auctions that increase the
size of an already existing issue), in which case the same security is featured
on both sides of the vertical line.
Special Repo Rates and the Auction Cycle 317
FIGURE 15.5 Special Spreads for the On-the-Run Five-Year
0
100
200
300
400
500
600
8/15/1998 8/15/1999 8/14/2000 8/14/2001
Spread (bps)
Several lessons may be drawn from these graphs. First, the special
spreads are quite volatile on a daily basis, reflecting supply and demand for
special collateral on that day. Second, special spreads can be quite large:
Spreads of 200 to 400 basis points are quite common.
Third, while the cycle of on-the-run special spreads is far from regular,
these spreads tend to be small immediately after auctions and to peak be-
fore auctions. It takes some time for a short base to develop. Immediately
after an auction of a new on-the-run security, shorts can stay in the previ-
ous on-the-run security or shift to the new on-the-run. This substitutability
tends to depress special spreads. Also, immediately after a reopening auc-
tion the extra supply of the on-the-run security tends to depress special
spreads. In fact, a more careful examination of data on special spreads in-
dicates that special spreads for reopened issues do not get as wide as spe-
cial spreads of new issues. In any case, as time passes after an auction,
318 REPO
FIGURE 15.6 Special Spreads for the On-the-Run 10-Year
0
100
200
300
400
500
600
8/15/1998 8/15/1999 8/14/2000 8/14/2001
Spread (bps)
FIGURE 15.7 Special Spreads for the On-the-Run 30-Year
0
100
200
300
400
500
600
8/15/1998 8/15/1999 8/14/2000 8/14/2001
Spread (bps)
shorts tend to migrate toward the on-the-run security and its special spread
tends to rise.
Fourth, the OTR 30-year seems to have stopped trading special in the
repo market. This process began as government surpluses made it seem
likely that the Treasury would eventually cancel the issuance of new 30-
year bonds. The market anticipated that as a result the sector as a whole
would become less liquid, and, perhaps in a self-fulfilling manner, so it did.
Interest in shorting the 30-year fell concurrently with this fall in liquidity,
and special spreads shrank. To finish the story, in the fall of 2001, despite
the possible disappearance of government surpluses, the Treasury did can-
cel the sale of new 30-year bonds.
By graphing special spreads rather than rates, Figures 15.5 through
15.7 do hide one factor that limits special spreads. Consider a trader who
is short the OTR 10-year and needs to borrow it through a repurchase
agreement. If for some reason the bond cannot be borrowed, the trader
will fail to deliver it and, consequently, not receive the proceeds from the
sale. In effect, the trader will lose one day of interest on the proceeds. On
the other hand, if the bond can be borrowed, the trader will deliver the
bond, receive the proceeds, and lend them at the special repo rate. But if
the repo rate is 0%, there is no point in bothering with the repo agreement:
Earning 0% on the proceeds is the equivalent of having failed to deliver the
bond. And certainly the trader will prefer to fail rather than accept a spe-
cial rate less than 0%. Therefore, the special rate cannot fall below 0%,
and, equivalently, the special spread cannot be greater than the GC rate. In
the fall of 2001, for example, with the GC rate near 2%, the maximum
special spread was about 200 basis points. In short, Figures 15.5 through
15.7 are slightly misleading since special spreads are not completely com-
parable over time when the level of rates is changing.
LIQUIDITY PREMIUMS OF RECENT ISSUES
Recent issues tend to trade at higher prices than otherwise similar issues.
Some of this premium is due to the demand for shorts and the resulting fi-
nancing advantage, that is, the ability to borrow money at less than GC
rates when using these bonds as collateral. Any additional premium, which
might be called a pure liquidity premium, is due to the liquidity demands
from long positions. Market participants often refer to the sum of the fi-
nancing advantage and the pure liquidity premium—that is, to the entire
Liquidity Premiums of Recent Issues 319
premium of a recent issue relative to an otherwise similar issue—as the liq-
uidity premium. Table 15.2 illustrates the magnitude of these premiums
with pairs of bonds in each of the two-, five-, 10-, and 30-year sectors for
February 15, 2001, settle.
The table illustrates the liquidity premiums in the two- and five-year
sectors by comparing the yield of the on-the-run Treasury with that
of another bond maturing on the same date. The yield of the two-year
was almost six basis points below that of the otherwise comparable
bond, and the yield of the five-year was five basis points below its com-
parable bond.
8
The table illustrates the liquidity premiums in the 10- and 30-year sec-
tors by comparing the yields on when-issued
9
(WI) securities, those about
to become the new on-the-run securities, with the yields on existing on-
the-run securities, those about to become old bonds. The WI 10- and 30-
year bonds traded at about a 12-basis point premium to the OTR 10- and
30-year bonds. These numbers actually understate liquidity premiums be-
cause the OTR issues command a premium themselves relative to sur-
rounding issues.
320 REPO
TABLE 15.2 Examples of Liquidity Premium for
Settlement on February 15, 2001
Coupon Maturity Comment Yield
4.750% 01/31/03 On-the-run 2-year 4.821%
5.500% 01/31/03 4.878%
5.750% 11/15/05 On-the-run 5-year 4.970%
5.875% 11/15/05 5.020%
5.750% 08/15/10 On-the-run 10-year 5.238%
5.000% 02/15/11 When-issued 10-year 5.121%
6.250% 05/15/30 On-the-run 30-year 5.553%
5.375% 02/15/31 When-issued 30-year 5.433%
8
These yields are not perfectly comparable because of the coupon effect described
in Chapter 3. This effect is very small, however, relative to the liquidity premium.
9
Bonds to be sold by the Treasury trade on a when-issued basis for a short time be-
fore they are actually issued. The 5s of February 15, 2011, for example, although
not issued until February 15, 2001, traded some time before then for settlement on
February 15, 2001.
To appreciate the interplay between pure liquidity premiums and spe-
cial repo rates, it is important to differentiate the sources of these two ef-
fects. A pure liquidity premium arises because of a large demand to hold a
particular bond relative to the supply of that bond available for trading. A
bond trades special because of a large demand to short the bond relative to
the supply of bonds available in the repo market, that is, relative to the
number of bonds in the hands of those willing to lend bonds. Since the
sources of pure liquidity premium and special repo rates are different, these
effects can surface in various permutations. A typical on-the-run issue,
highly valued for its liquidity and attracting a large short base, commands
a pure liquidity premium and trades special. Recently, however, the 30-year
on-the-run issue is valued for liquidity but few market participants seem
interested in shorting it. As a result, the OTR 30-year does command a
pure liquidity premium but does not trade special. Yet another permuta-
tion arises for seasoned issues that just happen to attract a large short base
relative to their supply in the repo market. These bonds do not command a
liquidity premium but do trade special.
APPLICATION: Valuing a Bond Trading Special in Repo
The financing advantage of a bond that trades special comprises an important part of the
return from buying or shorting that bond. Say that a money manager is considering pur-
chasing one of the two five-year bonds listed in Table 15.2, either the 5.75s or the 5.875s of
November 15, 2005. The (yield-based) DV01 of the two bonds is quite similar, but the 5.75s
are five basis points more expensive. Is it worth paying a five-basis point premium for the
on-the-run issue? First, the manager must make a subjective decision about how much to
value liquidity. A manager who plans on trading the security frequently or who wants to be
able to turn the position back into cash with minimum effort, even in a crisis, will value liq-
uidity relatively highly. On the other hand, a manager who plans to hold the security to ma-
turity will value liquidity hardly at all. For the sake of discussion, assume that the manager
values the extra liquidity of the OTR five-year at one basis point. The question then be-
comes whether the financing advantage of the OTR five-year bond justifies a premium of
four basis points.
The answer depends, of course, on how special the OTR five-year will trade over the
manager’s horizon and on how much of a yield premium the OTR five-year will command at
the end of that horizon. Say that the manager assumes that over the next 90 days the OTR
five-year will trade at an average of 100 basis points through the 5.875s in the repo market
APPLICATION: Valuing a Bond Trading Special in Repo 321