The Options Course High Profit & Low Stress Trading Methods Second Edition phần 9 docx
Bạn đang xem bản rút gọn của tài liệu. Xem và tải ngay bản đầy đủ của tài liệu tại đây (627.09 KB, 59 trang )
control. However, when the bears seize a stock, the chartist is looking to
see if the stock is closing near the low price of the day. For example, on
the MSFT chart, during the decline in mid-October, the stock was finishing
most trading sessions near the lows of the day, which was a sign that
bears were firmly in control of MSFT during that time.
The third type of chart that has become popular among traders is the
Japanese candlestick chart. A candlestick is composed of two parts known
as the body and the shadows. The body represents the range between the
opening and closing prices. The shadow is the thin vertical line that can pro-
ject outward above or below the body and represents the full price range
for the stock, index, or futures contract. As a result, if there were no prices
outside the range of the open to close, then there would be no shadows.
If the market closed above the opening price, the body is often col-
ored green or left blank (white). If the price closes below the opening
price, the body is colored black or red. The colors will vary from one
Tools of the Trade 457
2003 2004
30
29
28
27
26
25
24
23
22
Microsoft Corp
Daily 2.19.2004
©2004 Pinnacor Inc.
Mar Apr May Jun Jul Aug Sep Oct Nov Dec Jan Feb
250000
200000
150000
100000
50000
0
VOL(in 1000s)
FIGURE 18.2 High-Low-Close Bar Chart (Source: Optionetics © 2004)
ccc_fontanills_ch18_453-465.qxd 12/17/04 4:44 PM Page 457
charting software package to the next, but green and red seem to be the
most common. This color-coding of the body makes it easy to immediately
see if the market closed above or below the opening price for the given
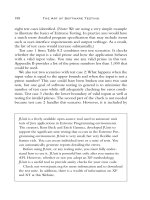
time period. An OHLC bar gives you the same information, but the color-
coding of the candlestick bar can be a bit more convenient. Figure 18.3
provides an example of a six-month candlestick chart using Microsoft ren-
dered in black, white, and grey.
CHARTS, VOLUME, AND VOLATILITY
A visual look at a chart can also give important information regarding a
stock’s volatility and, for that reason, it is extremely important to option
traders. Since the length of each bar in an OHLC chart is determined by
the high and low prices of the day, short bars suggest that the stock is
458
THE OPTIONS COURSE
2003 2004
30
29
28
27
26
25
24
Microsoft Corp
Daily 2.19.2004
©2004 Pinnacor Inc.
Aug Sep Oct Nov Dec Jan Feb
250000
200000
150000
100000
50000
0
VOL(in 1000s)
FIGURE 18.3 Six-Month Candlestick Chart (Source: Optionetics © 2004)
ccc_fontanills_ch18_453-465.qxd 12/17/04 4:44 PM Page 458
exhibiting low volatility. In that case, the trading ranges between the daily
high and low prices are small. On the other hand, when the bars are
longer, it means that there is a bigger difference between the highs and
lows of the day. Therefore, longer bars suggest greater volatility.
Most charts will also plot volume underneath the price area. Volume
refers to the total activity in the underlying asset during the course of a
day, week, month, and so on. For a stock, the volume refers to the number
of shares traded.
To some traders, volume is the single most important indicator used
in technical analysis. When a stock is rising and volume increases, it sug-
gests that buyers are actively bidding the price higher and shorts are run-
ning for cover. Strong volume during an advance is considered a bullish
sign. On the other hand, when volume swells during a decline, bears are
driving prices lower, bulls are in pain, and the action of the stock is con-
sidered poor. Therefore, studying volume gives the analyst a better sense
of whether the bulls or bears are in control of the stock.
Volume is the total number of shares associated with a specific stock
or market. Also known as turnover, it reflects the number of shares bought
or sold relative to a specific security. For instance, if you purchase 100
shares of Microsoft, the volume of that trade is equal to 100. Volume is con-
sidered during daily time periods. For instance, on Wednesday, February
18, 2004, total volume on the Nasdaq Stock Market equaled 1,777,995,664
shares. Therefore, daily volume is generally defined as the number of
shares traded in one day and can be considered for one individual stock, an
options contract, or an entire market. On a chart, volume is plotted as a
histogram such as can be seen in Figures 18.2 and 18.3. Tall bars suggest
heavy volume while short bars indicate periods of low trading volume.
COMPUTER SOFTWARE
When I started trading, the charts we had available to us were newspapers
or other print publications. Today, however, charting software makes the
process extremely fast and easy. While there are a large number of great
packages out there, we will just mention the three that our students seem
to use most often: The Optionetics Platinum site, ProfitSource and Ad-
vanced GET from eSignal.
Optionetics Platinum site is a web-based computer software program de-
signed for options traders. Access is available for an annual fee. Once inside
the site, traders can perform a host of options related studies including creat-
ing hypothetical trades, plotting volatility charts, back-testing strategies,
viewing historical prices and implied volatility levels, monitoring put/call
Tools of the Trade 459
ccc_fontanills_ch18_453-465.qxd 12/17/04 4:44 PM Page 459
ratios, initiating trade searches based on specific parameters, and plotting
risk graphs. Many of the case study examples in this book were created using
Optionetics.com Platinum.
ProfitSource is a market analysis program that combines a fully fea-
tured technical analysis suite with a comprehensive set of special market
direction tools such as Elliott wave, trend filters, and gap filters. These
tools enable the user to adopt a rule-oriented approach to trading. In addi-
tion, it has the ability to scan for potentially profitable opportunities such
as Wave 4 and Wave 5 trades, a state-of-the-art “Walk Through Mode” for
learning how to apply concepts such as Elliott wave, alerts functionality
for price, indicator and Elliott wave parameters, and a complete portfolio
management package. ProfitSource can be used in multiple markets in-
cluding stocks, indexes, futures, and foreign exchange and gives the user
access to international markets.
Advanced GET from eSignal has also gained popularity among op-
tions traders. It is a graphical charting package that gives traders access
to a full set of technical analysis tools, specialty tools and indicators
based on Elliott waves and Gann theory, and also one of the most com-
plete sets of standard studies available in the market today. Many options
traders use these three software packages to enhance their ability to con-
fidently use options strategies.
PUTTING IT ALL TOGETHER
In order to get a better understanding of how traders combine trading
tools to create a promising trade, let’s work through a simple example.
The first thing we need to employ is a method of finding stocks that are
expected to make a strong directional move to the upside or the down-
side. In this case, we are looking for an explosive move higher.
There are several tools on Platinum that help us find stocks, but for this
example we will use the Candlestick I tool. This tool searches for stocks
based on candlestick formations. (There is a wide array of different candle-
stick formations that go well beyond the scope of this book. Traders inter-
ested in the topic are encouraged to visit Optionetics.com and look through
the article archives for a complete discussion of the various patterns.) In
this case, we chose the Bullish Patterns search using stocks that were trad-
ing above $12.50 and that had volume above 300,000. Once a list of stocks
appears, we need to look at various price charts and implied volatilities.
To keep things simple, suppose we find a bullish stock and decide to
buy a long call. When buying a call, we want the implied volatility to be be-
low the average IV for at least six months. Remember, when IV is low, the
460
THE OPTIONS COURSE
ccc_fontanills_ch18_453-465.qxd 12/17/04 4:44 PM Page 460
options are cheaper. After eyeballing the charts, we found that Lehman
Brothers (LEH) looked like a strong candidate. Figure 18.4 is a chart of
LEH on May 20, 2003 showing the candlestick pattern known as Red Can-
dle + Doji that flagged the stock.
Not only did the stock form a bullish pattern known as a Harami, but
it also bounced off support at its ascending trend line. Once we find a
stock that looks promising, we want to check IV to make sure it isn’t too
high. Figure 18.5 is an IV chart of the stock on May 20, 2003, the day it
came up on the Candlestick I search.
We can see by looking at this chart that IV was definitely low on a his-
toric basis. This is important because the higher the IV, the more the op-
tion will cost. IV also acts like elastic, stretching to extremes, but
ultimately coming back to its mean. If we buy a call and IV increases, it
raises the price of the option.
Now that we have a stock picked out that fits our criteria, we can en-
ter the data into Platinum to view the risk graph. Before we actually enter
the data into the Create Trade screen, we need to first decide which op-
tion strike and expiration month we want to test. Of course, after this is
entered into the graph, we can view it to see if the trade makes sense
given our outlook and resources.
Since we are buying an option, we want to give the trade enough time
Tools of the Trade 461
FIGURE 18.4 Daily Chart of LEH (Source: Optionetics Platinum © 2004)
ccc_fontanills_ch18_453-465.qxd 12/17/04 4:44 PM Page 461
to work in our favor. Mainly, we don’t want to hold long options that ex-
pire in less than 30 days because time erosion picks up the last month of
an option’s life. The stock closed the session at $66.04 and since we don’t
normally want to use too far out-of-the-money options, let’s look at the
October 70 call. We choose the October expiry month because June and
July are too close and there aren’t any August or September options on
May 20 to choose from. After entering the data into Platinum, we get the
information shown in Figure 18.6 from the program.
This screen is just part of what Platinum tells us about the trade, but
there is plenty to see from just this information. First, we see that the
model price is between our bid-ask spread, so we know that option isn’t
overpriced. Second, we can see our breakeven point at expiration. It is im-
portant to remember that the breakeven point here is figured as of expira-
tion. Usually, we will see a profit well before this point. This screen also
gives us the Greeks and the specific option information. The next thing we
want to look at is the risk graph (Figure 18.7).
This graph gives us a visual of what the profit or loss would be given
a move in the stock and using different time frames. Obviously, if the
stock moves up in the short term, we will see higher profits than if it
takes three months to occur. Our initial debit was $340 in this trade for
buying one long October 70 call. By looking at the chart, we can see that
462
THE OPTIONS COURSE
7 – 30 day = unk
30 – 60 day = 27.19%
60 – 90 day = unk
>90 day = 30.73%
ATM Implied Volatility
30 40 50
12/16 01/15 02/13 03/14 04/11
Currently: 2003–05–20
FIGURE 18.5 IV Chart for LEH (Source: Optionetics Platinum © 2004)
ccc_fontanills_ch18_453-465.qxd 12/17/04 4:44 PM Page 462
the stock would need to move to approximately $72 for our call option to
double in price.
Another tool we can use to assess the trade is the implied volatility
chart. The IV chart shown in Figure 18.8 details the profits we would
achieve on a move in IV alone. This graph assumes the stock stays at the
same price. We can see that a rise in IV can affect the trade drastically, and
that is why we want IV in our favor.
Before we enter the trade, we should have already decided on our exit
points. The price we decide to sell at should be based on our outlook and
money management. Remember that it’s always important to have a set
exit point before entering a trade to take the emotion out of it. An oft-used
Tools of the Trade 463
0 1,000 2,000
Today: 150 days left
100 days left
50 days left
Expiry: 0 days left
Stock Price
35 40 45 50 55 60 65 70 75 80 85 90 95
66.00 66.69 65.07 66.04 +0.25
04/07 04/17 04/30 05/12 –1,000
Currently: 2003–05–20
open high low close
FIGURE 18.7 Risk Graph for LEH Call (Source: Optionetics Platinum © 2004)
Lehman Brothers Holdings, Inc (LEH) Option Trade
Entry DB Profit Max Profit Max Risk Delta (Shares) Gamma Vega Theta
$340.00 $–20.00 Unlimited $–340.00 41.8 3.2692 $16.46 $–1.53
Downside Breakeven Upside Breakeven Max Profit/Max Risk Max Profit/Debit
73.40 73.40 Unlimited% Unlimited%
Log Date Position Num OptSym Expire Strike Type Entry Bid/Ask Model IV % Vol 01 Days
2003-05-20 Bought 1 LEHIN OCT03 70 Call 3.4 3.2/3.4 3.314 28.1 0 2569 150
FIGURE 18.6 Trade Data for LEH Call (Source: Optionetics Platinum © 2004)
ccc_fontanills_ch18_453-465.qxd 12/17/04 4:44 PM Page 463
exit strategy for a long call is to sell if the option loses half its value to the
downside or when the option doubles in price to the upside. Of course, we
can always set stops once our price target is achieved to let our profits run,
but the last thing we want to do is see a profitable trade turn into a loser.
This trade did indeed work out well, with LEH shares moving up fol-
lowing this bullish sign. As originally expected, the stock went higher and
our option was at a double on June 2 with the stock trading near $72.50.
At this point, either the option could be closed or the trader could set a
stop to make sure that if the stock were to move lower, the option would
be sold before the profits were lost. Keep in mind that buying long calls is
a great way to use leverage, but it is also a high-risk one. When the strate-
gist identifies an explosive situation like in the Lehman Brothers example,
he or she might want to consider other trades like bull call spreads, call
ratio backspreads, or some of the other bullish strategies discussed in the
earlier chapters of this book.
CONCLUSION
Not all traders use charts or computers. In fact, 20 years ago much of this
information was either not available or extremely expensive. So, traders
do not need to spend a lot of money on research and analytical tools. A
464 THE OPTIONS COURSE
–300 –200 –100 0 100 200
Today: 150 days left
100 days left
50 days left
Expiry: 0 days left
ATM Implied Volatility
30
04/07 04/17 04/30 05/12 –400
Currently: 2003–05–20
7 – 30 day = unk
30 – 60 day = 27.19%
60 – 90 day = unk
>90 day = 30.73%
FIGURE 18.8 IV Chart for LEH Trade (Source: Optionetics Platinum © 2004)
ccc_fontanills_ch18_453-465.qxd 12/17/04 4:44 PM Page 464
high-speed Internet connection, a brokerage firm that specializes in op-
tions trading, and access to research can produce enough information to
trade successfully.
Hopefully, this chapter has helped to expand your knowledge regard-
ing the tools that are available and how a trader uses information to cre-
ate a trade. The example toward the end of the chapter explained how to
find an explosive opportunity and how to analyze the situation to find the
best options contract for the given strategy. Not all successful traders use
the same approach. Through time, you will undoubtedly develop your
own tools and methods for picking winning trades. Hopefully, the chap-
ters in this book are helping you along the way.
Tools of the Trade 465
ccc_fontanills_ch18_453-465.qxd 12/17/04 4:44 PM Page 465
CHAPTER 19
Final
Summary
T
his book has reviewed a variety of strategies that can be applied in
various markets. It has avoided trying to forecast market direction or
analyzing charts with detailed market patterns, and has not refer-
enced highly technical data or difficult-to-interpret fundamental informa-
tion. Although these trading tools may have their place in your trading
arsenal, they are exhaustively studied in many other publications. The pur-
pose of this book is to focus on options trading strategies and to demon-
strate how professionals trade without overanalyzing the markets. When
traders get bogged down in trying to process too much information, the re-
sult is what I often call “analysis paralysis.”
I have tried to make the information contained in this book as straight-
forward as possible. Learning to trade can be quite difficult and perplexing.
Each strategy has an infinite number of possibilities when applied to the
markets. Each trade is unique, and your task as a trader is to learn from
your achievements and your mistakes. There are no absolutes in trading.
However, I do believe that you will be able to build a solid trading
foundation based on the delta neutral strategies explored in this book.
This approach to trading comes from years of experience from my trading
team and my own endeavors. To become successful, it’s up to you to take a
systematic approach to becoming a confident market player. However, you
must be willing to spend the time and energy it takes to study the markets
if you want to learn how to trade successfully.
In late October of 1997, the Dow Jones Industrial Average dropped
554 points or 7 percent. By most people’s standards, this constitutes a
466
ccc_fontanills_ch19_466-484.qxd 12/17/04 4:44 PM Page 466
mini-crash. It was not as severe as the 1987 crash when there was a 22 per-
cent drop, but it definitely shook up the markets. Throughout the day of
the mini-crash, I talked with a number of traders and investors to discuss
our views on this market decline. At many brokerage firms, clients were
being forced to meet margin calls as their positions declined. Eventually,
there were more sell orders than the markets could bear and trading
closed early at the New York Stock Exchange. Compared to the millions
of individuals who lost a great deal of money, traders who were using the
strategies included in this book fared much better. They knew how to
hedge their positions and either made money or at least minimized the
losses to their accounts. This approach to trading offers protection and
enables players to keep playing the game.
To get started, find one market you like and get to know it very well.
Find out how many shares or contracts are traded. What is the tick value?
What are the support and resistance levels? What are the strike prices of
the available options? How many months of options should be analyzed?
Is this a volatile market? Does it have high liquidity? Do you have enough
capital to play this market?
Once you determine the right market for you, focus your efforts on
evaluating which strategies best take advantage of this market’s unique
characteristics. This can be accomplished by paying close attention to
market movement trends. For example, stock shares tend to go up in
price over the long run. This means that in many cases I take a bullish bias
over the long run in top stocks. Since many futures markets go sideways, I
like to apply the appropriate range-bound strategies.
By concentrating your attention on one market, you will become fa-
miliar with that market’s personality. When change occurs, this familiarity
will enable you to profit the most from the change. Practice these strate-
gies by paper trading your market until you get the hang of it. I recom-
mend three to six months of paper trading before investing a dime. For
every great trade you missed, there will be mistakes that could have
wiped out your whole account. Take small steps up the ladder of experi-
ence and you’ll learn what you need to master along the way.
In addition, you need to determine what influences a specific mar-
ket. Markets have spheres of influences. You need to get to know what
internal and external forces drive your chosen market. For example, the
bond market affects the S&Ps. What affects Dell, Intel, Microsoft, gold,
and silver? All of this research combines to increase your overall knowl-
edge of trading, which will help to make you a more successful trader in
the years to come.
During one of my two-day Optionetics seminars, I kept saying
that very few traders and investors really know what is going on in the
Final Summary 467
ccc_fontanills_ch19_466-484.qxd 12/17/04 4:44 PM Page 467
markets. The very next day, as if by magic, the following article appeared
in USA Today. I promptly revealed it to the students at my seminar.
Garbagemen Good at Predicting Economy
In December of 1994, the economists sent a questionnaire to four
chairmen of multinational companies, former finance ministers
from four countries, four Oxford University students, and four
garbagemen. They were asked to predict average economic prospects
including world economic growth, inflation, the price of oil, and the
pound’s exchange rate against the dollar in the ten years following
1994. The economists said the garbagemen and company bosses tied
for first with the predictions. The finance ministers came in last.
So, let me get this straight. Politicians supposedly run entire coun-
tries, right? Then how come their own finance ministers cannot beat
garbagemen at predicting economic prospects? This only emphasizes the
point that the markets are great equalizers of education. It is irrelevant
whether you have an MBA or a PhD or are a rocket scientist. High school
dropouts can do just as well at trading, if not better, if they are disciplined
and have the skills and knowledge to succeed. It is actually easier for me
to train individuals with very little experience or none whatsoever than
those who have years of experience. This is due to the fact that many ex-
perienced traders have developed bad habits that need to be broken.
Approximately 99 percent of the time that I trade delta neutral, I am
able to manage my risk on entering the trade and monitor it each day as
the market moves. Delta neutral trading is a scientific system that signifi-
cantly reduces your stress level. It provides you with the means to limit
your risk and make a consistent profit. It directs you to take advantage of
market movement by making adjustments. By learning to trade using
delta neutral strategies, traders have the opportunity to maximize profits
by making consistent returns.
OPTIONS-TRADING DISCIPLINE
Proper money management and patience in options trading are the cor-
nerstones to success. The key to this winning combination is discipline.
Now, discipline is not something that we apply only during the hours of
trading, opening it up like bottled water at the opening bell and storing it
away at the closing. Discipline is a way of life, a method of thinking. It is,
most of all, a serious approach. A consistent and methodical, or disci-
plined, system leads to profits in trading. On one hand, it means taking a
468
THE OPTIONS COURSE
ccc_fontanills_ch19_466-484.qxd 12/17/04 4:44 PM Page 468
quick, predefined loss because the first loss is always the best. On the
other hand, discipline gives you the impenetrable strength to keep holding
on to an options position when success is at hand or passing on the trade
or an adjustment when you don’t have a signal. It also entails doing all our
preparatory work before market hours. It is getting ourselves ready and
situated before the trade goes off so that, in a focused state, we can moni-
tor market events as they unfold.
Discipline can sometimes have a negative sound, but the way to free-
dom and prosperity is an organized, focused, and responsive process of
trading. With that, and an arsenal of low-risk/high-profit options strategies,
profits can indeed flow profusely. The consistent disciplined application of
these strategies is essential to your success as a professional trader.
Finally, as option traders, in order to improve in the area of discipline,
we must identify, change, or rid ourselves of anything in our mental environ-
ment that doesn’t contribute to the strictest execution of our well-planned
trading approach. We need to stay focused on what we need to learn and do
the work that is necessary. Your belief in what is possible will continue to
evolve as a function of your propensity to adapt. On a cautionary note, avoid
high commissions, brokers soliciting business, and software that promises
or boasts impossible results. High turnaround fees can really eat into your
profits. Remember, nothing beats your own ability to trade effectively. No
one wants to take better care of your money than you do.
CHOOSING THE OPTIMUM OPTION STRATEGY
For the skilled investor, stock options can be a very powerful tool.
Whether they are used alone or in combination with other options or
stock, options offer the flexibility to address any number of unique invest-
ment goals and parameters. However, before the search for a suitable
strategy can even begin, the investor needs a solid understanding of how
option investments work.
The options strategist is always faced with a variety of alternatives. To
determine which one is best you must consider your investment goals,
market outlook, and risk tolerance all of which are key in narrowing down
the list of reasonable candidates. The same goals and predictions can also
limit the choice of suitable strike prices and expiration dates. Each strat-
egy and each contract has its own advantages and drawbacks.
Forecasting the price of the underlying equity is a prime motive be-
hind directional option strategies. Whether the goal is profit or protection,
the market outlook certainly narrows the list of strategic alternatives.
More often than not directional strategies require the investor to
Final Summary 469
ccc_fontanills_ch19_466-484.qxd 12/17/04 4:44 PM Page 469
make at least three assessments about the future price of the stock. The
first one is obviously direction itself. Based on our market analysis, we
need to determine if we expect the price of the stock to rise, fall, or stay at
the current level. The second judgment is about the size of the move. This
will have a distinct bearing on the choice of strike prices.
For some option strategies, it is not enough to decide on a direction.
The magnitude of the projected price move may determine which strike
prices are suitable candidates. For instance, when analyzing a call option
with an out-of-the-money strike price, you will need to determine how
high would the underlying stock have to rise to make the position prof-
itable as well as how realistic this move would be based on your research.
The third decision concerns the time frame in which the stock price
forecast must take place. Options have a limited time span. If both the
projected direction and size of the move come true, but only after the op-
tion expires, the option strategist still would not have achieved the in-
tended goal. That is why timing is just as crucial in strategy selection as it
is for everyday life.
So, option strategists who are making a directional call must be right
on three levels; the stock price must move in the right direction, by a suffi-
cient amount, and by the expiration date. If the trader is wrong about any
of the three projections, it could have an adverse impact on the success of
the strategy.
For some strategies, it is enough for XYZ to reach a certain level at
some point before expiration, but the exact timing is less important. The
consequences for being a bit off the mark are much more serious in other
cases. There are some that succeed only if the stock price behaves correctly
for the duration of the contract. A clear idea about where the underlying
equity is likely to move and when, should improve the option strategist’s
chances of success with selecting and implementing an appropriate
directional strategy.
Finally, even when two traders’ forecasts are exactly the same, differ-
ent goals may dictate two very different approaches. For example, is the
trade intended primarily to generate income or is it to protect an existing
position in the same stock? Or is it a way to set a price objective for enter-
ing or exiting a stock position? The answers to these kinds of questions
will guide the trader in ruling in some strategies and ruling out others
when attempting to select the optimum options strategy.
IMPLIED VOLATILITY AND TRADE SELECTION
When it comes to professionally trading options, there is no more impor-
tant component than volatility. As discussed in earlier chapters, volatility
470
THE OPTIONS COURSE
ccc_fontanills_ch19_466-484.qxd 12/17/04 4:44 PM Page 470
will often dictate which strategy is best in any given situation. We have al-
ready explored what volatility is and the relationship between two types
of volatility: implied and historical volatility. Now let us correlate the rela-
tive implied volatility levels to the inventory of available option strategies
using a strategy matrix. It will provide some guidelines on how to best use
this valuable strategy-driving indicator.
Before presenting a comprehensive table of implied volatility levels
and option strategies, let’s review the definitions of each strategy. These
definitions serve only to facilitate an understanding of the table so that
you may refer to it when needed with clarity. Although most of the strate-
gies have been covered in this book, the reader is encouraged to investi-
gate additional educational resources that offer a more in-depth analysis
on any or all of the strategies. You may want to find one or two that seem
to make the most sense to you, and start paper trading them until you un-
derstand them thoroughly. For now, here are some basic definitions of the
option strategies covered in this book:
Call Gives the buyer the right, but not the obligation, to buy the un-
derlying stock at a certain price on or before a specific date. The seller
of a call option is obligated to deliver 100 shares of the underlying stock
at a certain price on or before a specific date if the call is assigned.
Put Gives the buyer the right, but not the obligation, to sell the un-
derlying stock at a specific price on or before a specific date. The
seller of a put option is obligated to buy a stock at a specific price if
the put is assigned.
Covered call Sell an out-of-the-money call option while simultane-
ously owning 100 shares of the underlying stock.
Covered put Sell an out-of-the-money put option while simultane-
ously selling 100 shares of the underlying stock.
Bull put spread Long the lower strike puts and short the higher
strike puts with the same expiration date using the same number of
contracts, all done for a net credit.
Bull call spread Short the higher strike calls and long the lower
strike calls with the same expiration date using the same number of
contracts, all done for a net debit.
Bear put spread Long the higher strike puts and short the lower
strike puts with the same expiration date using the same number of
contracts, all done for a net debit.
Bear call spread Long the higher strike calls and short the lower
strike calls with the same expiration date using the same number of
contracts, all done for a net credit.
Final Summary 471
ccc_fontanills_ch19_466-484.qxd 12/17/04 4:44 PM Page 471
Long straddle Long both an at-the-money call and an at-the-money
put with the same number of contracts, identical strike price and
expiration date.
Long strangle Long both a higher strike OTM call and a lower
strike OTM put with the same number of contracts and same
expiration date.
Call ratio backspread Short the lower strike calls that are at-the-
money or in-the-money and simultaneously buy multiple higher strike
calls with the same expiration date in a ratio less than .67.
Put ratio backspread Short the higher strike puts that are at-the-
money or in-the-money and simultaneously buy multiple lower strike
puts with the same expiration date in a ratio less than .67.
Call butterfly spread Sell two at-the-money middle strike calls
and buy one call on each wing. The trade is a combination of a bull
call spread and a bear call spread.
Put butterfly spread Sell two at-the-money middle strike puts and
buy one put on each wing. The trade is a combination of a bull put
spread and a bear put spread.
Long iron butterfly Long a lower strike out-of-the-money put; long
a higher strike out-of-the-money call; short a middle strike at-the-
money call; short a middle strike at-the-money put.
Condor Long a lower strike option at support; sell a higher strike
option, and an even higher strike option; and buy an even higher
strike option at resistance (all calls or all puts).
Call calendar spread Buy a long-term call and sell a short-term
call against it for the same strike price and same number of contracts,
using different expiration months.
Put calendar spread Buy a long-term put and sell a short-term put
against it for the same strike price and same number of contracts, us-
ing different expiration months.
Diagonal spread Buy a long-term option and sell a short-term op-
tion with different strikes and as small a net debit as possible.
Collar Purchase stock and sell a call against it usually for a year
or longer. With the premium received for selling the call, buy a pro-
tective put.
In order to determine which strategy is best in any given situation, it is
useful to consider volatility. Recall that there are two types:
1. Historical volatility. Measures a stock’s tendency for movement
based on the stock’s past price action during a specific time period.
472
THE OPTIONS COURSE
ccc_fontanills_ch19_466-484.qxd 12/17/04 4:44 PM Page 472
2. Implied volatility. Approximates how much the marketplace thinks
prices will move. It is derived from the option prices in the market
and an option pricing model.
Option strategists often use historical volatility as a guide, or a barom-
eter, to determine if implied volatility is high or low. Table 19.1 shows the
various strategies that can be used in high and low implied volatility situa-
tions. In this case, the implied volatility level column on the right-hand
side of the table is referring to the relationship of the current implied
volatility reading to the stock’s historical volatility. If it is low, this sug-
gests that implied volatility is less than statistical volatility. If it is high,
this suggests that implied volatility is greater than historical volatility.
Current Implied Volatility Level
• High—Current implied volatility is significantly above historical
volatility.
• Low—Current implied volatility is significantly below historical
volatility.
• Average—Current implied volatility is at or near historical volatility.
To use the strategy matrix effectively, the trader needs to select the di-
rectional bias of the stock, evaluate the implied volatility level, and then
match this information up with the available strategies. For example, if I
am bullish and the underlying stock has an average implied volatility level,
then by using the selection matrix, I can select either a long call or a short
put for my options strategy. On the other hand, if I am bearish and implied
volatility is high, I might consider a bear call spread or a bear put spread.
In conclusion, the table is a guide to help you understand your alter-
natives and subsequently determine which strategy works best in any im-
plied volatility situation: high, average, or low. Use it not only as a quick
reference chart convenient for choosing the appropriate strategy, but also
to develop a fundamental appreciation for the role implied volatility plays
in the selection process.
SUCCESSFUL INVESTMENT MAXIMS
FROM WALL STREET LEGENDS
Let’s take a look at the various investment principles, practices, and
philosophies of some of the most successful equity investors on Wall
Street. Most of these names you have certainly heard of; however, there
are others who do not have quite as much notoriety. But as you will see,
Final Summary 473
ccc_fontanills_ch19_466-484.qxd 12/17/04 4:44 PM Page 473
474 THE OPTIONS COURSE
TABLE 19.1 Strategies for High, Low, and Average Implied Volatility Situations
Implied
Directional Bias
Volatility
Bullish Neutral Bearish Level
Buy call Buy straddle Buy put Low
Protective put Buy strangle Protective call Low
Bull call spread Short ATM call Bear call spread Low
butterfly
Bull put spread Short ATM put Bear put spread Low
butterfly
Short ITM call Call ratio Short OTM call Low
butterfly spread backspread butterfly
Short OTM put Put ratio Short ITM put Low
butterfly spread backspread butterfly
Long OTM call Short ATM call Long ITM call Low
calendar spread calendar spread calendar spread
Long ITM put Short ATM put Long OTM put Low
calendar spread calendar spread calendar spread
Long call No trade Long put Average
Short put No trade Short call Average
Short put Short straddle Short call High
Covered call Long ATM call Covered put High
calendar spread
Bull call spread Short strangle Bear call spread High
Bull put spread Long ATM call Bear put spread High
butterfly spread
Long OTM call Long ATM put Long ITM call High
butterfly spread butterfly spread butterfly spread
Long ITM put Iron butterfly Long OTM put High
butterfly spread spread butterfly spread
Short ITM call Condor spread Short OTM call High
calendar spread calendar spread
Short OTM put Put and call Short ITM put High
calendar spread ratio spreads calendar spread
Collar spread Long ATM put No trade High
calendar spread
Note: The following abbreviations are used in the table: ATM = At-the-money,
ITM = In-the-money, OTM = Out-of-the-money.
ccc_fontanills_ch19_466-484.qxd 12/17/04 4:44 PM Page 474
they all offer something valuable and different that can be applied to your
own equity investing.
The first legendary investor I am sure most of you have heard of is War-
ren Buffett. Buffett has a famous quote when describing his approach to the
market: “Rule number 1: Never lose money. Rule number 2: Never forget rule
number 1.” Buffett has often said when entering a stock trade that he is not
attempting to make money but operates on the assumption that they could
close the market the next day and not reopen it for five years. He asserts that
he does not invest in stocks but rather in businesses and feels that one of the
dumbest reasons to purchase a stock is because it is going up.
Buffett feels that investors should draw a circle around the busi-
nesses they understand and then filter out those that fail to qualify on the
basis of value, good management, and ability to endure hard times. This
classic fundamentalist has another famous quote that drives home his phi-
losophy: “You should invest in a business that even a fool can run, because
someday a fool will.”
Another Wall Street legend for whom even Warren Buffett has a lot of
praise is Phillip Carret. Carret lived from 1896 to 1998. He founded one of
the first mutual fund, the Pioneer fund, in 1928. Carret insisted an investor
should never hold fewer than 10 different securities covering five different
business sectors and at least once in six months should reappraise every
security held. He maintained if one were to do it more frequently one
would be more apt to sell it sooner than one should because many times it
takes years for a stock price to reflect the value of the company.
Carret always was aware of his surroundings when trying to uncover
profitable opportunities. For example, when staying at a hotel in Boston
he used Neutrogena soap and was so elated with the product that he pur-
chased the stock. A few years later Johnson & Johnson bought Neutro-
gena and Carret made a fortune from his original investment. He also
liked options and felt that an investor should set aside a small proportion
of available funds for the purchase of long-term stock options of promis-
ing companies whenever available.
Peter Lynch is also an investor who has had a fabulous career on Wall
Street. One of his key rules is to absolutely understand the nature of the
companies you own as well as the specific reasons for holding the equity. He
maintains that if investors would put their stocks into categories they would
have a better idea of what to expect from them. Even though Peter Lynch
might visit more than 400 companies in a year, some of his best investments
have come from using the company’s product. For example, he purchased
Taco Bell after trying and enjoying one of their burritos during his travels.
Some of his other investment maxims include the observation that big
companies have small moves and small companies have big moves. Also,
Final Summary 475
ccc_fontanills_ch19_466-484.qxd 12/17/04 4:44 PM Page 475
he says it’s better to miss the first move in a stock and wait to see if a com-
pany’s plans are actually working out. Mr. Lynch likes to invest in simple
companies that appear dull and out of favor with Wall Street.
He asserts that you should look for companies that consistently buy
back their own shares and views insider buying as a positive sign, espe-
cially when several individuals are buying at once. As a true fundamental-
ist, he carefully considers the price-earnings ratio. It is his belief that if the
stock is extremely overpriced, even if everything else goes right, you
won’t make any money.
Another Wall Street wizard is Sir John Templeton, who is an expert at
uncovering international investment opportunities. To illustrate, by the
mid-1960s, Templeton and his famous Templeton Funds were invested in
Japan, where stocks were trading at 4 times earnings whereas U.S. stocks
were at 16. He believes that for all long-term investors, there is only one
objective: maximum total return after taxes.
Much of his investment philosophy is predicated on the belief that it is
impossible to produce a superior performance unless you do something
different from the majority. He goes on to explain that a time of extreme
pessimism is a great buying opportunity, and a time of extreme optimism
is the best time to sell. He is indeed a classic contrarian. The crux of his
approach is that if you search for investments worldwide, you will find
more deals and better bargains than by analyzing only one country. In
addition, you gain the safety of diversification.
One very colorful figure who had an exceptional career on Wall Street
was Bernard Baruch, who lived from 1870 to 1965. In his investments he
adopted a skeptical philosophy, always trying to separate facts from emo-
tion. He insisted that to successfully speculate in the markets it must be a
full-time job. Baruch viewed relying on inside information or hot stock
tips as a very dangerous way to invest.
Before purchasing any stock, Baruch would make sure he knew
everything he could about the company: its competitors, its management,
and its earnings growth potential. He never attempted to pick tops and
bottoms and was always quick to take losses. In addition, Mr. Baruch tried
to be in just a few investments at one time so the trades could be better
managed. He would periodically analyze all of his investments to see if
new developments had changed his original outlook.
One of his key habits to which he attributed much of his success was
that he constantly would analyze his losses to determine his mistakes. He
would often get away from the hustle and bustle of Wall Street to perform
this review. He always concluded this exercise with a self-examination of
his trading decisions to better understand his own failings.
Another impressive investment guru is John Bogle, who founded the
Vanguard Group, a mutual funds company in 1974. The cornerstone of his
476
THE OPTIONS COURSE
ccc_fontanills_ch19_466-484.qxd 12/17/04 4:44 PM Page 476
investment approach is that investing is not complicated and can be done
quite successfully by just employing a little common sense. He contends
the investor can do very well by doing just a few things right and avoiding
serious mistakes.
He believes in taking reasonable risks to achieve higher long-term
rates of return and that one’s portfolio should be well diversified. This di-
versification maxim is why Bogle feels that mutual funds are so valuable.
He contends that a set of diversified investments in stocks and bonds only
has market risk versus the greater risk of being in just one or two stocks.
Finally, he emphasizes thinking for the long term and that stocks may re-
main overvalued or undervalued for years, so staying the course is one of
his key trading rules. He feels that patience and consistency are the most
valuable assets an investor can possess.
Henry Clews, a famous investor who lived from 1834 to 1923, was a
very successful trader who practiced his craft in the very early days of
Wall Street after coming to New York from England in 1850. Mr. Clews al-
ways felt investment experts should be sought out to manage portfolios,
asserting that if one needed legal help one would see a lawyer and if one
needed medical help one would not hesitate to see a doctor; thus if need-
ing investment advice one should seek out a professional.
Much of Mr. Clews’ advice centers on what types of people to avoid
when seeking your investment fortune. Some of the characteristics he cites
include individuals who unjustly accuse others of bad deeds, who never
have a good word for anybody, who won’t work for an honest living, or
who run into debt with no apparent intention of repaying. He asserts that
by prudently avoiding these types of people and selecting only associates
without these characteristics your life and fortune will be a lot better off.
I am sure most of you have heard of this next investment legend,
Charles Schwab. He founded Charles Schwab & Company in 1974. After
selling a controlling interest in the firm to BankAmerica in 1983, he bought
it back in 1987 and took the company public that same year. Some of his
investment wisdom for selecting stocks and mutual funds includes when
reading financial papers to always pay attention to the advertisements as
there might be an investing opportunity behind the ad.
Mr. Schwab considers mutual funds to be the best investment for
most people and claims index funds are a great way to invest for both the
novice and the veteran investor. In addition, he feels that one should con-
sider only no-load mutual funds with good performance records, not only
for the current year but also over the life of the fund. Mr. Schwab strongly
recommends that investors include an international component in their
asset allocation plan.
Another brilliant trader, Linda Bradford Raschke, currently the presi-
dent of LBRGroup, began her professional trading career in 1981 as a market
Final Summary 477
ccc_fontanills_ch19_466-484.qxd 12/17/04 4:44 PM Page 477
maker in equity options. After seven years on the trading floor, she left the
exchange to expand her trading program in the futures markets. Linda
Raschke has since been a principal trader for several hedge funds and runs
commercial hedging programs in the metals markets. She has pioneered
work on volatility-based trading indicators, which were incorporated into
her daily trading programs and her overall approach to the markets.
Linda Raschke is a very successful short-term trader who uses a
swing trading methodology as the cornerstone of her success. Her ap-
proach is a combination of monitoring intraday news and economic re-
ports along with pattern recognition on charts that signal potentially
explosive moves. Linda use the Average Directional Index (ADX) as her
core indicator to signal direction and examines market volatility to deter-
mine where best to apply her ADX tool.
Traders who have employed these short-term tools have increased the
profit probability of their positions dramatically. In fact, this is the main
theme of Linda’s trading philosophy. She requires that the probability of
profit for any trade she considers placing is definitely in her corner before
ever pulling the trigger. The effectiveness of this approach is obvious,
given her long-term success in the business and that she was featured in
Jack Schwager’s book, The New Market Wizards (HarperBusiness, 1992).
Linda Raschke’s high-probability short-term trading strategies are worth
learning for any trader wishing to profit from swings and volatility in the
marketplace. As a technical trader, she has contributed a wealth of knowl-
edge in this area and through her lectures and publications has helped
many people become better market timers.
I hope you have enjoyed this information about these Wall Street gu-
rus. Even though they have different styles and have invested in different
eras, each one has some very invaluable investment insights that can be
integrated into your own approach to the markets.
TRADING PERFECTIONISM
In the trading arena, you will find endless sources of financial achieve-
ment and accolades, which often go hand-in-hand. In general, our culture
respects achievement. Our daily lives are full of pressures to be better,
faster, and more accurate. Of course the ultimate achievement would be
to attain total perfection. The logical extension of better is best, and the
ultimate best is perfect. Many times we carry this burden of impossible
expectations into our trading, where it can be quite detrimental.
Knowing and understanding these self-imposed problems might not
banish your temptation to seek unrealistic goals, but awareness of
478
THE OPTIONS COURSE
ccc_fontanills_ch19_466-484.qxd 12/17/04 4:44 PM Page 478
forces working on you can help you develop emotional discipline. For
example, many people allow others to define their expectations and
goals—the old “keeping up with the Joneses” syndrome. Many people of-
ten care way too much about what others think about their trading. In-
stead you should spend your time determining your own personal
financial goals. Trading is challenging enough without loading it up with
this type of emotional baggage.
Also, people have widely differing levels of comfort with uncertainty.
Some people have no fear and will try just about anything. There are others
for whom making decisions without 100 percent certainty is a nightmare.
Trading decisions are made emotionally difficult because we:
• Are keenly aware of our chancy surroundings;
• Accurately predict that waiting will afford us some additional
information;
• Our precision-dominated world makes us believe a perfect answer
might actually exist.
So we recoil from decisions in the realization that our odds of less
than ideal results are high. It seems we must always fight our aversion to
uncertainty and get on with our investment lives as best we can.
Which brings us to envy. This major enemy is constantly poised to de-
feat our trading endeavors. We see the rich and famous and read of the
fabulous successes of a very few traders, but we fail to focus on their sta-
tus as exceptions to the norm. By allowing envy to define the exceptional
performance of others as our own standard, we help to defeat ourselves.
Such self-imposed frustration leaves us concentrating on the difficulty of
our task rather on the task itself.
For many traders, for whom no amount of gain is enough, greed is a
success killer. Whether by long actual experience or merely by consider-
ing the odds, we know that we will not sell at the highest price. And yet
we seem to always hold on for that last extra point. Are we greedy in our
trading because we think that an even bigger gain will stroke our egos and
pad our pockets even more? Do we hold on because this particular stock
has treated us well and we are willing to stay in the trade rather than risk
selecting another trade? Whatever the reasons for and operating dynamics
of our greed, it will defeat us. Greed is merely another way of expressing a
driving need for perfectionism.
Ego is another key barrier to trading success. We seem to want to
be right and be the best even if there are no other observers. Our egos
feel better when we are right and worse when we are wrong. So, in
thinking about buying, we become frozen into indecision by realizing
we might make a mistake, which would in turn injure our egos. When
Final Summary 479
ccc_fontanills_ch19_466-484.qxd 12/17/04 4:44 PM Page 479
looking at holding versus selling, we subconsciously provide our egos
with more chances for stroking and forestall the known immediate pain
of an ego injury by doing nothing. That way, our possibilities for further
gain, for reducing or recovering a loss, and for avoiding the pain of not
selling at the top are left open.
Here we have perfectionism again making our ego feel good and urg-
ing us to do nothing. Knowing your ego’s tendency to get in the way, and
observing in real time your own behaviors that indicate this is happening,
can help you to come to terms with perfectionism. It is probably not to-
tally curable, but can be managed by constant attention.
There are some trading tips one can follow to minimize the occurrence
of these self-imposed problems. Databases and experts are wonderful
sources of financial information. However, the more sources you consult,
the higher the likelihood that the information will conflict. Such conflicts
will confuse you, allowing information overload to drive up your anxiety
level. It is important for you to use as much information as you can easily
handle. You need to develop a trading approach that feels comfortable and
then stick to it. For example, if you are more attracted to value than
growth investing then go for it. If fundamentals make more sense intu-
itively than technical analysis, so be it, and vice versa. Go with what you
can reasonably handle and ignore the latest fundamental or technical tools
that come out. As a trader, this will help you to stay focused, follow your
plan, and concentrate on making consistent profits.
TRADING TIPS FOR SUCCESS
Becoming a trader who consistently wins in the options market requires
three key elements:
1. A bargain-hunting instinct with the ability to identify undervalued and
overvalued options.
2. A sound and well-designed game plan that provides consistent action
over time and that prospers in all market conditions.
3. The discipline to follow the game plan. (Plan your trade and trade
your plan.)
In applying this formula for success in the options market, the first
element is simple: You must always seek to buy underpriced options and
sell overpriced options. Most option investors do not follow this basic
rule of option investing. They spend far too much time studying the un-
derlying stocks and following the market, and base their option pur-
chases only on these factors, ignoring the price and implied volatility of
480
THE OPTIONS COURSE
ccc_fontanills_ch19_466-484.qxd 12/17/04 4:44 PM Page 480
the option. If you do not buy underpriced options or sell overpriced op-
tions, you are going to lose eventually.
You must also create a good game plan. In the options market, the
game plan is far more important than in other markets because things
happen so quickly that you must be prepared before you play. Then, you
have to follow your game plan.
A good trading plan involves a gradual program for investing in the
options market versus the elephant approach, where you take all of
your money and invest it all at one time, all on one side of the market.
In addition, your portfolio must be balanced, investing money in both
puts and calls. As you become more familiar with the different trading
tactics, you can further diversify among directional, sideways, and delta
neutral strategies. Also, be sure to diversify among different sectors
over time.
Set aside a speculative fund for options, realizing you could lose
everything because of the short-term expiring nature of these investment
vehicles. Most importantly, this speculative cash must be money you can
afford to lose. If you play in the options market with money you cannot af-
ford to lose, your emotions are guaranteed to overwhelm you and you will
be forced into bad trading decisions.
Finally, the most important part of your game plan is not how many
positions to take and when to take them, but once you are in a position—
when do you take profits and when do you cut losses? Here you must
clearly define when to take profits or cut losses before you place the
trade, or your emotions will force you to do the wrong thing at the wrong
time. Try to be consistent. Don’t keep changing the rules of your game
plan in the middle of the strategy.
The last ingredient to success is ironclad discipline. You may think
that this step is the easiest one to implement, but discipline can be diffi-
cult to maintain, especially in the midst of the battle when you may be in-
curring losses and have to make some tough decisions. If you don’t have
your trading plan written down on paper, and instead decide in your head
what moves will be made at each point, your lack of discipline will catch
up with you sooner or later. If you find yourself straying from your game
plan, you are doomed, and you might as well liquidate all your positions
and invest in some Treasury bills. Without discipline, you will simply
never win the options game.
Options traders lose when they follow the crowd because the crowd
feeds on emotions. To profit consistently, you must stand alone and act ra-
tionally. In the options markets, this means buying underpriced
options/selling overpriced options, and having a well-designed trading
plan—one that shuns your emotions, forces you to be consistent, and
keeps you with a balanced, diversified portfolio.
Final Summary 481
ccc_fontanills_ch19_466-484.qxd 12/17/04 4:44 PM Page 481