Báo cáo y học: "Common gene expression strategies revealed by genome-wide analysis in yeast" ppt
Bạn đang xem bản rút gọn của tài liệu. Xem và tải ngay bản đầy đủ của tài liệu tại đây (674.02 KB, 16 trang )
Genome Biology 2007, 8:R222
Open Access
2007García-Martínezet al.Volume 8, Issue 10, Article R222
Research
Common gene expression strategies revealed by genome-wide
analysis in yeast
José García-Martínez
*†
, Fernando González-Candelas
‡
and José E Pérez-
Ortín
†
Addresses:
*
Sección de Chips de DNA-SCSIE, Universitat de València, Dr Moliner 50, E-46100, Burjassot, Spain.
†
Departamento de Bioquímica
y Biología Molecular, Universitat de València, Dr Moliner 50, E-46100, Burjassot, Spain.
‡
Instituto Cavanilles de Biodiversidad y Biología
Evolutiva and Departamento de Genética, Universitat de València, Dr Moliner 50, E-46100, Burjassot, Spain.
Correspondence: José E Pérez-Ortín. Email:
© 2007 García-Martínez et al.; licensee BioMed Central Ltd.
This is an open access article distributed under the terms of the Creative Commons Attribution License ( which
permits unrestricted use, distribution, and reproduction in any medium, provided the original work is properly cited.
Variables controlling gene expression<p>A comprehensive analysis of six variables characterizing gene expression in yeast, including transcription and translation, mRNA and protein amounts, reveals a general tendency for levels of mRNA and protein to be harmonized, and for functionally related genes to have similar values for these variables.</p>
Abstract
Background: Gene expression is a two-step synthesis process that ends with the necessary
amount of each protein required to perform its function. Since the protein is the final product, the
main focus of gene regulation should be centered on it. However, because mRNA is an
intermediate step and the amounts of both mRNA and protein are controlled by their synthesis
and degradation rates, the desired amount of protein can be achieved following different strategies.
Results: In this paper we present the first comprehensive analysis of the relationships among the
six variables that characterize gene expression in a living organism: transcription and translation
rates, mRNA and protein amounts, and mRNA and protein stabilities. We have used previously
published data from exponentially growing Saccharomyces cerevisiae cells. We show that there is a
general tendency to harmonize the levels of mRNA and protein by coordinating their synthesis
rates and that functionally related genes tend to have similar values for the six variables.
Conclusion: We propose that yeast cells use common expression strategies for genes acting in
the same physiological pathways. This trend is more evident for genes coding for large and stable
protein complexes, such as ribosomes or the proteasome. Hence, each functional group can be
defined by a 'six variable profile' that illustrates the common strategy followed by the genes
included in it. Genes encoding subunits of protein complexes show a tendency to have relatively
unstable mRNAs and a less balanced profile for mRNA than for protein, suggesting a stronger
regulation at the transcriptional level.
Background
The central dogma of molecular biology [1] states that infor-
mation runs from DNA to protein. In spite of the increasing
number of non-protein-coding genes discovered in the past
few years, it is still true that a large part of the genetic infor-
mation follows the central dogma. Therefore, it would be
interesting to evaluate the respective contributions and the
balance between all the steps in the flow of genetic informa-
tion from the gene (DNA) to the final product (protein).
Because the ready availability of protein is its final goal, the
complex process of gene regulation should be addressed to
Published: 19 October 2007
Genome Biology 2007, 8:R222 (doi:10.1186/gb-2007-8-10-r222)
Received: 15 March 2007
Revised: 24 July 2007
Accepted: 19 October 2007
The electronic version of this article is the complete one and can be
found online at />Genome Biology 2007, 8:R222
Genome Biology 2007, Volume 8, Issue 10, Article R222 García-Martínez et al. R222.2
this aspect. However, given that mRNA is an obligate inter-
mediate step and because the amounts of both mRNA (RA)
and protein (PA) are controlled by synthesis and degradation
rates, the desired PA can be obtained following different
strategies that should take into account the energy costs of
each step, the appropriate speed of response to potential
changes in the environment [2], the optimal biological noise
[3-5] and the possibility of post-transcriptional and/or post-
translational regulatory mechanisms [4]. For instance, a
given PA can be obtained by maximizing the transcription
rate (TR) with a moderate mRNA stability (RS) to obtain a
high RA. Ribosomal proteins are an example of this strategy
[6]. In other cases, a high RS compensates for a low TR
(reviewed in [7]). Sometimes, a low RA can be compensated
for by a high TR for each molecule (individual translation rate
(TLRi)) or vice-versa [8]. Understanding how PA is related to
RA and how RA depends on TR and RS is essential for inter-
preting the different strategies for gene expression. The sta-
bility of the protein molecule (PS) is the final variable
determining PA [9]. In general, there is a positive correlation
between RA and PA [8,10,11], although it has been shown that
in many cases the amount of mRNA is not a good predictor of
the amount of protein [12]. The correlation depends critically
on the functional categories of genes and proteins [8,13].
Mechanisms for regulating expression at each of these levels
have been shown in many organisms, including yeast
[7,12,14].
The yeast Saccharomyces cerevisiae is probably the most
intensively studied organism using functional genomics tech-
nologies. In spite of a recent comprehensive study on
Schizosaccharomyces pombe [15], S. cerevisiae remains the
only organism for which all the six variables in the genetic
expression flow (Figure 1), that is, mRNA amounts [16,17],
abundance of many proteins [4,8,11,18], transcription rates
[19], translation rates [20,21], mRNA stabilities [19,22,23]
and protein stabilities [9], are available. All these data have
been obtained independently by different laboratories using
standard growth conditions and the same genetic background
(S288c). As a consequence, it is now possible to study, for the
first time, how a cell regulates the quantities of each of its pro-
teins by adjusting the synthesis rates and stabilities of
mRNAs and proteins.
In this paper we analyze the relationships between all six var-
iables under yeast exponential growth in yeast extract-pep-
tone-dextrose (YPD) culture medium. Our analyses show that
functionally related genes tend to have similar values for the
six variables, which demonstrates that yeast cells use com-
mon expression strategies (CESs) for genes in the same phys-
iological pathways. Accordingly, each functional group can be
defined by a 'six variable profile' (6VP) that illustrates the
strategy followed by that particular group. It is also shown
that synthesis rates and molecule amounts tend to be more
highly correlated than stabilities. The unique behavior of RS
for many genes involved in stable protein complexes suggests
that, for those groups, regulation at the transcriptional level
is particularly important.
Results
Variables acting on the genetic information flow
The recent availability of high-throughput data from the yeast
S. cerevisiae [8,9,17,20,22,23] opens the possibility of analyz-
ing the relationships between the six variables that control
gene expression (TRi, RA, RS, TLRi, PA and PS; Figure 1) at a
genome-wide level. In the flow of genetic information, there
are two synthesis steps, transcription and translation, which
produce (relatively) unstable macromolecules, mRNA and
protein. The amount of mRNA depends only on its transcrip-
tion rate and stability [2,24], while the amount of protein
depends not only on its overall translation rate (TLR) and sta-
bility but also on the RA [24].
The actual production rates of mRNA and protein, TR and
TLR, are, in fact, the product of individual rates, TRi and
TLRi, times the number of genes or mRNA copies, respec-
tively. In this case, these two variables are practically equiva-
lent for calculating TR because almost all yeast genes are
single copy. Therefore, we have used TR throughout this
paper. However, given that TLR and TLRi are essentially dif-
ferent, in this study we have used TLR, TLRi or both, depend-
ing on the specific goal of each analysis.
Correlation between variables
An essential question in molecular biology is to determine
which strategy the cells adopt to obtain a given amount of
mRNA and protein from each gene and whether the strategies
are similar or different for both molecules. Since the amount
of each molecule depends on the corresponding synthesis and
degradation rates then the use of similar or different strate-
gies for mRNA and protein will affect the correlations
between TR and TLRi, and between RS and PS. Moreover,
cross-correlations between synthesis rates or stabilities with
the amounts of the respective products, mRNA or protein,
will inform about the contributions of TR and RS to RA and
TLRi and PS to PA.
Pair-wise correlations between the seven variables consid-
ered were obtained using Spearman rank coefficients (Figure
2a). We found relatively high, positive, statistically significant
correlations (numbers in blue) between RA and PA, PA and
TLR or TLRi, RA and TR and between TR and TLR or TLRi.
Some of these correlations have been described previously
[8,11,17,19]. The correlation between TR and TLR was
expected because of the known correlation between TR and
RA and the involvement of RA data in the computation of
TLR. However, the new, positive correlation (r
S
= +0.46)
found between TR and TLRi means that yeast cells tend to use
similar synthesis strategies for mRNA and protein. Although
this correlation can be influenced by some groups having
either high TR and TLRi (ribosome, proteasome) or low TR
Genome Biology 2007, Volume 8, Issue 10, Article R222 García-Martínez et al. R222.3
Genome Biology 2007, 8:R222
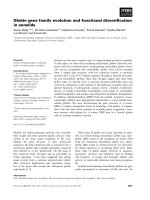
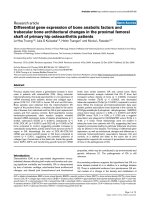
Schematic representation of the steps in the gene expression flow from DNA to proteinFigure 1
Schematic representation of the steps in the gene expression flow from DNA to protein. Convergent lines with arrowheads indicate the two variables that
are combined to generate the next one. In this flow there are two synthesis steps, transcription and translation, yielding mRNA and protein molecules,
respectively. The amount of such molecules (RA and PA, respectively) is the consequence of a balance between their synthesis and their degradation.
Individual transcription rates (TRi and TLRi) multiplied by copy number gives the total transcription and translation rates (TR and TLR). Whereas synthesis
rates are calculated as the number of molecules synthesized in a given time, degradation is expressed here as the half-life of the molecule. The RA depends
only on its TR and stability (RS). The PA depends not only on its TLR and stability (PS) but also on the RA. Highlighted in yellow are the variables used in
this study that have been obtained experimentally and in blue those that have been mathematically calculated from other studies.
Gene copy number
Constant
polymerase
speed
Polymerase
density
Individual transcription rate (TRi)
mRNA half-life (RS)
Constant
ribosome
speed
Ribosome
density
Individual
translation rate (TLRi)
Protein half-life (PS)
Protein copy number (PA)
Transcription rate (TR)
Translation rate (TLR)
mRNA copy number (RA)
Genome Biology 2007, 8:R222
Genome Biology 2007, Volume 8, Issue 10, Article R222 García-Martínez et al. R222.4
and TLRi (cell cycle) the relationship is maintained even after
eliminating both the 10% higher and lower data points
(trimmed r
S
= +0.39). We also found a low positive correla-
tion between PA and TR, RA and TLRi, and PS with all the
other variables but RS (numbers in green in Figure 2a).
Whereas the PA-TR positive correlation might be explained
by the link between TR and RA and the link between RA and
PA, the low but statistically significant positive correlations of
PS with all the other variables (except, interestingly, RS) is
noteworthy. On the contrary, RS tends not to be correlated
(numbers in black) or has negative (numbers in red) correla-
tions with the other variables. This is a new finding that will
be discussed below.
To better understand the processes underlying the detected
correlations, we looked for Gene Ontology (GO) categories
enriched in some specific correlations. For this, we first ana-
lyzed the correlations between variables of the same type
(amounts, individual rates and stabilities) by ranking the cor-
responding values for the 4,215, 5,590 and 2,618 genes,
respectively, for which data on mRNA and protein were avail-
able (Additional data files 8 and 13), then divided the list into
quintiles (1 to 5 from higher to lower values) and finally com-
pared the positions of the two analyzed variables for each
gene. The correlations between the three pair-wise compari-
sons were classified into five categories ('very high', 0; 'high',
1; 'medium', 2; 'low', 3; or 'very low', 4) by considering the
absolute difference between the quintile values for the two
variables in each comparison, as described in Materials and
methods. As can be seen in Figure 2b, the 'very high' and
'high' correlation categories were over-represented in RA/PA
comparisons (Χ
2
= 1329.8, df = 4, p < 0.0001) and TR/TLRi
(Χ
2
= 981.7, df = 4, p < 0.0001) but not in those between RS
and PS (Χ
2
= 2.31, df = 4, p = 0.677). From these results, it can
be concluded that cells coordinate the amounts of mRNA and
protein for most genes and that this is achieved mainly
through coordination of the synthesis rates, and not of the
stabilities, for the two molecules.
After looking for GO categories statistically enriched in the
five levels of correlations, we found that some of them were
very significant in the 'high correlation' classes, involving
high abundance or synthesis rates (quintiles 1-2), most nota-
bly cytosolic ribosome, protein biosynthesis, hydrogen trans-
port, redox activity and proteasome, among others (Table 1).
Other GO categories were found only in the abundance, but
not in the rate, classes (for example, carboxylic acid metabo-
lism, ribosome biogenesis, and so on), or in rate classes only
(such as mitochondrial ribosome). There were also GO cate-
gories highly represented in the low abundance and/or rate
classes (quintiles 4-5): cell cycle, DNA metabolism, DNA
binding, regulation of transcription, response to stimulus,
and so on. Many of them were related to regulation or control
processes. The general trend is that amounts of mRNA and
protein are correlated mainly by coordinating their synthesis
rates, either if they correspond to abundant proteins, such as
the ones belonging to macromolecular complexes, or to
scarce ones, such as those involved in regulation.
Some GO categories also appeared significantly over-repre-
sented in the 'low correlation' classes, thus involving compar-
isons between variables from quintiles 4/5 and quintiles 1/2:
ribosome biogenesis, spore wall assembly, glycoprotein bio-
synthesis, and so on, for the high TR/low TLRi; and mem-
brane, transporter, and so on, for the high RA/low PA (Table
1). It is interesting to note that 24 genes from the 'ribosome
biogenesis' category (Additional data file 9) appeared in this
class as well as in the very high correlation class described
above. This means that these genes have very high amounts of
mRNA and protein, a high TLR but a low TR. These last
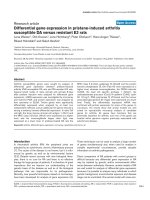
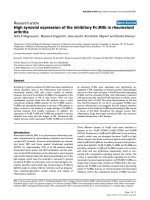
Correlations between variablesFigure 2
Correlations between variables. (a) Spearman rank correlation
coefficients for all pair-wise comparisons between the six variables. All the
correlations were significant (p < 0.001) except those marked as 'ns'. NA,
not applicable. (b) Correlations between variables of the same type.
Correlations were analyzed by ranking the six variables for all the genes,
dividing them into quintiles (1 to 5 from higher to lower values; Additional
data file 7) and comparing the positions of the two analyzed variables for
each gene. Correlations for genes whose variables were included in the
same quintile were considered as 'very high'; if they differed in one unit,
they were considered 'high', and so on. A difference of four units was
considered a 'very low' correlation. The ordinate indicates the proportion
of genes in each correlation category. The expected values (grey) were
obtained from a random distribution of all possible quintile combinations.
(a)
(b)
0.0
0.1
0.2
0.3
0.4
0.5
Very high High Medium Low Very Low
Proportion of genes
RA-PA TR-TLRi RS-PS Expected
RA TR RS PA TLR
i
TLR
TR
0.411
RS -
0.244
0.014
ns
PA
0.568 0.328 -
0.012
ns
TLR
i
0.290 0.461
0.009
ns
0.413
TLR
NA 0.516 -0.192 0.584 NA
PS
0.201 0.230
0.024
ns
0.297 0.251 0.257
RA
PS
-
-
-
-
-
-
-
Genome Biology 2007, Volume 8, Issue 10, Article R222 García-Martínez et al. R222.5
Genome Biology 2007, 8:R222
Table 1
Gene Ontology categories over-represented in some comparisons between variables
Rates Amounts
GO* P
†
a-P
‡
No. of genes
§
GO P a-P No. of genes
High correlation
Both low level
(4-5)
Cell cycle <E-17 <0.001 159/370 Cell cycle <E-7 0.001 112/300
Meiosis <E -6 0.003 52/122 -
Regulation of physiological
process
<E-16 <0.001 204/518 Regulation of
physiological process
<E-10 <0.001 171/459
DNA binding <E -12 <0.001 88/190 DNA binding <E -8 <0.001 66/146
Protein kinase activity <E -13 <0.001 64/117 -
DNA metabolism <E -11 <0.001 158/422 DNA metabolism <E -5 0.017 39/372
Response to endogenous
stimulus
<E -6 0.004 65/164 -
Regulation of transcription <E -10 <0.001 120/298 Regulation of
transcription
<E -6 0.001 99/263
- RNA splicing <E -6 0.002 47/103
Lipid kinase activity <E -5 0.005 8/8 -
Both high level
(1-2)
Cytosolic ribosome <E -24 <0.001 93/147 Cytosolic ribosome <E -78 <0.001 149/156
Protein biosynthesis <E -15 <0.001 179/439 Protein biosynthesis <E -48 <0.001 247/417
Hydrogen ion transporter
activity
<E -6 0.001 25/43 Hydrogen ion
transporter activity
<E -11<0.00133/43
- Carboxylic acid
metabolism
<E -18 <0.001 134/258
Mitochondrial matrix <E -7 0.001 64/150 -
Redox activity <E -8 <0.001 93/228 Redox activity <E -17 <0.001 107/197
Mitochondrial ribosome <E -5 0.01 36/78 -
- Ribosome biogenesis <E -14 <0.001 97/182
Proteasome complex <E -8 <0.001 28/43 Proteasome
complex
<E -13<0.00136/45
Nucleotide metabolism <E -5 0.044 35/79 Nucleotide
metabolism
<E -11<0.00149/79
Endoplasmic reticulum <E -7 0.001 127/356 Endoplasmic
reticulum
<E -07 <0.001 118/290
Hexose catabolism <E -5 0.007 17/26 Hexose catabolism <E -06 0.005 18/26
Protein folding <E -6 0.001 33/62 -
- Cell wall <E -6 0.001 29/50
Low correlation
Low level in RNA
(4/5), high in
protein (1/2)
Ribosome biogenesis <E -5 0.022 24/190
Spore wall assembly <E -6 0.006 10/35
Glycoprotein biosynthesis <E -5 0.01 13/66
Oxidoreductase activity, acting
on the CH-CH group
<E -5 0.019 5/9
Protein amino acid
glycosylation
<E -5 0.046 12/62
Low level in
protein (4/5), high
in RNA (1/2)
- Membrane < E -6 0.001 46/665
- Transporter activity < E -6 0.001 24/246
- Cell wall < E -6 0.002 10/50
- Vacuole < E -5 0.012 15/128
*Comparisons were done as in Figure 2. Then, the genes corresponding to different levels of correlation were divided into groups according to their
expression level and the GOs were searched. Only statistically significant categories are shown. High correlation class includes both very high and
high correlation classes from Figure 2b, while the low correlations include both low and very low correlations classes, also from Figure 2b.
†
Absolute
p value.
‡
Adjusted p value.
§
The number of genes shows how many of the genes in the GO category present among the genes analyzed in each
pairwise comparison are within the selected quintile.
Genome Biology 2007, 8:R222
Genome Biology 2007, Volume 8, Issue 10, Article R222 García-Martínez et al. R222.6
results indicate that some genes use opposite strategies for
mRNA and protein molecules, revealing the existence of sev-
eral different expression strategies for yeast genes.
Clustering of yeast genes according to the six variables
of gene expression
The previous results suggest that functionally related genes
tend to be grouped according to their gene expression varia-
bles. To further explore this possibility, we performed a clus-
tering analysis of the 3,991 genes for which data on at least 5
variables were available (Additional data file 13) as a function
of their RA, PA, TR, TLRi, RS and PS values. We could have
used TLR instead of TLRi, but we chose to use TLRi here
because it is not mathematically linked to RA, thus making
the clustering less prone to artifacts. In any case, using differ-
ent normalization methods, or using TLR instead of TLRi, led
to essentially similar results (not shown). Since the value
ranges for the six variables were quite different, we used the
z-score normalization because it better preserves the original
relative dispersion. As a result, each gene was characterized
by a profile for the arbitrarily ordered (1 to 6: RA-TR-RS-PA-
TLRi-PS) variables, which allowed comparing all the genes
for common profiles using standard clustering methods. For
this we chose the Self-organizing Tree Algorithm (SOTA) [25]
from the GEPAS package [26]. This is a self-organizing neural
network that expands depending on the relationships among
the units being analyzed. The growth nature of this procedure
allows it to be stopped at the desired level of similarity reso-
lution, which is reflected in a higher or lower number of
clusters.
Figure 3 shows the dendrogram obtained by using a variabil-
ity threshold, which produced 25 clusters with this data set.
Other variability thresholds generating different numbers of
clusters were also considered (Additional data file 3) but the
main groupings discussed below were found consistently. The
clusters obtained are represented by an average profile that
describes the relationships between the six variables for a
group of genes. The overall branching pattern of the tree gen-
erated was characterized by two large groups: in one of them
(clusters 1-8) most clusters showed profiles in which rates
(points 2 and 5 in the profile) were higher than stabilities
(points 3 and 6). These clusters were enriched mainly in
genes coding for subunits of large macromolecular com-
plexes, such as cytosolic and mitochondrial ribosomes and
the proteasome. The absolute p values were strikingly more
significant than in the second group (Additional data file 10);
for example, cluster 8 had 72 of the 125 cytosolic ribosome
genes analyzed with a p value of 10
-98
. Ribosome biogenesis
(cluster 3, p = 10
-22
), amino acid metabolism (cluster 3, p =
10
-7
), transcription (cluster 7, p = 10
-11
), and mitochondrial
ribosome (cluster 4, p = 10
-5
) were other highly significant
categories. The second large group included clusters in which
RS tended to be higher than TR. These clusters (11-23) were
enriched in several GO categories with relatively low p values:
DNA metabolism (cluster 11, p = 10
-5
), chromosome segrega-
tion (cluster 11, p = 10
-5
), and carboxypeptidase (cluster 20, p
= 10
-5
) were the most relevant. Additional levels of variability-
based clustering were investigated using the CAAT program
[26]. This method allows selecting the best clustering level
according to variability parameters and then looking for sta-
tistically significant GO categories. The analysis resulted in
the finding of additional clusters at both higher and lower lev-
els than those shown in Figure 3. For instance, clusters 3, 7
and 11 could be split into smaller ones (Additional data files 4,
5 and 6) to which some specific categories could be assigned.
The finding of many groups of functionally related genes or
whose proteins form macromolecular complexes clustering
together suggests that the yeast S. cerevisiae uses CES in
order to coordinate its physiological functions.
Detailed analysis of functional groups
Since many clusters in Figure 3 contained functionally related
genes, we hypothesized that the profiles described above
could be taken as signatures of the corresponding CES. Given
the appearance of macromolecular complexes as significant
categories, we performed a supervised analysis of some of the
stable complexes of the Munich Information Center for Pro-
tein Sequences (MIPS) list and other GO categories. Figure 4
shows the profiles, in this case using percentile order and
TLR, of some biologically relevant groups. We used percentile
order to better show features for each functional group. The
TLR was selected here instead of TLRi because it reveals bet-
ter the relative importance of rate and stability in the final PA.
The graphs represent the average value of the percentile for
each variable and its associated standard error. We denote
this signature profile as 6VP. A distinctive common pattern
could be clearly observed for some groups. These were those
tending to have values for TR and TLR higher than RS and PS
(rates higher than stabilities) and corresponded to stable
macromolecular complexes. The error associated with each
variable was always lower than that expected for a group of
the same number of randomly selected genes. This can be
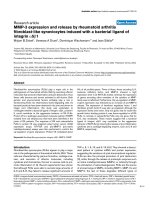
Cluster analysis of the z-score values for the six variablesFigure 3 (see following page)
Cluster analysis of the z-score values for the six variables. A SOTA dendrogram is shown. Circle size and the number to the left of the circles indicate gene
cluster size. Each gene is characterized by a profile arbitrarily ordered (1 to 6) as RA-TR-RS-PA-TLRi-PS that allows comparison of all the genes for similar
profiles. In the right margin of the tree the GO terms that appear significantly over-represented among the genes contained in the corresponding cluster(s)
are indicated. The complete list of GO terms and p values is given in Additional data file 9. Note that clusters 1-8 correspond to genes showing prevalence
of stabilities over synthesis rates and that the second large branching (clusters 9-25) corresponds to genes showing a prevalence of RS (variable 3) over TR
(variable 2). The grey line in each cluster graph corresponds to zero. The horizontal branch length reflects the degree of variability between clusters.
Genome Biology 2007, Volume 8, Issue 10, Article R222 García-Martínez et al. R222.7
Genome Biology 2007, 8:R222
Figure 3 (see legend on previous page)
Genome Biology 2007, 8:R222
Genome Biology 2007, Volume 8, Issue 10, Article R222 García-Martínez et al. R222.8
seen by comparing the error bars for each variable in each
group (color) with the error bars of random groups (grey). A
list of numerical average values for each group and the ran-
dom control can be seen in Additional data file 12. The most
relevant feature was that relative RS was always lower than
RA and TR. Only some specific complexes (for example, ana-
phase promoting complex (APC), spliceosome) had a differ-
ent pattern. Other functionally related groups, not forming
stoichiometric complexes, had RS similar or higher than TR
(right column in Figure 4; the genes in these groups were
included in clusters 11-24 in Figure 3). There seemed to be no
obvious relationship between biological noise (DM, as calcu-
lated by Newman et al. [4]) and the kind of 6VP (results not
shown). Cytosolic ribosomal proteins were one of the most
uniform groups (Figures 3 and 4). Nevertheless, as shown
also in Figure 3, six genes encoding proteins of this group
showed a variant profile characterized by an inversion of the
respective levels of TR and RA (cluster 6). We have not been
able to put forward an explanation for the variant pattern
observed in those ribosomal proteins.
Comparison of mRNA and protein patterns
The plots in Figures 3 and 4 show that mRNA variables
(points 1-3) were less balanced than those of the protein. To
test whether this is a feature of only some groups or a general
characteristic of yeast gene profiles, we made several statisti-
cal analyses using TLR data.
First, given that RS seemed to be lower than TR for many
groups, we analyzed the whole gene set (Table 2). Although
genes with TR > RS were slightly more abundant than
expected, the difference was not statistically significant. How-
ever, it is true that genes with a lower TR than RS were less
common than expected and that those for which TR = RS
were more frequent than expected. This trend was more
marked when using only genes from the MIPS set of protein
complexes. The analyses for protein profiles showed that they
tended to be less unbalanced than those of mRNA, with a
highly significant excess of genes with TLR = PS. This
prompted us to analyze the whole profiles, including amounts
of both products (RA and PA). It can be seen in Table 3 that
both mRNA and protein had a significant excess of flat
profiles, although this effect was much more important for
protein. Similar results were obtained classifying genes into
ten instead of five categories (results not shown).
The fact that mRNA profiles were more unbalanced than pro-
tein ones could be a consequence of strategies favoring regu-
lation at the transcription level. To test this hypothesis, we
calculated the average fold-change of yeast genes in the study
of Gasch et al. [14] in which cells were analyzed under many
different conditions that favored changes in gene expression.
It can be seen in Figure 5 that the increase in the difference
TR - RS tends to be positively correlated with fold-change.
The slope of the graph is significantly different from 0
(b = 0.080; standard error = 0.005; t = 16.24; p < 0.001).
Discussion
The yeast S. cerevisiae is considered to be the first organism
for which a comprehensive description of most gene products
and their functional integration will be obtained [27]. The
reason for this is that functional genomics methods are pro-
viding systematic information about many steps in the path-
ways of gene expression flow. In this organism, for the first
time in biology, there are estimates of the amounts of protein
and mRNA as well as their synthesis rates and stabilities at a
genomic scale. We have used data previously published by
our [19] and other groups [8,9,17,18,20,22] for TR, RA, RS,
PA, TLRi and PS together with our computations from previ-
ous experimental data [20] of TLR. As a result, we have
obtained comprehensive information about the genetic
expression flow for 5,968 yeast genes (Additional data files 8
and 13), with at least two of the above variables being
compared.
As indicated previously, the quality of the data used in this
analysis was variable. For instance, RA data calculated from
DNA microarrays are thought not to be reliable below
approximately 1 molecule/cell [28]. PA data are probably
even less accurate [8]. As discussed by Jansen and Gerstein
[29], functional genomics data sets contain a high degree of
experimental uncertainty because they have a high amount of
error and noise. The use of these data sets can also be ham-
pered because the results were obtained by different labora-
tories under non-identical growth conditions. We decided to
use normalized data to avoid problems related to the
uncertainty of absolute values and the comparison of data
measured in different scales. Since experimental error and
noise should randomize the data, then no statistically signifi-
cant results should be expected after analyses such as ours.
However, our results demonstrate that, even using data from
diverse sources, global analyses can benefit from the integra-
tion of many data, leading to biologically meaningful
conclusions.
To our knowledge, no previous studies have performed
exhaustive comparisons among these variables as described
here. Single comparisons between RA and PA in yeast have
been done previously [4,8,9,11-13,17,18,30]. Correlation coef-
ficients were significant but not very high. For some groups of
genes the correlation is low, which has been interpreted as an
indication of post-transcriptional regulation [11].
Nevertheless, there are important differences between differ-
ent functional groups. The general conclusion of these simple
comparisons was that there is a significant positive correla-
tion between the amount of a protein and that of the mRNA
encoding it. We postulate here that it is mainly due to the
coordination between their synthesis rates (see below). We
previously made a simple comparison between TR and RA
[19]. The positive correlation found was not unexpected
because it is commonly accepted that mRNA amounts depend
directly on their synthesis rates. Beyer et al. [17] performed a
different kind of analysis, centered on functional categories,
Genome Biology 2007, Volume 8, Issue 10, Article R222 García-Martínez et al. R222.9
Genome Biology 2007, 8:R222
Figure 4 (see legend on next page)
Nucleosome
b
n = 8
Cytosolic ribosome
a
n = 137
Mitochondrial ribosome
a
n = 67
Proteasome
b
0.0
0.2
0.4
0.6
0.8
1.0
Subcomplex 20S Subcomplex 19S
n = 14, 19
TOM-TIM
a
n = 16
Energy pathways
a
0.0
0.2
0.4
0.6
0.8
1.0
Glycol + Gluconeo TCA Fermentation
n = 41, 31, 33
Spliceosome
a
n = 30
Nuclear pore
a
n = 48
Mitosis
a
n = 145
APC
a
n = 16
Vacuole
b
n = 18
Transcription factors
a
SAGA complex
a
n = 17
90S Processosome
c
n = 52
RNA polymerases
a
n = 23
n = 145
Respiratory complexes
a
Exosome
a
Replication complexes
b
n = 14
n = 55
n = 9, 9, 17
0.0
0.2
0.4
0.6
0.8
1.0
COX Cit b/c ATP synth.
0.0
0.2
0.4
0.6
0.8
1.0
0.0
0.2
0.4
0.6
0.8
1.0
RA TR RS PA TLR PS
0.0
0.2
0.4
0.6
0.8
1.0
0.0
0.2
0.4
0.6
0.8
1.0
0.0
0.2
0.4
0.6
0.8
1.0
0.0
0.2
0.4
0.6
0.8
1.0
0.0
0.2
0.4
0.6
0.8
1.0
0.0
0.2
0.4
0.6
0.8
1.0
0.0
0.2
0.4
0.6
0.8
1.0
0.0
0.2
0.4
0.6
0.8
1.0
0.0
0.2
0.4
0.6
0.8
1.0
0.0
0.2
0.4
0.6
0.8
1.0
0.0
0.2
0.4
0.6
0.8
1.0
0.0
0.2
0.4
0.6
0.8
1.0
0.0
0.2
0.4
0.6
0.8
1.0
Genome Biology 2007, 8:R222
Genome Biology 2007, Volume 8, Issue 10, Article R222 García-Martínez et al. R222.10
of the TLR-PA comparison. TLR can change depending on the
RA but also independently of it in some genes [10]. Belle et al.
[9] also made a comparison between PS, TLR and PA. They
found positive correlations between PA and the other two var-
iables. Lu et al., [11] made comparisons between PA and TR,
TLR and TLRi. They found positive correlations in all cases.
We have explored several ways to normalize the data before
comparing them. For correlation analysis we chose to rank
every variable because, in this way, the relative position
within the cell physiology of each gene allows an easier anal-
ysis of the positions of specific GO classes. We have found
that, apart from confirming the positive correlations cited
above, there is a significant, high positive correlation between
TLRi and TR. Since RS and PS are not correlated (Figure 2a),
it can be concluded that the main determinant of the observed
correlation between the amounts of mRNA and protein is the
coordination of their synthesis rates.
The negative correlation between RA and RS is interesting.
Wang et al. [22] did not find any correlation using similar
data. This could be due to their use of Pearson correlation
whereas we have used Spearman rank correlation, which is
less sensitive to noise in individual data sets. A negative cor-
relation like this one has been observed for Escherichia coli
[30] and for the archaeon Sulfolobus [31]. The low mRNA sta-
bility of highly transcribed genes in these organisms was par-
tially interpreted as a feature for noise minimization and a
way for rapid adaptation to environmental changes. Here, we
have found a negative correlation between RS and TR in S.
cerevisiae. Thus, it seems likely that free-living organisms use
similar strategies with regard to mRNA stability.
A negative correlation between TLR and RS was also found.
Because TLR is the product of TLRi and RA, this can be the
result of the negative correlation of RA and RS and the lack of
correlation between TLRi and RS. However, no correlation
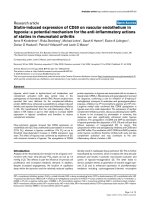
Average 6VP for some functional groupsFigure 4 (see previous page)
Average 6VP for some functional groups. The color lines represent average rank values for each variable. Grey lines represent average values of 1,000
random samplings with the same sample size as the analyzed functional group. They have been omitted in some graphs for clarity. Bars in the graphs
represent the standard error. n, indicates the number of genes in each group. Some additional 6VP graphs are shown in Additional data file 5. Sources for
the different groups are: a, GO categories; b, MIPS complexes; c, Straub et al. [40].
Table 2
Statistical analyses for predominance of rates or stabilities in protein or mRNAs
Total MIPS complexes
Pattern Observed Expected Observed Expected
TR > RS 1050 (24.6%) 1025 (24%) 454 (27.1%) 402 (24%)
TR < RS 925 (21.7%) 1025 (24%) 331 (19.8%) 402 (24%)
TR = RS 2296 (53.8%) 2221 (52%) 891 (53.2%) 872 (52%)
TLR > PS 722 (21.6%) 802 (24%) 316 (21.5%) 352 (24%)
TLR < PS 539 (16.1%) 802 (24%) 212 (14.4%) 352 (24%)
TLR = PS 2080 (62.3%) 1737 (52%) 941 (64.1%) 765 (52%)
Statistically significant observed values are highlighted: bold, over-represented; italics, under-represented.
Table 3
Analyses of the flatness of the patterns
Pattern Observed Expected
Flat RNA 1182 (27.69%) 990 (23.2%)
Non-flat RNA 3086 (72.30%) 3278 (76.8%)
Flat protein 1371 (42.8%) 720 (23.2%)
Non-flat protein 1731 (57.2%) 2382 (76.8%)
Statistically significant observed values are highlighted: bold, over-represented; italics, under-represented.
Genome Biology 2007, Volume 8, Issue 10, Article R222 García-Martínez et al. R222.11
Genome Biology 2007, 8:R222
between RS and TR and a positive correlation between ribos-
ome density and ribosome occupancy (both components of
TLRi) and RS [15] have been found in S. pombe. We do not
know whether this reflects a truly different behavior between
these two yeast species or it is due to the small and biased
number of mRNAs (only the 868 least stable ones) for which
RS was calculated in that study.
To further verify the consistency of the groupings obtained
with these analyses, we tried different clustering methods.
For clustering analysis we assayed several normalization pro-
cedures, including ranking and a range of normalizing trans-
formations, and different clustering methods: PCA, k-means,
and hierarchical unsupervised growing neural networks. We
found that z-score normalization and SOTA hierarchical clus-
tering [25,26] produced the best results in terms of recovery
of significant GO categories. This reasoning is considered to
be the best method to evaluate the quality of clustering proto-
cols [32]. In any case, the general conclusions obtained after
clustering were the same regardless of the algorithm used. We
are aware that our method has an unavoidable bias due to the
identical weight assigned to the six variables, but this affects
similarly all categories found and, in consequence, cannot
produce biases in the recovery of GO categories.
The SOTA clustering of z-score vectors for the 3,991 genes
considered (Additional data file 13) yielded a tree with two
main subgroups (Figure 3). Many clusters were enriched in
specific GO categories (Additional data file 9). The relative
relevance of each variable is reflected in the different profiles,
in which, because of the z-score normalization, the six varia-
bles are directly comparable. Moreover, since the analysis has
been made for all the genes simultaneously, it demonstrates
that functionally related genes tend to use similar strategies
for their expression. We have introduced the acronym CES to
denote this observation.
Clusters in the upper part of the tree in Figure 3 contain many
more significant GO categories and with higher significant p
values than those in the lower part. The 6VP defining the
upper clusters are characterized by synthesis rates for either
mRNA, protein or both ranking higher than the correspond-
ing stabilities. These clusters are enriched in GO terms for
large, stoichiometric and stable cellular protein complexes,
such as cytosolic ribosome, mitochondrial ribosome or pro-
teasome. Some of these groups are specifically analyzed in
Figure 4. Histones represent one of the most extreme behav-
iors. Their profile (nucleosome) is similar to others in the
'higher rates' branch from Figure 3. They show extremely
high synthesis rates and amounts of mRNA and protein and
low RS. However, the small size of this group (eight genes)
precludes statistical relevance. Other protein complexes, such
as TOM-TIM, ATP synthase, RNA polymerases, cytosolic
ribosome, exosome and proteasome, have a 6VP of the same
type, but not so strongly marked. The mitochondrial ribos-
ome, the 90S processosome (Figure 4) and the vacuolar
ATPase (Additional data file 7) also show slight variations
from that common 6VP profile. Some other GO categories not
forming stable complexes, such as 'translation' and 'glycopro-
tein biosynthesis', also have a 6VP similar to this one (Addi-
tional data file 7).
Using the MIPS classification, we found an enrichment of
genes belonging to protein complexes in the profiles with a
predominance of TR over RS (Table 2). It is accepted that pro-
teins belonging to the same complex must be present in sim-
ilar amounts because the excess of any subunit would be
wasteful (see [33]). Therefore, coordination of the corre-
sponding PAs is to be expected. However, many (perhaps all)
protein complexes in the cell are formed by subunits that are
not exclusive to only one complex, being included in other
complex(es) as well. Some studies on yeast complexes have
shown that a core or protein sub-complex of highly co-
expressed and functionally related subunits exists and that
this core is surrounded by less cross-related, 'halo' proteins
[33,34]. Additionally, some complexes are transient while
others are permanent [33]. Our results show that the large
and permanent complexes correspond to the best-clustered
groups and that they tend to have higher TR than RS. Fraser
et al. [3] found that genes belonging to protein complexes
have less biological noise than average because of a high TR
and low number of 'transcriptions per mRNA', which implies
low RS. Thus, it seems that one reason for common 6VPs in
members of some complexes could be the need for low noise.
Previously, it has been found in some studies that genes for
the cytosolic and mitochondrial ribosomes and the
proteasome subunits behave coordinately with respect to TR,
RA and/or RS [19,23,33]. On the other hand, Wang et al. [22]
found that subunits of the main cellular complexes, including
both kinds of ribosomes, the nucleosome and the proteas-
Analysis of transcriptional regulationFigure 5
Analysis of transcriptional regulation. Sliding window representation of
absolute percentile difference between TR and RS variables (x-axis) against
fold-change average (y-axis) from comprehensive expression analysis of
stress conditions by Gasch et al. [14] for the 1,050 genes having a
prevalence of TR over RS after quintile subdivision (Table 2). The width of
the window was 200 genes.
r = 0.49
1.4
1.45
1.5
1.55
1.6
0.20.30.40.50.60.70.80.9
Percentile difference (TR - RS)
Fold-change
Genome Biology 2007, 8:R222
Genome Biology 2007, Volume 8, Issue 10, Article R222 García-Martínez et al. R222.12
ome, have similar RS. We have found that other variables,
such as PA and TLR, are also conserved for such complexes.
We can conclude that, in general, the whole 6VP is very uni-
form for the members of these permanent complexes. This
result is also observed for other smaller complexes (Figure 4)
and for other functionally related genes also found in the clus-
ters obtained with the SOTA algorithm (Figure 3).
The predominance of rates over stabilities (especially TR over
RS) shown by the groups in the upper part of the tree (Figures
3 and 4) is a strategy that favors speed over economy in the
response, because the amount of the macromolecule is con-
trolled by relatively high rates of synthesis and degradation.
This strategy has a higher energy cost but it allows rapid
responses due to the relatively low stability of the macromol-
ecule. It is, perhaps, more useful for free-living organisms
than for higher eukaryotes, since the latter have evolved many
other physiological mechanisms to rapidly adapt to changing
environmental conditions. A prediction of this hypothesis is
that genes with TR > RS will be significantly more regulated
than the average. This is the actual result we found using data
from a set of 142 experiments [14] in which a large set of
changing growth conditions was analyzed (Figure 5). The
trend for genes to be more regulated at the transcriptional
level seems to be more pronounced for those having a TR - RS
difference higher than 0.5. In any case, strategies with a prev-
alence of rates for protein (TLR > PS) and mRNA (TR > RS)
are not frequent among the whole set of yeast genes. In fact,
the number of genes with TLR > PS is lower than expected
(Table 2).
The lower part of the tree in Figure 3 is enriched in some GO
categories. The common signature of these groups is that
their RS is higher than the corresponding TR. This strategy is
less common than expected by chance, especially for genes
belonging to MIPS complexes (Table 2) and it represents an
opposite strategy to that used by the groups described above.
It favors economy over speed in the response at the mRNA
level. This would be appropriate for genes that should not
have to respond rapidly or that are regulated post-transcrip-
tionally or, even, post-translationally, such as most metabolic
enzymes.
It is interesting to analyze in more detail the group 'Energy
pathways' in Figure 4. It comprises a set of very abundant
proteins from the functional categories 'TCA cycle', 'glycolysis
and gluconeogenesis' and 'fermentation' that behave simi-
larly. Their PA is almost at the level of cytosolic ribosome pro-
teins. However, they present a totally different strategy.
Abundant mRNAs are obtained using a lower TR than for
ribosomal proteins but with quite high messenger stabilities.
In fact, the GO categories related to energy derivation from
carbohydrates are the ones showing the highest RS (Addi-
tional data file 13). It is clear that the cell spends much less
energy maintaining the level of these mRNAs. The price
would be that their RAs change more slowly, but this might
not be a priority for the cell. Energy generation processes are
almost equally necessary at all times. A prediction is that this
kind of 6VP will be more common in higher eukaryotes for the
same reasons pointed to above. Some other groups have very
low PS compared to TLR, such as TOM-TIM, RNA polymer-
ases, cytochrome oxidase, 19S proteasome (Figure 4), as well
as the glycoprotein biosynthesis, translation and vacuolar
ATPase (Additional data file 7). Therefore, using the same
reasoning as for transcription, their corresponding genes are
also candidates to be regulated at the translational level.
To obtain the desired RA or PA, the most important factor
seems to be the synthesis rate. This is reflected in the positive
correlations observed between RA, PA, TR and TLR (Figure
2). However, mRNA is not the final goal of the gene expres-
sion, a role that corresponds to the protein. This establishes a
clearly different role for mRNA and protein in gene expres-
sion. Our comparisons show that, in yeast, these different
roles can be mirrored by the different behavior of protein and
mRNA sub-profiles and, especially, by the different behaviors
of RS and PS.
It seems that whereas PS works in the same direction as TLR
to control PA, which is, therefore, positively correlated with
amounts and rates, RS works in the opposite direction for
most genes. Among the possible expression strategies, those
with less stable molecules are more costly but allow faster
tracking of environmental changes [24]. In this way, strate-
gies with relative low RS or PS are only appropriate for genes
expected to need rapid expression changes. The costs for low
RS and for low PS are, however, very different. Translation
requires much more energy than transcription. For a stand-
ard yeast gene, transcription consumes six ATP molecules per
triplet for a mRNA molecule, while translation consumes four
ATP molecules per amino acid. However, on average, mRNAs
are six times less stable than proteins (26 minutes versus 154
minutes) and the mean number of protein molecules per
mRNA molecule for a yeast gene ranges from 4,000 [17] (our
data) to 5,600 [11]. This means that costly strategies for
mRNA may be economical and efficient if they allow for a fast
change in the amounts of mRNA to minimize translation
costs. In Figure 4 it can be seen that most cellular complexes
formed by abundant proteins (ribosomes, proteasome, nucle-
osome, and so on) follow strategies characterized by a rela-
tively low RS. All these complexes require a tight regulation of
PA because they form abundant cellular machines that are
expensive to maintain.
Protein variables show less unbalanced profiles than their
mRNA counterparts. The average standard deviation (SD) for
PA-TLR-PS, expressed as percentile values, is 0.196 while for
mRNA it is 0.235 (Additional data file 13). The smoothness of
the protein profile is even more pronounced in the group of
very highly correlated genes (Figure 2b), with an average SD
of 0.163. Although 'flat' profiles for mRNA are more abundant
(27.69%) than expected (23.2%), this is especially striking for
Genome Biology 2007, Volume 8, Issue 10, Article R222 García-Martínez et al. R222.13
Genome Biology 2007, 8:R222
proteins (42.8% versus 23.2%; Table 3). All these data indi-
cate that protein variables tend to be less unbalanced than
those of mRNA. Whereas this cannot rule out the existence of
regulatory mechanisms at the protein level, it clearly
indicates that a 'compensatory rate-stability mechanism',
common for mRNAs, is not that common for proteins. More-
over, the comparison of mRNA and protein profiles for some
groups suggests that there is more regulation of these genes at
the transcription (including both TR and RS) level. This has
been shown to be the case for ribosomal proteins in yeast,
contrary to that found in bacteria, S. pombe and mammalian
cells (discussed in [6,35,36]). Interestingly, in the evolution-
arily distant yeast S. pombe, ribosomal protein mRNAs do not
belong to the short-lived class [36], opposite to S. cerevisiae,
which supports the idea that the expression of S. cerevisiae
genes is mainly controlled at the transcription level [6]
whereas in S. pombe this is at the translation level [15,36].
Given the similarity to 6VP profiles from the other large pro-
tein complexes, we suggest that this could also be the case for
many of their components. For instance, it has been
described that transcriptional regulation (both TR and RS)
controls the genes of the proteasome and 90S processosome
[37]. The important role for RS in this kind of regulatory
mechanism might explain the surprising finding that RS
seems to be tightly coordinated for these protein complexes
[22].
Conclusion
We propose that the analysis of all the variables that affect the
flow of gene expression is a useful strategy to investigate the
regulatory strategies used by a cell. We conclude from our
study that the synthesis rates for both mRNA and protein are
the main determinants of the amount of the respective mole-
cules and that yeast cells use CESs for genes acting in the
same physiological pathways. This feature is more clearly
shown for genes coding for large and stable protein com-
plexes, such as the ribosome or the proteasome. Hence, each
functional group can be defined by a 6VP that illustrates the
common strategy followed by its members. For many groups
whose genes encode subunits of protein complexes, there is a
tendency to have relatively unstable mRNAs and a more
unbalanced profile for mRNA than for protein, which sug-
gests a stronger regulation at the mRNA level.
Current knowledge from other model organisms, such as S.
pombe [15], indicates that the CES can be different for spe-
cific gene groups in different organisms. We anticipate that
differences in CES will be even stronger for the different cell
types of higher eukaryotes, a result of the large differences in
their living environments.
Materials and methods
Selection and features of the original data
Many studies have produced RA data from S288c-type yeast
strains growing in YPD medium. For our analyses we chose
the reference set constructed by Beyer et al. [17], who used 36
microarray experiments normalized and corrected for satura-
tion effects using SAGE data [16]. This data set comprises
6,297 protein-coding genes, with 6,117 genes remaining after
filtering dubious open reading frames (classified by the Sac-
charomyces Genome Database; Additional data file 8). In the
case of RA data, as in others described later, we also made
several tests using other less refined data sets [19,22]. No
major variations in the results obtained were found (not
shown). For TR/TRi, the only experimental data set available
was obtained using the Genomic Run-On methodology [19].
This data set comprised 5,828 genes (5,669 after filtering).
For mRNA stability, several genomic calculations using either
drug inhibition of RNA polymerase II or the rpb1-1 thermo-
sensitive mutant and temperature shift were available. We
used the overall RNA data set of [22] but other data sets
[19,23] were tested and, again, no relevant differences were
found. This data set comprised 4,677 genes (4,544 after filter-
ing). For PA, we used the reference set constructed by Beyer
et al. [17] using data from several sources. This set included
4,243 genes (4,239 after filtering). For TLRi calculation, we
used ribosome density data [17] assuming a constant ribos-
ome speed. To derive TLR values, we multiplied TLRi by the
RA data described above. This data set comprised 6,154 genes
(5,968 after filtering). Finally, for PS we used the recent set of
3,370 proteins (3,367 after filtering) [9]. The whole data set
comprised 6,173 genes, for 3,991 of which there were data on
at least 5 of the 6 variables considered (Additional data files 8
and 13).
The quality of the different data sets was variable. RA data are
quite robust because they were obtained by averaging results
from many different sources and, moreover, they were nor-
malized and corrected [17]. TR, RS and PS data were obtained
from a single measurement; however, they were verified by
comparison with previously determined individual data for
some genes [9,19,22]. TLRi, and consequently TLR, data were
obtained by averaging two data sets [17]. TLR data have the
problem that they were calculated indirectly by multiplying
experimentally determined data (the RA and TLRi data sets).
This adds the mathematical error associated with these oper-
ations and the disadvantage that TLR and RA are not inde-
pendent. PA data are the average of data obtained using very
different techniques (epitope tagging, multidimensional pro-
tein identification technology, and two-dimensional electro-
phoresis [8,17,18]). In spite of this, PA data are less robust
than RA data because they are based on fewer measurements
and because the techniques used are less accurate than SAGE
and DNA microarrays.
For the analyses, we have used a z-score or a percentile nor-
malization to avoid the high dispersion in the unit ranges
Genome Biology 2007, 8:R222
Genome Biology 2007, Volume 8, Issue 10, Article R222 García-Martínez et al. R222.14
among the different variables. In this way data retained their
relative magnitude within each variable and were directly
comparable across variables, thus reducing computation arti-
facts and enabling easier comparisons and interpretations.
Cluster analyses
We have used a range of statistical methods for identifying
sets of genes with similar expression patterns. The two main
approaches correspond to grouping or classifying genes
according to their expression patterns and to represent them
in a reduced dimension space. Characteristic global profiles
were established by means of cluster analysis using the data
set of z-score normalized values for the six variables (as men-
tioned in the Results section) for a total of 3,991 yeast genes
for which data for at least 5 variables were available (Addi-
tional data file 8).
For cluster analysis we used the SOTArray tool (included in
the Gene Expression Pattern Analysis Suite v 3.0 (GEPAS)
[26] from the worldwide web server of the CIPF
Bioinformatics Unit) using the linear correlation coefficient
among the six-variables vectors as distance between genes.
The tree was allowed to grow until producing 20, 25 or 30
clusters. Alternative clustering methods were also applied to
the same data set. We used k-means clustering [38] with a
variable number of clusters from 2 to 25.
In order to validate the quality of the previous clustering pro-
cedure, we used the Cluster Accuracy Analysis Tool (CAAT
1.0), also included in the GEPAS package. We calculated a 'sil-
houette width' for each internal node. This index represents
how well each cluster is separated from its direct sister
groups; that is, how close are items contained in this cluster
(intracluster distance), and how far they are from the sister
clusters (intercluster distance). Values for silhouettes range
from -1.0 (very bad split) up to 1.0 (excellent split). Values
near 0.0 indicate indifferent split. Cluster subdivision was
stopped when the silhouette value was not improved in two
consecutive divisions.
Gene Ontology category searches
To test the potential enrichment in GO categories in the dif-
ferent groupings obtained in this study (clusters from SOTA/
CAAT trees, correlation groups, and so on), we used the Fun-
cAssociate server [39], which uses a Monte Carlo simulation
approach and accepts only significant GO categories accord-
ing to their adjusted p value (computed from the fraction of
1,000 simulations under the null-hypothesis with the same or
smaller p value and after correction for multiple simultane-
ous tests). Only GO categories with an adjusted p value below
0.05 were considered to be significant.
Correlation analyses
In order to test for genes having similar values for a given pair
of variables, we ranked and ordered the values for each varia-
ble, and divided the distributions in quintiles (note that for
each pair-wise comparison, the maximum number of gene
pairs was considered; thus, the number of genes in each par-
tition depended on the number of genes present in each com-
parison). Genes belonging to the upper quintile were
numbered as 1, genes from the second quintile were num-
bered as 2, and so on, down to the lowest variable values,
included in the quintile numbered as 5. When comparing two
variables we classified genes into five correlation categories
depending on their quintile difference. Thus, we established
five correlation quality categories: 'very high', for genes hav-
ing the same quintile value in both variables (five possible
combinations); 'high', for genes differing in one quintile unit
(eight possible combinations); 'medium', when the quintile
difference was 2 (six combinations); 'low', for three unit dif-
ferences (four combinations); and 'very low' for the cases of
quintile differences of four units (two combinations).
Searches for enrichment in specific GO categories were per-
formed as described above.
To test the global correlation between all pair-wise combina-
tions of the six variables, Spearman rank correlation coeffi-
cients were calculated.
Six variable profiles
We also investigated whether different functionally related
gene groups (MIPS complexes, GO categories, and the proc-
essosome complex as defined by Staub et al. [40] tended to
have similar values in the six variables considered in this
study. Thus, we used the rank (percentile) ordered values for
the six variables for different related genes. We calculated the
average rank value (percentile) and represented these values
for the six variables ordered as RA, TR, RS, PA, TLR, PS,
yielding a 'profile' for each group studied. We calculated also
the standard error associated with each average and repre-
sented in the profile as error bars. These values were obtained
by random sampling (1,000 replicates) among the genes hav-
ing data for the six variables. Resampling group sizes were
equal to that of genes in each considered group and subse-
quent computation of average and standard deviations for
each variable. An estimation of the average standard devia-
tions (aSE) for the six variables was calculated for each group
(Additional data file 12).
Comparison of mRNA and protein profiles
For comparing mRNA and protein profiles, we used the quin-
tile classification of genes as for correlation analyses (Figure
2b and Additional data file 13). We considered prevalence of
a variable over another if they differed in two or more quin-
tiles. Differences of 1 or 0 quintiles were considered to be
equal. This was done for all genes and for the genes forming
protein complexes according to MIPS. Only complexes with
more than two proteins were considered (Additional data file
13). Statistically significant differences between observed and
expected values (considering all possible combinations by
chance) were established by applying a Chi-square test (Table
2).
Genome Biology 2007, Volume 8, Issue 10, Article R222 García-Martínez et al. R222.15
Genome Biology 2007, 8:R222
Prevalence of flat patterns in mRNA and protein was studied
separately by considering a flat pattern when the difference in
quintile value among the most extreme variables for each
molecule was less than three. Similarly, expected values were
established by considering all the possible quintile combina-
tions between the three variables for each molecule, and the
statistical significance of the differences was assessed by
means of a Chi-square test (Table 3).
Test for transcriptional regulation
In order to test for the transcriptional regulation level among
the genes with a prevalence of TR over RS, we selected the
genes for which that premise occurred (1,050 genes with TR
> RS from Table 2). We represented in a 200-gene-wide slid-
ing window the average fold-change in many stress condi-
tions in the comprehensive study by Gasch et al. [14] versus
the percentile difference between TR and RS (TR - RS). The
statistical significance of the slope was assessed by means of
a t-test.
Abbreviations
6VP, six variable profile; CAAT, Cluster Accuracy Analysis
Tool; CES, common expression strategy; GO, gene ontology;
MIPS, Munich Information Center for Protein Sequences;
PA, protein amount; PS, protein stability; RA, mRNA
amount; RS, mRNA stability; SOTA, Self-organizing Tree
Algorithm; TLR, translation rate; TLRi, individual transla-
tion rate; TR, transcription rate; TRi, individual transcription
rate; YPD, yeast extract-peptone-dextrose culture medium.
Authors' contributions
JP-O conceived the original idea and designed the experi-
ments. JG-M collected and curated the data sets and per-
formed most of the analyses. FG-C performed some of the
statistical analyses and supervised the computer methods.
JP-O wrote most of the paper, and JG-M wrote the experi-
mental section and FG-C corrected it. All three authors exten-
sively discussed the results and their interpretation and
approved the final version.
Additional data files
The following additional data are available with the online
version of this paper. Additional data file 1 is a figure showing
a plot of abundance and stability for mRNA and protein mol-
ecules. Additional data file 2 is a figure showing clustering
similar to that shown in Figure 3 but with 20 clusters. Addi-
tional data file 3 is a figure showing clustering similar to that
shown in Figure 3 but with 30 clusters. Additional data files
4, 5, 6 are figures showing further analysis of some large clus-
ters (3, 7 and 11, respectively) from Figure 3. Additional data
file 7 is a figure showing 6VP for some other functional cate-
gories not shown in Figure 4. Additional data file 8 is a table
showing a summary of numerical data used in the paper.
Additional data file 9 is a table listing ribosome biogenesis
genes that appear within the low correlation class in Figure
2b. Additional data file 10 is a table providing the complete
list of significant GO categories found in clusters from Figure
3. Additional data file 11 is a table providing the complete list
of significant GO categories found in clusters from Additional
data files 2 and 3 and not present in Figure 3. Additional data
file 12 is a table listing the standard error averages calculated
for experimental (aSEe) and random sampling (aSEr) estima-
tions for the functionally related groups from Figure 4. Addi-
tional data file 13 is a table listing values for the six variables
of the 6,173 genes analyzed. Additional data file 14 the
description and comments of the figure shown in additional
data file 1.
Additional data file 1Plot of abundance and stability for mRNA and protein moleculesPlot of abundance and stability for mRNA and protein molecules.Click here for fileAdditional data file 2Clustering similar to that shown in Figure 3 but with 20 clustersClustering similar to that shown in Figure 3 but with 20 clusters.Click here for fileAdditional data file 3Clustering similar to that shown in Figure 3 but with 30 clustersClustering similar to that shown in Figure 3 but with 30 clusters.Click here for fileAdditional data file 4Further analysis of cluster 3 from Figure 3Further analysis of cluster 3 from Figure 3.Click here for fileAdditional data file 5Further analysis of cluster 7 from Figure 3Further analysis of cluster 7 from Figure 3.Click here for fileAdditional data file 6Further analysis of cluster 11 from Figure 3Further analysis of cluster 11 from Figure 3.Click here for fileAdditional data file 76VP for some other functional categories not shown in Figure 46VP for some other functional categories not shown in Figure 4.Click here for fileAdditional data file 8Summary of numerical data used in the paperSummary of numerical data used in the paper.Click here for fileAdditional data file 9Ribosome biogenesis genes that appear within the low correlation class in Figure 2bRibosome biogenesis genes that appear within the low correlation class in Figure 2b.Click here for fileAdditional data file 10Complete list of significant GO categories found in clusters from Figure 3Complete list of significant GO categories found in clusters from Figure 3.Click here for fileAdditional data file 11Complete list of significant GO categories found in clusters from Additional data files 2 and 3 and not present in Figure 3Complete list of significant GO categories found in clusters from Additional data files 2 and 3 and not present in Figure 3Click here for fileAdditional data file 12Standard error averages calculated for experimental (aSEe) and random sampling (aSEr) estimations for the functionally related groups from Figure 4Standard error averages calculated for experimental (aSEe) and random sampling (aSEr) estimations for the functionally related groups from Figure 4Click here for fileAdditional data file 13Values for the six variables of the 6,173 genes analyzedValues for the six variables of the 6,173 genes analyzed.Click here for fileAdditional data file 14Description and comments of the data shown in additional data file 1Description and comments of the data shown in additional data file 1.Click here for file
Acknowledgements
We are grateful to Drs Enrique Herrero, Albert Sorribas and Vicente
Tordera for critical reading of the manuscript, to all the members of the lab
for helpful comments and discussion and to Drs J Dopazo, J Huerta and F
Al-Shahrour for helping with the GEPAS software package. This work was
supported by research grants from the Ministerio de Educación y Ciencia
(GEN2001-4707-C08-07, BMC2003-07072-C03-02 and BFU2006-15446-
C03-02) to JP-O.
References
1. Crick FHC: On protein synthesis. Symp Soc Exp Biol 1958,
13:138-163.
2. Pérez-Ortín JE, Alepuz P, Moreno J: Genomics and the gene tran-
scription kinetics in yeast. Trends Genet 2007, 23:250-257.
3. Fraser HB, Hirsch AE, Giaever G, Kumm J, Eisen M: Noise minimi-
zation in eukaryotic gene expression. PLOS Biol 2004, 2:e137.
4. Newman JRS, Ghaemmaghami S, Ihmels J, Breslow DK, Noble M: Sin-
gle-cell proteomic analysis of S. cerevisiae reveals the archi-
tecture of biological noise. Nature 2006, 441:840-846.
5. Bar-Even A, Paulsson J, Maheshri N, Carmi M, O'Shea E, Pilpel Y,
Barkai N: Noise in protein expression scales with natural pro-
tein abundance. Nat Genet 2006, 38:636-643.
6. Warner JR, Vilardell J, Sohn JH: Economics of ribosome
biosynthesis. Cold Spring Harb Symp Quant Biol 2001, 66:567-574.
7. Mata J, Marguerat S, Bahler J: Post-transcriptional control of
gene expression: a genome-wide perspective. Trends Biochem
Sci 2005, 30:506-514.
8. Greenbaum D, Colangelo C, Williams K, Gerstein M: Comparing
protein abundance and mRNA expression levels on a
genomic scale. Genome Biol 2003, 4:117.
9. Belle A, Tanay A, Bitincka L, Shamir R, O'Shea E: Quantification of
protein half-lives in the budding yeast proteome. Proc Natl
Acad Sci USA 2006, 103:13004-13009.
10. MacKay VL, Li X, Flory MR, Turcott E, Law GL: Gene expression
analyzed by high-resolution state array analysis and quanti-
tative proteomics: response of yeast to mating pheromone.
Mol Cell Proteomics 2004, 3:478-489.
11. Lu P, Vogel C, Wang R, Yao X, Marcotte EM: Absolute protein
expression profiling estimates the relative contributions of
transcriptional and translational regulation. Nat Biotechnol
2007,
25:117-124.
12. Pradet-Balade B, Boulme F, Beug H, Mullner EW, García-Sanz JA:
Translation control: bridging the gap between genomics and
proteomics? Trends Biochem Sci 2001, 26:225-229.
13. Greenbaum D, Jansen R, Gerstein M: Analysis of mRNA expres-
sion and protein abundance data: an approach for the
comparison of the enrichment of features in the cellular pop-
ulation of proteins and transcripts. Bioinformatics 2002,
18:585-596.
14. Gasch AP, Spellman PT, Kao CM, Carmel-Harel O, Eisen MB, Storz
G, Botstein D, Brown PO: Genomic expression programs in the
response of yeast cells to environmental changes. Mol Biol Cell
2000, 11:4241-4257.
Genome Biology 2007, 8:R222
Genome Biology 2007, Volume 8, Issue 10, Article R222 García-Martínez et al. R222.16
15. Lackner DH, Beilharz TH, Marguerat S, Mata J, Watt S, Schubert F,
Preiss T, Bahler J: A network of multiple regulatory layers
shapes gene expression in fission yeast. Mol Cell 2007,
26:145-55.
16. Velculescu VE, Zhang L, Zhou W, Vogelstein J, Basrai MA, Bassett DE
Jr, Hieter P, Vogelstein B, Kinzler KW: Characterization of the
yeast transcriptome. Cell 1997, 88:243-251.
17. Beyer A, Hollunder J, Nasheuer HP, Wilhelm T: Post-transcrip-
tional expression regulation in the yeast Saccharomyces cere-
visiae on a genomic scale. Mol Cell Proteomics 2004, 3:1083-1092.
18. Ghaemmaghami S, Huh WK, Bower K, Howson RW, Belle A,
Dephoure N, O'Shea EK, Weissman JS: Global analysis of protein
expression in yeast. Nature 2003, 425:737-741.
19. García-Martínez J, Aranda A, Pérez-Ortín JE: Genomic run-on
evaluates transcription rates for all yeast genes and identifies
gene regulatory mechanisms. Mol Cell 2004, 15:303-313.
20. Arava Y, Wang Y, Storey JD, Liu CL, Brown PO, Herschlag D:
Genome-wide analysis of mRNA translation profiles in Sac-
charomyces cerevisiae. Proc Natl Acad Sci USA 2003,
100:3889-3894.
21. Law GL, Bickel KS, MacKay VL, Morris DR: The undertranslated
transcriptome reveals widespread translational silencing by
alternative 5' transcript leaders. Genome Biol 2005, 6:R111.
22. Wang Y, Liu CL, Storey JD, Tibshirani RJ, Herschlag D, Brown PO:
Precision and functional specificity in mRNA decay. Proc Natl
Acad Sci USA 2002, 99:5860-5865.
23. Grigull J, Mnaimneh S, Pootoolal J, Robinson MD, Hughes TR:
Genome-wide analysis of mRNA stability using transcription
inhibitors and microarrays reveals posttranscriptional con-
trol of ribosome biogenesis factors. Mol Cell Biol 2004,
24:
5534-5547.
24. Yagil G: Quantitative aspects of protein induction. Curr Top Cell
Regul 1975, 9:183-236.
25. Herrero J, Valencia A, Dopazo J: A hierarchical unsupervised
growing neural network for clustering gene expression
patterns. Bioinformatics 2001, 17:126-136.
26. Vaquerizas JM, Conde L, Yankilevich P, Cabezón A, Mínguez P, Díaz-
Uriarte R, Al-Shahrour F, Herrero J, Dopazo J: GEPAS, an experi-
ment-oriented pipeline for the analysis of microarray gene
expression data. Nucleic Acids Res 2005:W616-W620.
27. Bader GD, Heilbut A, Andrews B, Tyers M, Hughes T, Boone C:
Functional genomics and proteomics: charting a multidi-
mensional map of the yeast cell. Trends Cell Biol 2003,
13:344-356.
28. Holland MJ: Transcript abundance in yeast varies over six
orders of magnitude. J Biol Chem 2002, 277:14363-14366.
29. Jansen R, Gerstein M: Analyzing protein function on a genomic
scale: the importance of glod-standard positives and nega-
tives for network prediction. Curr Opin Microbiol 2004, 7:535-545.
30. Bernstein JA, Khodursky AB, Lin PH, Lin-Chao S, Cohen SN: Global
analysis of mRNA decay and abundance in Escherichia coli at
single-gene resolution using two-color fluorescent DNA
microarrays. Proc Natl Acad Sci USA 2002, 99:9697-9702.
31. Andersson AF, Lundgren M, Eriksson S, Rosenlund M, Bernander R,
Nilsson P: Global analysis of mRNA stability in the archaeon
Sulfolobus. Genome Biol 2006, 7:R99.
32. Gibbons FH, Roth FP: Judging the quality of gene expression-
based clustering methods using gene annotation. Genome Res
2002, 12:1574-1581.
33. Jansen R, Greenbaum D, Gerstein M: Relating whole-genome
expression data with protein-protein interactions. Genome
Res 2002, 12:37-46.
34. Deszo Z, Oltvai ZN, Barabási AL: Bioinformatic analysis of
experimentally determined protein complexes in the yeast
Saccharomyces cerevisiae.
Genome Res 2003, 13:2450-2454.
35. Tsay Y-F, Thompson JR, Rotemberg MO, Larkin JC, Woolford JL:
Ribosomal protein synthesis is not regulated at the transla-
tion level in Saccharomyces cerevisiae: balanced accumulation
of ribosomal proteins L16 and rp59 is mediated by turnover
of excess protein. Genes Develop 1988, 2:664-676.
36. Bachand F, Lackner DH, Bahler J, Silver PA: Autoregulation of
ribosome biosynthesis by a translational response in fission
yeast. Mol Cell Biol 2006, 26:1731-1742.
37. Mnaimneh S, Davierwala AP, Haynes J, Moffat J, Peng WT, Zhang W,
Yang X, Pootoolal J, Chua G, Lopez A, et al.: Exploration of essen-
tial gene functions via titratable promoter alleles. Cell 2004,
118:31-44.
38. Hartigan JA, Wong MA: A K-means clustering algorithm. App
Statist 1978, 28:100-108.
39. Berriz GF, King OD, Bryant B, Sander C, Roth FP: Characterizing
gene sets with FuncAssociate. Bioinformatics 2003,
19:2502-2504.
40. Staub E, Mackowiak S, Vingron M: An inventory of yeast proteins
associated with nucleolar and ribosomal components.
Genome Biol 2006, 7:R98.