Báo cáo y học: " Quantification of ortholog losses in insects and vertebrates" ppt
Bạn đang xem bản rút gọn của tài liệu. Xem và tải ngay bản đầy đủ của tài liệu tại đây (781.19 KB, 11 trang )
Genome Biology 2007, 8:R242
Open Access
2007Wyderet al.Volume 8, Issue 11, Article R242
Research
Quantification of ortholog losses in insects and vertebrates
Stefan Wyder
*†
, Evgenia V Kriventseva
‡†
, Reinhard Schröder
§
,
Tatsuhiko Kadowaki
¶
and Evgeny M Zdobnov
*†¥
Addresses:
*
Department of Genetic Medicine and Development, University of Geneva Medical School, 1211 Geneva, Switzerland.
†
Swiss
Institute of Bioinformatics, rue Michel-Servet, 1211 Geneva, Switzerland.
‡
Department of Structural Biology and Bioinformatics, University of
Geneva Medical School, rue Michel-Servet, 1211 Geneva, Switzerland.
§
Interf. Institut für Zellbiologie, Abt. Genetik der Tiere, Universität
Tübingen, 72076 Tübingen, Germany.
¶
Graduate School of Bioagricultural Sciences, Nagoya University, Chikusa, Nagoya 464-8601, Japan.
¥
Imperial College London, South Kensington Campus, London SW7 2AZ, UK.
Correspondence: Evgeny M Zdobnov. Email:
© 2007 Wyder et al.; licensee BioMed Central Ltd.
This is an open access article distributed under the terms of the Creative Commons Attribution License ( which
permits unrestricted use, distribution, and reproduction in any medium, provided the original work is properly cited.
Ortholog losses in vertebrates and insects<p>Comparison of the gene repertoires of 5 vertebrates and 5 insects showed that the rate of losses correlates well with the species' rates of molecular evolution and radiation times and suggests that the Urbilateria genome contained more than 7,000 genes.</p>
Abstract
Background: The increasing number of sequenced insect and vertebrate genomes of variable
divergence enables refined comparative analyses to quantify the major modes of animal genome
evolution and allows tracing of gene genealogy (orthology) and pinpointing of gene extinctions
(losses), which can reveal lineage-specific traits.
Results: To consistently quantify losses of orthologous groups of genes, we compared the gene
repertoires of five vertebrates and five insects, including honeybee and Tribolium beetle, that
represent insect orders outside the previously sequenced Diptera. We found hundreds of lost
Urbilateria genes in each of the lineages and assessed their phylogenetic origin. The rate of losses
correlates well with the species' rates of molecular evolution and radiation times, without
distinction between insects and vertebrates, indicating their stochastic nature. Remarkably, this
extends to the universal single-copy orthologs, losses of dozens of which have been tolerated in
each species. Nevertheless, the propensity for loss differs substantially among genes, where roughly
20% of the orthologs have an 8-fold higher chance of becoming extinct. Extrapolation of our data
also suggests that the Urbilateria genome contained more than 7,000 genes.
Conclusion: Our results indicate that the seemingly higher number of observed gene losses in
insects can be explained by their two- to three-fold higher evolutionary rate. Despite the profound
effect of many losses on cellular machinery, overall, they seem to be guided by neutral evolution.
Background
The evolution of gene repertoires is mostly driven by gene
duplications and gene losses. Duplications can arise by short-
range copying of individual genes or of longer multigene DNA
segments, or even result from whole genome duplications
[1,2]. Copies of single genes are frequently associated with
retrotransposition [3], whereas unequal homologous recom-
bination copies DNA segments of varying length. Gene prolif-
eration, on the other hand, is balanced by gene losses, either
through acquiring deleterious mutations that eventually dis-
able the genes or as a consequence of unequal homologous
recombination.
Published: 16 November 2007
Genome Biology 2007, 8:R242 (doi:10.1186/gb-2007-8-11-r242)
Received: 30 June 2007
Revised: 4 October 2007
Accepted: 16 November 2007
The electronic version of this article is the complete one and can be
found online at />Genome Biology 2007, 8:R242
Genome Biology 2007, Volume 8, Issue 11, Article R242 Wyder et al. R242.2
Massive gene losses of olfactory receptors were reported in
human and ape families compared to mice [4], which have
been speculated to be linked with the acquisition of full tri-
chromatic vision, lowering the demand for olfaction [5]. Ohl-
son's 'less-is-more' hypothesis emphasizes that loss-of-
function mutations may play a beneficial role in evolution [6];
an example for adaptive gene loss is the near-complete fixa-
tion of a null allele of CASP12 in the human lineage [7], pre-
sumably to confer protection from severe sepsis. Gene losses
have also been implicated in reproductive isolation of Dro-
sophila races [8].
The fast growing number of available vertebrate and insect
genomes allows increasingly refined comparisons and the
quantification of the major modes of animal genome evolu-
tion. The recent sequencing of the honeybee [9] and the Tri-
bolium beetle [10] genomes extends insect genomics from
only Dipteran species to the orders of Hymenoptera and Cole-
optera, which radiated about 300 million years ago [11]. This
allowed us to quantify and date losses of orthologous groups
across ten bilaterian species in the first analysis that consist-
ently compares five insects (phylum Arthropoda) and five
vertebrates (phylum Chordata). Previous studies of gene
losses have been focussed on mammals [12], vertebrates [13],
or included only a single insect [14], or two dipterans [15].
Reassuringly, our analysis recovered previously published
cases of gene losses, such as the loss of DNA methylation [16],
and the heavy rearrangement of the circadian clock [17] in
Diptera.
Results
Quantification of ortholog losses
To systematically identify gene losses in vertebrate and insect
representatives of Bilaterian species, we delineated ortholo-
gous groups based on all-against-all Smith-Waterman com-
parisons using the official gene sets of five vertebrates
(human, mouse, opossum, chicken and pufferfish) and five
insects (fruitfly, malaria mosquito, dengue/yellow fever mos-
quito, honeybee and red flour beetle) (see details in Materials
and methods). The species choice aimed to maximize the phy-
logenetic coverage with similar lineage radiation times in
both deuterostomia and protostomia. The fraction of genes
with recognized orthology among these species represents
about 70-80% of their predicted gene pools. The comparative
analysis of the shared content of gene repertoires across these
species is discussed in the study presenting the analysis of the
first beetle genome, that of Tribolium castaneum [10], and
here we focus on the analysis of losses of orthologous genes.
According to their phyletic distribution and gene copy-
number in each of the species, we considered the following
types of orthologous groups reflecting different selection
pressures: the universal single-copy orthologs (U); the uni-
versal multiple-copy orthologs (N); patchy orthologs (P) that
are present in both phyla in at least three species, in single or
multiple copies; and insect- or vertebrate-specific orthologs (I
and V, respectively). While universal single-copy orthologs
(U) are evolving under a distinct pressure for copy-number
control, the number of universal multiple-copy orthologs (N)
under similarly strict copy-number control is extremely low
(only six groups have equal multiple-copy gene number in at
least nine species). Although U, N and P orthologs must all
have been present in the last common ancestor of insects and
vertebrates, the Urbilateria, losses in these fractions occur at
different rates.
Figure 1b shows the size distribution of the orthologous frac-
tions and the number of losses in each species and ortholog
category. The tree shown in Figure 1a illustrates the species
phylogeny, which allowed us to infer the number of losses on
the internal branches, assuming evolutionary parsimony,
which minimizes the number of events required to explain the
phyletic gene distribution in each orthologous group. The
phylogenetic tree was reconstructed using maximum-likeli-
hood analysis of the concatenated alignment of 1,150 univer-
sal single-copy orthologs [10] where the lengths of the
branches are proportional to the number of accumulated
mutations, allowing us to compare the gene loss rates with the
rates of lineage divergence (measured as the rate of protein
substitutions). For the branches closest to the root, the num-
bers of gene losses cannot be inferred without an additional
outgroup.
The analysis identified hundreds of differentially lost Urbila-
terian genes of U, N and P orthologs in each of the species (see
table of Figure 1). Overall, about 40% of ancient orthologous
groups have been lost in at least one (out of the ten) species,
illustrating the extent of the evolutionary flexibility of gene
pools. Moreover, there are dozens of genes lost in each of the
species that otherwise appear as universal single-copy
orthologs. Koonin et al. [14] noted that nearly all pan-eukary-
otic single-copy orthologs are subunits of known protein
complexes; nevertheless, the observed losses indicate that
even seemingly tightly constrained genes are, to a certain
degree, dispensable in evolution.
Number of losses correlate with molecular divergence
The inferred distribution of losses over the internal branches
of the species phylogeny allowed us to correlate them with the
estimated geological time of species radiations and the molec-
ular evolutionary rate in each of the lineages. The molecular
rates of evolution were quantified using genome-wide maxi-
mum-likelihood analysis of amino acid substitutions in the
well aligned regions of single-copy orthologs (see Materials
and methods). Figure 2a displays the correlation of the
number of losses of the different types of orthologs plotted
versus the protein sequence divergence. Losses of U and N
orthologs (Figure 2b) occur only at the terminal branches as
the fraction definition requires presence of the orthologous
genes in at least nine species, whereas losses of P orthologs
(Figure 2c) occur at both internal and terminal branches. Cor-
relations are statistically significant for all categories (see
Genome Biology 2007, Volume 8, Issue 11, Article R242 Wyder et al. R242.3
Genome Biology 2007, 8:R242
Figure 2 legend for details), and there is no distinction
between insects and vertebrates. Moreover, although the
absolute numbers of insect- and vertebrate-specific losses
appear different, they in fact follow the same trend when nor-
malized to the total number of the phylum-specific ortholo-
gous groups (Figure 2d; see Additional data file 1 for a graph
with absolute numbers). The different slopes of the regres-
sion lines reflect the varying stringency of evolutionary con-
straints that differ between the postulated types of orthologs.
Despite the difference in the absolute numbers of lost U and
N orthologs, their rates of loss are indistinguishable when
normalized to the number of such orthologous groups, indi-
cating the same level of purifying selection (Figure 2b). The
data show that P orthologs are about 8-fold less constrained
than U and N orthologs; this roughly corresponds to about
20% of the common Bilateria gene pool evolving 8 times
faster than the remaining, more constrained fraction. I and V
orthologs appear to be about three-fold more constrained
than P orthologs, which is not surprising as they may repre-
sent a similar mixture of a slower evolving fraction of 80%
and a faster evolving minority. The level of correlation
between the number of losses and the protein sequence diver-
gence rates (Figure 2) is similar to that observed between
other genome-wide measures of species divergence [18].
Chicken was excluded from this and all following analyses as
a clear outlier (see Discussion).
Insects evolve two to three times faster than
vertebrates
Protein sequence divergence is significantly larger between
insects than between vertebrates (see the longer branch
lengths in Figure 1; Mann-Whitney U test, p = 0.009).
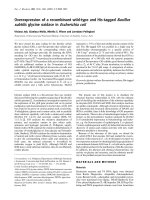
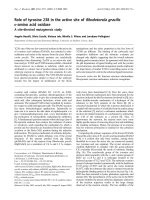
Quantification of orthologous gene losses in insects and vertebratesFigure 1
Quantification of orthologous gene losses in insects and vertebrates. (a) The phylogenetic relations among the organisms are illustrated by the tree, with
branch length proportional to the rate of amino acid substitutions estimated using the maximum-likelihood approach. The number of orthologous groups
lost on the internal phylogenetic branches were inferred using the Dollo parsimony principle and are shown on the phylogenetic tree above branches for
the I/V fraction, and below branches for the P fraction. *The presence in two species was sufficient to infer losses of I/V orthologous groups. (b) The
number of orthologous group losses in the five main categories: U, universal single-copy genes (blue, present in all species except the one in question); N,
universal multiple-copy genes (orange, present in at least nine species); P, patchy orthologs (yellow, present in both phyla in at least three species, in one
or multiple copies); I/V, insect- or vertebrate-specific orthologous groups (present only in insects (green) or vertebrates (violet), in at least three species.
The dark parts of the bars depict the number of contemporarily present orthologous groups, and the light parts depict the number of inferred losses.
AGAM, Anopheles gambiae; AAEG, Aedes aegypti; DMEL, Drosophila melanogaster; TCAS, Tribolium castaneum; AMEL, Apis meliferia; HSAP, Homo sapiens;
MMUS, Mus musculus; MDOM, Monodelphis domestica; GGAL, Gallus gallus; TNIG, Tetraodon nigroviridis.
Dmel
Agam
Aaeg
Tcas
Amel
Tnig
Ggal
Mdom
Mmus
Hsap
I/V
U N
2,000
0
4,000
6,000
8,000
10,000
orthologous groups
(b)
P
1623
1655
1632
1655
1615
1622
1569
1676
1680
1680
Agam
Aaeg
Dmel
Tcas
Amel
Tnig
Ggal
Mdom
Mmus
Hsap
68
36
59
36
76
69
122
15
11
11
lost
presentlostpresentlostpresent
present
lost
3739
3742
3755
3748
3714
3785
3651
3817
3839
3841
112
109
96
103
137
66
200
34
12
10
633
742
730
943
864
1084
921
1141
1238
1218
813
704
716
503
582
362
525
305
208
228
150
160*
31
147
124
32
84
I/V
P
196
189
81
213
154
73
105
261
774
190
441
362
156
132
291
234
125
293
331
582
81
(a)
*
0.1 subst.
1587
1695
1629
1737
nd
nd
5547
6060
6093
6135
255
147
213
105
nd
nd
774
261
228
186
12,000
Genome Biology 2007, 8:R242
Genome Biology 2007, Volume 8, Issue 11, Article R242 Wyder et al. R242.4
Similarly, this is reflected in the observation of significantly
more frequent gene losses in insects than in vertebrates
(Mann-Whitney U test: N orthologs, p = 0.016; P orthologs, p
= 0.04). In comparison with vertebrates, the rate of evolution
in bee and beetle is about two-fold higher and up to three-fold
higher in Diptera. This especially high rate of evolution in
Diptera, particularly at the base of the Dipteran radiation, has
been noted previously [19].
Lower estimate of the Urbilateria number of genes
Despite inherent dating uncertainties, the correlation
between the number of lost orthologous groups and diver-
gence times is significant for U and P orthologs (Spearman
rank correlations: U orthologs, rs = 0.84, p = 0.007; N
orthologs, rs = 0.58, p = 0.11; P orthologs, rs = 0.57, p = 0.03),
indicating that losses of ancient genes occur in a roughly
clock-like manner. The good correlation between the rate of
losses with molecular rate and time indicates their stochastic
nature. Projection of these trends as shown in Figure 3 to 600
million years ago (MYA), presumably dating the radiation of
insects and vertebrates, suggests that over 1,000 (95% confi-
dence interval 799-1,456) Urbilaterian genes have been lost
from insects and only half this number (95% confidence inter-
val 404-678) from vertebrates. This leads to the lower
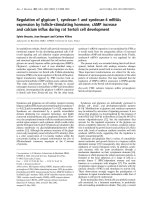
The number of ortholog losses correlates with the rate of amino acid substitutionsFigure 2
The number of ortholog losses correlates with the rate of amino acid substitutions. The number of orthologous group (U, N, P, I/V) losses normalized
with the total size of the fraction is plotted versus the branch length of the maximum-likelihood phylogenetic tree (Figure 1). (a) All ortholog types
combined; (b) U and N orthologs; (c) Patchy orthologs; (d) Insect- and vertebrate-specific orthologs. Filled symbols denote vertebrates and open symbols
denote insects. Spearman rank correlations: U orthologs, rs = 0.79, p = 0.015; N orthologs, rs = 0.67, p = 0.05; P orthologs, rs = 0.90, p < 0.01; I/V
orthologs, rs = 0.83, p < 0.01. Regression slopes for U and N are not statistically different. Anc, ancestral.
0 0.05 0.1 0.15 0.2 0.25 0.3 0.35
0
5
10
15
20
25
30
35
40
45
amino acid substitutions per site
Insect-/Vertebrate-specific (I/V)
honeybee
fly
opossum
anc Diptera/
Coleoptera
human
Aedes
Anopheles
anc Diptera
anc
mosquitoes
0 0.05 0.1 0.15 0.2 0.25 0.3 0.35
0
5
10
15
20
25
30
35
40
45
amino acid substitutions per site
Patchy (P)
honeybee
beetle
fly
pufferfish
anc Diptera
Anopheles
opossum
anc Diptera/Coleoptera
human
relative number of lost orthologous groups
0 0.05 0.1 0.15 0.2 0.25 0.3 0.35
0
5
10
15
20
25
30
35
40
45
amino acid substitutions per site
Universal Multiple-Copy (N)
Universal Single-Copy (U)
0 0.05 0.1 0.15 0.2 0.25 0.3 0.35
0
5
10
15
20
25
30
35
40
45
amino acid substitutions per site
Patchy (P)
Universal Multiple-Copy (N)
Universal Single-Copy (U)
Insect-/Vertebrate-specific (I/V)
(b)
relative number of lost orthologous groups
(d)
(a)
(c)
relative number of lost orthologous groups
relative number of lost orthologous groups
human
Aedes
Anopheles
pufferfish
fly
rs=0.90
rs=0.83
rs=0.79
rs=0.67
Genome Biology 2007, Volume 8, Issue 11, Article R242 Wyder et al. R242.5
Genome Biology 2007, 8:R242
estimate of the number of Urbilaterian genes of just over
7,000 (remarkably, we obtained 7,114 orthologous groups
with at least one insect and one vertebrate member). This
estimate, however, does not take into account: genes that cur-
rently appear as insect- or vertebrate-specific, many of which
could be of Urbilaterian origin; closely related Urbilateria
paralogs that remain unresolved and are likely grouped
together in N groups; as well as fractions of fast diverging
genes that escaped our orthology classification.
Functional load of losses
Recovered known facts as positive controls
Reassuringly, closer inspection of several of the predicted
cases of lost genes pointed to recently published findings of
lineage-specific biology.
Hedgehog signaling pathway rearrangements in Drosophila
Hedgehog signaling pathway rearrangements in Drosophila
have been reported where orthologs of human Sil, Hip and
Gas1 are missing from Drosophila [20], and homologs of
polaris/TG737 (nompB) and Kif3a (Klp64D) appear to have
roles unrelated to hedgehog signaling [21,22].
Sid-1/tag-130 gene loss in all Diptera
Sid-1/tag-130 genes have been lost in all Diptera but are
present in bee and Tribolium as reported by Weinstock et al.
[9]. Sid-1 is implicated in the cellular import of RNA interfer-
ence signal and enables passive uptake of double-stranded
RNA (yet, Sid-1 is likely to be a Caenorhabditis elegans
invention as its inparalog, TAG130, is less derived (Additional
data file 2)).
DNA-methyltransferases DNMT1 and DNMT3B lost in the
Coleoptera/Diptera ancestor
DNA-methyltransferases DNMT1 and DNMT3B have been
lost in the Coleoptera/Diptera ancestor, consistent with their
loss reported in Diptera [23] and their surprising presence in
honeybee [9,16].
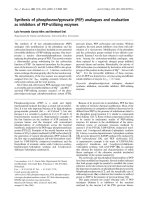
Extrapolation of number of ancient (U, N and P) orthologs to UrbilateriaFigure 3
Extrapolation of number of ancient (U, N and P) orthologs to Urbilateria. The regression lines (and their 90% confidence intervals) are drawn using the
number of U, N and P orthologous groups in current species, the estimates for putative ancestors, including the inferred number of losses (Figure 1), and
the assumed split of insects and vertebrates about 600 MYA against the species radiation time. Remarkably, the naïve counting of orthologous groups that
have at least one insect and at least one vertebrate member results in 7,114 likely Urbilateria genes.
600 500 400 300 200 100 0
7200
7000
6800
6400
6000
5600
5400
MYA
present ancient orthologous groups
Anopheles
fly
human
opossum
beetle
vertebrate
insect
6600
6200
5800
mouse
pufferfish
honeybee
Aedes
Genome Biology 2007, 8:R242
Genome Biology 2007, Volume 8, Issue 11, Article R242 Wyder et al. R242.6
A candidate insect telomerase reverse transcriptase
A candidate insect telomerase reverse transcriptase (TERT) is
present in honeybee and Tribolium but absent in all Dipter-
ans. The absence of TERT in Diptera seems to be correlated
with the loss of telomeric TTAGG repeats [24].
Sterol metabolism, NAD biosynthesis, and other losses
Sterol metabolism, NAD biosynthesis, and other losses pro-
posed earlier from the comparison of the fly and the mosquito
genomes [23] seem to have been lost in all insects sequenced
so far, that is, before the appearance of holometabolous
insects. Exceptions are a dihydroxyacetone kinase 1 lost from
both Drosophila and Anopheles, a C-5 sterol desaturase and
a histidine ammonia-lyase present in only Tribolium and two
genes present in only honeybee, an ornithine carbamoyl-
transferase and a malonyl-CoA decarboxylase.
Novel case stories
Below we describe some of the identified losses that are likely
to have had an impact on the functional divergence of the lin-
eages, exemplifying losses of different types of orthologs,
from the most conserved single-copy genes to orthologs with
a highly patchy phylogenetic distribution. It has been sug-
gested that secondary gene losses can be driven by the losses
of key players of particular pathways or complexes that disa-
ble their functionality [25-27]. Hence, we mapped losses to
the characterized biochemical pathways annotated for
human orthologs; the results for Tribolium and its ancestor
are overviewed in Table 1. However, having low numbers of
losses per pathway [26], we concentrated more on providing
examples of losses of directly interacting genes, reported for
Drosophila from protein-protein interaction screens [28] and
literature co-citations via human orthologs [29].
Losses of universal single-copy orthologs
An example of a universal single-copy ortholog missing in
Drosophila is a 35 kDa protein associated with U11 snRNPs.
U11 and U12 are components of the minor spliceosome
responsible for the splicing of a small number of U12-type
introns (<1% in both humans and flies) [30]. The minor spli-
ceosome is widely conserved from plants to humans, includ-
ing most insects but absent from C. elegans. Lack of a clear
ortholog of U11 snRNA and the associated 35 kDa protein has
been initially proposed [31], but Schneider et al. [32] identi-
fied a highly divergent U11 snRNA. The 31 kDa and 35 kDa
proteins seem to be missing from all Drosophila species and
a 25 kDa protein is absent from Diptera [33]. Interestingly,
the loss of U11/U12 spliceosomal proteins in Drosophila is
accompanied by the loss of the majority of U12-type introns
[33,34].
Another example of a universal gene that seems to be missing
from the Drosophila genome is sortilin-related receptor LR11
(also known as SorLA), a member of the low-density lipopro-
tein receptor family. LR11 binds low-density lipoprotein, the
major cholesterol-carrying lipoprotein of plasma, and trans-
ports it into cells by endocytosis. Human LR11 also regulates
trafficking of amyloid precursor protein and its expression is
decreased in the brain of Alzheimer's disease patients [35].
Losses of universal multi-copy orthologs
An example is the Cdc7 kinase and its regulatory subunit Dbf4
implicated in triggering DNA replication in G1 phase through
phosphorylation of Mcm proteins [36]. Cdc7 is essential in
yeast in contrast to mice where homozygous null mutants for
the Cdc7 ortholog Nr2c2 show impaired spermatogenesis
[37]. Cdc7 is a universal single-copy gene with two fly para-
Table 1
Losses in Tribolium and its (Coleoptera/Diptera) ancestor mapped to pathways using human orthologs
Pathway Source Genes Total Only in
beetle
Significance
Neuroactive ligand-receptor interaction KEGG NPFFR1, NPFFR2, BZRP, TSPO, GALR1, GALR2, GALR3 66 0.099
ABC transporters - general KEGG ABCA1, ABCA4, ABCA12, ABCC5, ABCC12 5 3 4.73E-005*
Oxidative phosphorylation KEGG ATP6V0E, UCRC (7.2 kDa), NDUFA7, COX7C 44 0.04
Cell cycle KEGG CDC7, CCNE1, DBF4 33 0.12
Folate biosynthesis/starch and sucrose metabolism KEGG RAD54B, SETX 22 0.06
Alkaloid biosynthesis II KEGG DDHD1, SLC27A2 20 0.02
†
Regulation of actin cytoskeleton KEGG FGD1, IQGAP1 20
Cholera - infection KEGG ATP6V0E1, TRIM23 21 0.06
Purine metabolism KEGG PDE1C, POLR2L 22 0.49
Ribosome KEGG RPL29, RPL39 22 0.53
Neurodegenerative disorders KEGG BCL2L1, NGFR 20 0.06
Propanoate metabolism KEGG MLYCD, SLC27A2 20 0.07
Methionine metabolism KEGG DNMT1, DNMT3B 20
Oxidative stress induced gene expression via Nrf2 Biocarta HMOX1, NGFR 21 0.02
†
The statistical significance of the coordinated losses of at least two genes per pathway was calculated using hypergeometric test (* p < 0.01,
†
p < 0.05).
Genome Biology 2007, Volume 8, Issue 11, Article R242 Wyder et al. R242.7
Genome Biology 2007, 8:R242
logs whereas Dbf4 is present in two copies in humans and
opossum. We confirmed the loss of both genes in Tribolium
by tBlastn search and phylogenetic analysis (Additional data
file 3). Cdc7 is also missing from the current Anopheles anno-
tation but tBlastn searches identified a Cdc7 candidate in the
genome. Dbf4 appears to be missing from the Anopheles and
Tetraodon genomes. Interestingly, in yeast an allele of the
gene MCM5 (CDC46) has been identified that bypasses the
requirement for CDC7/DBF4 [38]. Although the Tribolium
MCM5 ortholog TC_09146 does not feature the same muta-
tion, P86L, it is conceivable that a similar mutation has ren-
dered CDC7/DBF4 disposable in Tribolium.
Another example of a loss of an otherwise universal gene is
the Tribolium ortholog of human ATP-binding cassette trans-
porter A1 (ABCA1). ABCA1 is a cholesterol efflux transporter
and is also required for engulfment of apoptotic cells by mac-
rophages in mice and C. elegans [39,40]. In humans, the
turnover of ABCA1 is regulated by Alpha1-syntrophin [41],
and both genes encoding these proteins appear to be missing
from the beetle genome.
Losses of patchy and insect-specific orthologs
We observed numerous losses in Diptera, many of which
seem to be involved in the ubiquitin cycle, DNA repair (also
reported in [31]), actin cytoskeleton and transcription control
(Additional data file 4), which may point to substantial rear-
rangements of the ancestral pathways. An intriguing example
is the BRCC complex, a complex with ubiquitin E3 ligase
activity known to be involved in DNA repair, cell cycle regula-
tion and homology-directed repair in human that has lost
BRCA1, RBBP-8 and BRCC3 in the Dipteran lineage.
An example of insect-specific orthologous groups lost in Dip-
tera are genes associated with oxidoreductase activity, includ-
ing Aldo/keto reductases and several FAD dependent
oxidoreductases; this category of genes was enriched among
the 160 Diptera gene losses in a comparative Gene Ontology
(GO) analysis with the Tribolium genome (Additional data
file 5).
Extreme cases: exclusive insect models of human genes
At extremes, each novel insect genome sequence uncovers
previously invisible orthologous gene relationships to human
genes (see [10] for venn diagram that shows how many new
orthologous relations are uncovered by the honeybee and
beetle genomes). For example, we identified 45 orthologous
groups shared between honeybee and at least one vertebrate
but lost in the Coleoptera/Diptera ancestor, for example, an
ortholog of RAD18 (GB-14468) that is an E3 ubiquitin-pro-
tein ligase involved in postreplication repair of UV-damaged
DNA.
To complement the initial analysis of the Tribolium genome,
we further identified 62 genes that are present in all verte-
brates and Tribolium but lost from the other four insect
genomes. Examples include Yipf3, a natural killer cell-spe-
cific antigen expressed during embryonic hematopoiesis in
humans, and CENP-S, which in humans is a component of a
centromeric protein complex, CENPA-CAD [42], that
replaces histones in centromeres. In Tribolium, the orthologs
of the other five complex members [42] seem to be absent
from the genome, indicating a different mode of action.
CRLF3, a cytokine receptor-like factor 3, has also been lost in
all insects but Tribolium, as well as a regulator of the NF-κB
pathway, Tgf, which positively regulates I-kappaB kinase.
Because of structural and functional similarities in the mode
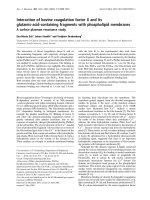
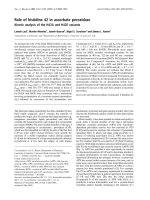
Expression pattern of the F-box gene during embryogenesis of the beetle T. castaneumFigure 4
Expression pattern of the F-box gene during embryogenesis of the beetle
T. castaneum. (a) F-box gene TC_04309 is initially expressed in the germ
rudiment at the rims of the invaginating mesoderm, a position where
activated Map-kinase is also seen [76]. Expression is strongest in the
posterior (white arrow) and weakens towards the anterior. Ventral view,
anterior is up posterior points down. Hl, head lobes. (b) Expression is
seen as spots in the thoracic legs (arrowhead), at the base of the labral
head appendages (small arrow head) and in segmentally repeated spots in
the lateral body wall. T3, thoracic segment 3. Only the anterior half of the
embryo is shown. (c) At a similar stage as shown in (b) where all body
segments are present, the F-box gene is expressed in the anlagen of the
hindgut (arrow). (d) When the legs have grown longer, F-box gene
expression is extended covering the distal end. As seen in (c, d),
expression in the labrum, in the hindgut-primordium and weakly at the
lateral sites of the abdominal segments persists. (e) The hindgut has
invaginated and grows out, forming a tube where the F-box gene is
expressed in its posterior, proximal end around the future posterior gut
opening (arrow). (f) At the retracted germ band stage, F-box is expressed
around the anterior gut opening (white arrow) that has formed between
the head lobes. (g) In the same embryo shown in (f), F-box gene
expression is seen in the walls of the hindgut (arrow).
Genome Biology 2007, 8:R242
Genome Biology 2007, Volume 8, Issue 11, Article R242 Wyder et al. R242.8
of activation between insect and vertebrate NF-κB/Rel tran-
scription factors, they are thought to have countered infec-
tions in Urbilateria [43]. Another Tribolium gene,
TC_04309, absent in all sequenced arthropods, is an ortholog
of the human F-box only gene 7 (Fbxo7). The tBlastn search
and phylogenetic analysis of FBXO7 confirmed the lack of
clear orthologs in other insects (Additional data files 6 and 7).
FBXO7 is a component of modular E3 ubiquitin protein
ligases called SCFs and functions in phosphorylation-
dependent ubiquitination [44]. Human FBXO7 was also
reported to positively regulate the activity of cyclin D/CDK6
in order to facilitate entry into the cell cycle [45]. In Dro-
sophila, the cyclin D/CDK6 complex stimulates cell growth as
well as proliferation [46,47]. Amniotes have two cdk4
orthologs due to a gene duplication (cdk4 and cdk6) and two
cyclin D orthologs. Tribolium also encodes a cdk4 ortholog
and two cyclin D orthologs, in contrast to the other insects,
which have only one cyclin D ortholog (Additional data file 8).
It is tempting to speculate that the presence of FBXO7 and a
second cyclin D in the beetle are functionally linked.
TC_04309 is expressed in limbs and the hindgut of Tribolium
embryos (Figure 4). The function of TC_04309 is unknown
but, taken together, it is conceivable that it controls cell pro-
liferation in a tissue-specific manner as in mammals.
Robustness of estimates
Several factors can lead to an overestimation of gene losses:
incomplete annotations, genome sequence gaps and the lim-
ited sensitivity of protein sequence comparison methods.
Reassuringly, our estimates of number of gene losses for Dro-
sophila and human, the two most extensively studied and
curated model organisms, are similar to that of automatically
annotated species, indicating a fairly good quality of genome
annotations and their relative completeness. The chicken
genome, however, shows exceptionally high numbers of
losses in all categories that are likely to be overestimates due
to an incomplete genome sequence that was estimated to be
missing 5-10% of the genes [48], and, therefore, it was not
taken into account in the analysis presented above. A closer
inspection of 'missing' Tribolium genes from the universal
single-copy and insect-specific fraction allowed us to correct
about 30 Tribolium genes overlooked by the automatic anno-
tation and some 150 merged genes. Nevertheless, most 'miss-
ing' genes were confirmed to be absent from the genome
using tBlastn searches, indicating that the Tribolium annota-
tion is nearly complete for evolutionarily conserved genes.
Orthology misclassifications can also lead to inflated esti-
mates when orthologous groups are wrongly split up, or to
underestimates when several orthologous groups are spuri-
ously pooled together, 'hiding' losses. We compared the
results of our analysis with an independently derived and
hand curated set of about 100 gene losses in Diptera (Hugh
Robertson, personal communication). Detailed phylogenetic
examination revealed only two to three cases of likely errors
in our high throughput orthology identification pipeline and
a few complicated cases that could not be resolved even using
phylogenetic methods as the proteins were too short or too
divergent.
Discussion
We present here the quantification of losses of orthologous
groups in five vertebrate and five insect genomes. Lineage-
specific gene duplications result in multi-copy orthologous
groups or fine-grained gene families. Here we focused on
complete losses of such gene families (requiring all ortholo-
gous genes to be lost in a lineage). Members of an orthologous
group are likely to share overlapping functions, and a com-
plete loss of all representatives is more likely to have biologi-
cal consequences [49,50] than a loss of a specific gene
member. The parsimonious interpretation of the losses in the
context of the species phylogeny suggests hundreds of gene
losses on each branch of the tree. Diptera species lost the
most genes, and placentals the least.
We show that the higher numbers of lost genes in insects can
be explained by their higher rates of evolution as the loss rate
is positively correlated with the molecular rate of evolution
for each ortholog category and branch of the phylogeny.
Interestingly, losses normalized for evolutionary rate and
total number of orthologous groups are similar between
insects and vertebrates, even for I and V orthologs. Therefore,
one can not exclude that gene losses are mainly driven by neu-
tral evolution [51,52], which should be taken as the null hypo-
thesis until proven otherwise. Our data also suggest that
about 20% of the gene repertoire evolves 8 times faster than
the rest. The fact that the overall number of losses of ortholo-
gous groups is in agreement with the model of neutral evolu-
tion does not, of course, mean that all losses are selectively
neutral. In that respect, it is noteworthy that some of the lost
genes we discuss, such as Cdc7/Dbf4 or Fboxo7, seem to act
as positive regulators.
Several hypotheses have been put forward to explain differ-
ences in evolutionary rates across species [53]. A high evolu-
tionary rate might simply reflect differences in mutation
rates. The known contributors to the rate of mutations, meta-
bolic rate [54] and generation time [55], are clearly different
between dipterans and mammals. In addition, differences in
DNA methylation, fidelity of DNA-repair mechanisms or the
production of DNA-damaging agents have also been sug-
gested to explain different mutation rates in different species
[53,56]. We found a number of genes implicated in DNA
repair missing from Diptera. Although the functional conse-
quences of these losses in Diptera are unknown, they might
contribute to an increased mutation rate. A second hypo-
thesis is that the efficiency of selection against deleterious
mutants varies across species, due to differences in effective
population size and/or mode of reproduction. Finally, rate
variation across lineages could be caused by species-specific
differences in the timing and frequency of adaptive evolution.
Genome Biology 2007, Volume 8, Issue 11, Article R242 Wyder et al. R242.9
Genome Biology 2007, 8:R242
Indeed, theoretical models [57,58] have proposed that evolv-
ability is a selectable trait.
Conclusion
We showed that the gene loss rate correlates well with rates of
molecular evolution, explaining the significantly higher
number of gene losses in insects. The data also can not reject
that gene losses are dominated by neutral evolution.
The hundreds of lost genes we identified along the phyloge-
netic tree suggest common rearrangements and rewiring of
ancient pathways and signaling cascades. Such global
approaches are suitable for generating further experimentally
testable hypotheses, and will lead to a better understanding of
global evolutionary trends and detailed functional differences
among lineages.
Materials and methods
Orthology classification
Protein sets were retrieved from Ensembl for Drosophila,
Anopheles and all vertebrates as of 4 August 2006. Tribolium
and Apis proteins were retrieved from Baylor College of
Medecine and Aedes proteins from VectorBase. The assign-
ment to orthologous groups was performed as described ear-
lier [9,59,60]. Namely, we retained the longest open reading
frame per locus and performed all-against-all comparisons
using the Smith-Waterman algorithm as implemented in Par-
Align [61] with default parameters. The orthologous groups
were then assembled from the best reciprocal hits (BRHs;
reciprocally best maching genes in between-genome-compar-
isons) applying a COG-like [62] procedure to join BRHs
across three or more species, going from the best scoring ones
until an E-value cut-off of 10
-6
, and keeping single BRH pairs
only with E-values less than 10
-10
. Furthermore, the ortholo-
gous groups were expanded by genes that are more similar to
each other within a proteome than to any gene in any of the
other species, and by very similar copies that share over 97%
sequence identity, which were identified initially using CD-hit
[63]. All proteins in a group were required to have aligned
regions overlapping by at least 20 residues to avoid the
'domain walking' effect.
Species tree
A maximum likelihood species tree was calculated using the
concatenated multiple alignments of 1,150 orthologs present
in exactly one copy in all the organisms studied here. Multiple
protein alignments were produced using muscle [64] and
confidently aligned regions were extracted using Gblocks [65]
with default settings. Individual protein alignments were
concatenated into a 336,069 amino acid superalignment that
was then subjected to maximum-likelihood analysis using the
JTT model (G4+I+F) as implemented in PhyML [66] and we
used Tree-Puzzle [67] to join separate bootstrap analyses. All
shown branchings have at least 99% bootstrap support esti-
mated from 500 replicates.
Quantification of losses and correlation with other
traits
Species radiation dates were taken from the literature: for
insects from [18] and for vertebrates from [68,69]. We used
MatLab version 7.2 (MathWorks, Natick MA, USA) for statis-
tical analysis and data plotting. Regression lines were
required to cross the origin. For each category of orthologs,
the slopes of the regression lines for insects and vertebrates
were compared based on a Student's t-distribution and were
found not to be significantly different. Because traits were not
normally distributed, we used non-parametric Spearman's
correlation coefficients and Mann-Whitney U tests. Chicken
data were excluded from graphs and statistical tests (see
Discussion).
Manual analysis of case studies
Selected orthologous groups were examined manually as fol-
lows. The absence of Tribolium proteins was verified by
screening the Tribolium proteome, genome (assembled and
single reads) and expressed sequence tags using the Baylor
College of Medicine blast server [70]. All sufficiently similar
sequences, including members of other orthologous groups,
were aligned using muscle v3.6 [64] with default settings and
all positions containing gaps were trimmed from conserved
blocks using Gblocks [65]. Phylogenetic trees were con-
structed using maximum likelihood as implemented in
PhyML [66] using the JTT model of amino acid substitution,
a gamma distribution of rates over four rate categories and
100 bootstraps.
Pathway mapping and database searches
We used pathway annotations from the KEGG database [71],
mapping genes to Biocarta and co-citation analysis using
Webgestalt [29] web interface. For data mining we used
Ensembl [72], Swiss-prot/UniProt [73], Flybase [74], the
Interactive Fly [22] and Online Mendelian Inheritance in
Man [75] annotations.
Abbreviations
ABCA1, ATP-binding cassette transporter A1; BRH, best
reciprocal hit; CRLF3, cytokine receptor-like factor 3; GO,
Gene Ontology; I, insect-specific orthologs; MYA, million
years ago; N, universal multiple-copy orthologs; P, patchy
orthologs; TERT, insect telomerase reverse transcriptase; U,
universal single-copy orthologs; V, vertebrate-specific
orthologs.
Authors' contributions
SW and EMZ analyzed the data and wrote the manuscript. EK
contributed the orthology data and the species phylogeny. RS
and TK contributed experimental characterization of exclu-
Genome Biology 2007, 8:R242
Genome Biology 2007, Volume 8, Issue 11, Article R242 Wyder et al. R242.10
sive Tribolium and honeybee orthologs of human genes. EMZ
supervised the project.
Additional data files
The following additional data are available with the online
version of this paper. Additional data file 1 is a graph showing
the correlation between the absolute number of lost ortholo-
gous groups and and the rate of amino acid substitutions.
Additional data files 2 and 3 provide the phylogenetic analysis
of SID-1 and CDC7, respectively. Additional data file 4 is a
table listing GO analysis of insect-specific orthologous groups
lost in all Dipterans. Additional data file 5 is a table listing
functionally linked genes coeliminated in the Diptera and
Drosophila lineages. Additional file 6 provides the phyloge-
netic analysis of Fboxo7/cdk4/cyclin D. Additional data file 7
is a figure showing the alignment of Fboxo7 proteins.
Additional data File 1Correlation between the absolute number of lost orthologous groups and the rate of amino acid substitutionsCorrelation between the absolute number of lost orthologous groups and the rate of amino acid substitutions.Click here for fileAdditional data File 2Phylogenetic analysis of SID-1 proteinsPhylogenetic analysis of SID-1 proteins.Click here for fileAdditional data File 3Phylogenetic analysis of CDC7 proteinsPhylogenetic analysis of CDC7 proteins.Click here for fileAdditional data File 4GO analysis of insect-specific orthologous groups lost in all DipteransGO analysis of insect-specific orthologous groups lost in all Dipterans.Click here for fileAdditional data File 5Coeliminiation of functionally linked genes in the Diptera and Dro-sophila lineagesCoeliminiation of functionally linked genes in the Diptera and Dro-sophila lineages.Click here for fileAdditional data File 6Phylogenetic analysis of Fboxo7, cdk4 and cyclin DPhylogenetic analysis of Fboxo7, cdk4 and cyclin D.Click here for fileAdditional data File 7Alignment of Fboxo7 proteinsAlignment of Fboxo7 proteins.Click here for file
Acknowledgements
We thank Hugh Robertson for sharing unpublished data, Peer Bork for
stimulating discussions, and Robert M Waterhouse for help with the man-
uscript. Swiss National Science Foundation is acknowledged for funding
(SNF 3100A0-112588 to EMZ).
References
1. Samonte RV, Eichler EE: Segmental duplications and the evolu-
tion of the primate genome. Nat Rev Genet 2002, 3:65-72.
2. Zhang J: Evolution by gene duplication: an update. Trends Ecol
Evol 2003, 18:292-298.
3. Brosius J: RNAs from all categories generate retrosequences
that may be exapted as novel genes or regulatory elements.
Gene 1999, 238:115-134.
4. Niimura Y, Nei M: Evolutionary dynamics of olfactory and
other chemosensory receptor genes in vertebrates. J Human
Genet 2006, 51:505-517.
5. Gilad Y, Wiebe V, Przeworski M, Lancet D, Paabo S: Loss of olfac-
tory receptor genes coincides with the acquisition of full tri-
chromatic vision in primates. PLoS Biol 2004, 2:E5.
6. Olson MV: When less is more: gene loss as an engine of evo-
lutionary change. Am Human Genet 1999, 64:18-23.
7. Wang X, Grus WE, Zhang J: Gene losses during human origins.
PLoS Biol 2006, 4:e52.
8. Greenberg AJ, Moran JR, Fang S, Wu CI: Adaptive loss of an old
duplicated gene during incipient speciation. Mol Biol Evol 2006,
23:401-410.
9. Weinstock GM, Robinson GE, Gibbs RA, Worley KC, Evans JD,
Maleszka R, Robertson HM, Weaver DB, Beye M, Bork P, et al.:
Insights into social insects from the genome of the honeybee
Apis mellifera. Nature 2006, 443:931-949.
10. Consortium TGS: The first genome sequence of a beetle, Tri-
bolium castaneum, a model for insect development and pest
biology. Nature in press.
11. Grimaldi D, Engel M: Evolution of the Insects Cambridge: Cambridge
University Press; 2005.
12. Demuth JP, Bie TD, Stajich JE, Cristianini N, Hahn MW: The evolu-
tion of Mammalian gene families. PLoS ONE 2006,
1:e85.
13. Blomme T, Vandepoele K, De Bodt S, Simillion C, Maere S, Van de
Peer Y: The gain and loss of genes during 600 million years of
vertebrate evolution. Genome Biol 2006, 7:R43.
14. Koonin EV, Fedorova ND, Jackson JD, Jacobs AR, Krylov DM,
Makarova KS, Mazumder R, Mekhedov SL, Nikolskaya AN, Rao BS, et
al.: A comprehensive evolutionary classification of proteins
encoded in complete eukaryotic genomes. Genome Biol 2004,
5:R7.
15. Hughes AL, Friedman R: Differential loss of ancestral gene fam-
ilies as a source of genomic divergence in animals. Proc Biol Sci
2004, 271(Suppl 3):S107-109.
16. Wang Y, Jorda M, Jones PL, Maleszka R, Ling X, Robertson HM,
Mizzen CA, Peinado MA, Robinson GE: Functional CpG methyla-
tion system in a social insect. Science 2006, 314:645-647.
17. Rubin EB, Shemesh Y, Cohen M, Elgavish S, Robertson HM, Bloch G:
Molecular and phylogenetic analyses reveal mammalian-like
clockwork in the honey bee (Apis mellifera) and shed new
light on the molecular evolution of the circadian clock.
Genome Res 2006, 16:1352-1365.
18. Zdobnov EM, Mering C, Letunic I, Bork P: Consistency of genome-
based methods in measuring Metazoan evolution. FEBS Lett
2005, 579:3355-3361.
19. Savard J, Tautz D, Richards S, Weinstock GM, Gibbs RA, Werren JH,
Tettelin H, Lercher MJ: Phylogenomic analysis reveals bees and
wasps (Hymenoptera) at the base of the radiation of Holom-
etabolous insects. Genome Res 2006, 16:1334.
20. Glise B, Miller CA, Crozatier M, Halbisen MA, Wise S, Olson DJ, Vin-
cent A, Blair SS: Shifted, the Drosophila ortholog of Wnt inhib-
itory factor-1, controls the distribution and movement of
Hedgehog. Dev Cell 2005, 8:255-266.
21. Kernan M, Cowan D, Zuker C: Genetic dissection of mechano-
sensory transduction: mechanoreception-defective muta-
tions of Drosophila. Neuron 1994, 12:1195-1206.
22.
The Interactive Fly [ />shifted4.htm]
23. Zdobnov EM, von Mering C, Letunic I, Torrents D, Suyama M, Copley
RR, Christophides GK, Thomasova D, Holt RA, Subramanian GM, et
al.: Comparative genome and proteome analysis of Anophe-
les gambiae and Drosophila melanogaster. Science 2002,
298:149-159.
24. Robertson HM, Gordon KHJ: Canonical TTAGG-repeat telom-
eres and telomerase in the honey bee, Apis mellifera. Genome
Res 2006, 16:1345.
25. Pellegrini M, Marcotte EM, Thompson MJ, Eisenberg D, Yeates TO:
Assigning protein functions by comparative genome analy-
sis: Protein phylogenetic profiles. Proc Natl Acad Sci USA 1999,
96:4285-4288.
26. Aravind L, Watanabe H, Lipman DJ, Koonin EV: Lineage-specific
loss and divergence of functionally linked genes in
eukaryotes. Proc Natl Acad Sci USA 2000, 97:11319-11324.
27. Barker D, Pagel M: Predicting functional gene links from phyl-
ogenetic-statistical analyses of whole genomes. Plos Comput
Biol 2005, 1:24-31.
28. Stark C, Breitkreutz BJ, Reguly T, Boucher L, Breitkreutz A, Tyers M:
BioGRID: a general repository for interaction datasets.
Nucleic Acids Res 2006, 34:D535-539.
29. Zhang B, Kirov S, Snoddy J: WebGestalt: an integrated system
for exploring gene sets in various biological contexts. Nucleic
Acids Res 2005, 33:W741-W748.
30. Will CL, Luhrmann R: Splicing of a rare class of introns by the
U12-dependent spliceosome. Biol Chem 2005, 386:713-724.
31. Adams MD, Celniker SE, Holt RA, Evans CA, Gocayne JD, Amanati-
des PG, Scherer SE, Li PW, Hoskins RA, Galle RF: The Genome
Sequence of Drosophila melanogaster. Science 2000, 287:2185.
32. Schneider C, Will CL, Brosius J, Frilander MJ, Luhrmann R: Identifi-
cation of an evolutionarily divergent U11 small nuclear ribo-
nucleoprotein particle in Drosophila
. Proc Natl Acad Sci USA
2004, 101:9584-9589.
33. Mount SM, Gotea V, Lin CF, Hernandez K, Makalowski W: Spliceo-
somal small nuclear RNA genes in 11 insect genomes. RNA
2007, 13:5-14.
34. Sheth N, Roca X, Hastings ML, Roeder T, Krainer AR, Sachidanandam
R: Comprehensive splice-site analysis using comparative
genomics. Nucleic Acids Res 2006, 34:3955-3967.
35. Spoelgen R, von Arnim CA, Thomas AV, Peltan ID, Koker M, Deng A,
Irizarry MC, Andersen OM, Willnow TE, Hyman BT: Interaction of
the cytosolic domains of sorLA/LR11 with the amyloid pre-
cursor protein (APP) and beta-secretase beta-site APP-
cleaving enzyme. J Neurosci 2006, 26:418-428.
36. Bell SP, Dutta A: DNA replication in eukaryotic cells. Annu Rev
Biochem 2002, 71:333-374.
37. Mu X, Lee YF, Liu NC, Chen YT, Kim E, Shyr CR, Chang C: Tar-
geted inactivation of testicular nuclear orphan receptor 4
delays and disrupts late meiotic prophase and subsequent
meiotic divisions of spermatogenesis. Mol Cell Biol 2003,
24:5887-5899.
38. Hardy CFJ, Dryga O, Seematter S, Pahl PMB, Sclafani RA: mcm5/
cdc46-bob1 bypasses the requirement for the S phase activa-
tor Cdc7p. Proc Natl Acad Sci USA 1997, 94:3151-3155.
Genome Biology 2007, Volume 8, Issue 11, Article R242 Wyder et al. R242.11
Genome Biology 2007, 8:R242
39. Hamon Y, Broccardo C, Chambenoit O, Luciani MF, Toti F, Chaslin
S, Freyssinet JM, Devaux PF, McNeish J, Marguet D: ABC1 pro-
motes engulfment of apoptotic cells and transbilayer redis-
tribution of phosphatidylserine. Nat Cell Biol 2000, 2:399-406.
40. Sheps JA, Ralph S, Zhao ZY, Baillie DL, Ling V: The ABC trans-
porter gene family of Caenorhabditis elegans has implications
for the evolutionary dynamics of multidrug resistance in
eukaryotes. Genome Biol 2004, 5:R15.
41. Munehira Y, Ohnishi T, Kawamoto S, Furuya A, Shitara K, Imamura
M, Yokota T, Takeda S, Amachi T, Matsuo M: {alpha} 1-Syntrophin
modulates turnover of ABCA1. Biol Chem 2004,
279:15091-15095.
42. Foltz DR, Jansen LE, Black BE, Bailey AO, Yates JR 3rd, Cleveland
DW: The human CENP-A centromeric nucleosome-associ-
ated complex. Nat Cell Biol 2006, 8:458-469.
43. Hoffmann JA, Reichhart JM: Drosophila innate immunity: an evo-
lutionary perspective. Nat Immunol 2002, 3:121-126.
44. Hsu JM, Lee YC, Yu CT, Huang CY: Fbx7 functions in the SCF
complex regulating Cdk1-cyclin B-phosphorylated
hepatoma up-regulated protein (HURP) proteolysis by a
proline-rich region. Biol Chem 2004, 279:32592-32602.
45. Laman H, Funes JM, Ye H, Henderson S, Galinanes-Garcia L, Hara E,
Knowles P, McDonald N, Boshoff C: Transforming activity of
Fbxo7 is mediated specifically through regulation of cyclin D/
cdk6. EMBO J 2005, 24:3104-3116.
46. Datar SA, Jacobs HW, de la Cruz AFA, Lehner CF, Edgar BA: The
Drosophila cyclin D-cdk4 complex promotes cellular growth.
EMBO J 2000, 19:4543-4554.
47. Meyer CA, Jacobs HW, Datar SA, Du W, Edgar BA, Lehner CF: Dro-
sophila Cdk4 is required for normal growth and is dispensa-
ble for cell cycle progression. EMBO J 2000, 19:4533-4542.
48. Hillier LW, Miller W, Birney E, Warren W, Hardison RC, Ponting CP,
Bork P, Burt DW, Groenen MAM, Delany ME, et al.: Sequence and
comparative analysis of the chicken genome provide unique
perspectives on vertebrate evolution. Nature 2004,
432:695-716.
49. Kamath RS, Fraser AG, Dong Y, Poulin G, Durbin R, Gotta M, Kana-
pin A, Le Bot N, Moreno S, Sohrmann M: Systematic functional
analysis of the Caenorhabditis elegans genome using RNAi.
Nature 2003, 421:231-237.
50. Gu Z, Steinmetz LM, Gu X, Scharfe C, Davis RW, Li WH: Role of
duplicate genes in genetic robustness against null mutations.
Nature 2003, 421:63-66.
51. Kimura M, Takahata N: Selective constraint in protein polymor-
phism: study of the effectively neutral mutation model by
using an improved pseudosampling method. Proc Natl Acad Sci
USA 1983, 80:1048-1052.
52. Ohta T: Slightly deleterious mutant substitutions in
evolution. Nature 1973, 246:96-98.
53. Pál C, Papp B, Lercher MJ: An integrated view of protein
evolution. Nat Rev Genet 2006, 7:337-348.
54. Rand DM, Kann LM: Excess amino acid polymorphism in mito-
chondrial DNA: contrasts among genes from Drosophila,
mice, and humans. Mol Biol Evol 1996, 13:735-748.
55. Kohne DE: Evolution of higher-organism DNA. Quart Rev
Biophys 1970, 3:327-375.
56. Kumar S: Molecular clocks: four decades of evolution. Nat Rev
Genet 2005, 6:654-662.
57. Wagner A: Does evolutionary plasticity evolve? Evolution 1996,
50:1008-1023.
58. Earl DJ, Deem MW: Evolvability is a selectable trait. Proc Natl
Acad Sci USA 2004, 101:11531-11536.
59. Kriventseva EV, Rahman N, Espinosa O, Zbodnov EM: OrthoDB:
the hierarchical catalog of eukaryotic orthologs. Nucleic Acids
Res 2007. doi:10.1093/nar/gkm845.
60. Zdobnov EM, Bork P: Quantification of insect genome
divergence. Trends Genet 2007, 23:16-20.
61. Saebo PE, Andersen SM, Myrseth J, Laerdahl JK, Rognes T: PARA-
LIGN: rapid and sensitive sequence similarity searches pow-
ered by parallel computing technology. Nucleic Acids Res 2005,
33:W535-539.
62. Tatusov RL, Koonin EV, Lipman DJ: A genomic perspective on
protein families. Science 1997, 278:631-637.
63. Li W, Godzik A: Cd-hit: a fast program for clustering and com-
paring large sets of protein or nucleotide sequences. Bioinfor-
matics 2006, 22:1658-1659.
64. Edgar RC: MUSCLE: multiple sequence alignment with high
accuracy and high throughput. Nucleic Acids Res 2004,
32:1792-1797.
65. Castresana J: Selection of conserved blocks from multiple
alignments for their use in phylogenetic analysis. Mol Biol Evol
2000, 17:540-552.
66. Guindon S, Gascuel O: A simple, fast, and accurate algorithm
to estimate large phylogenies by maximum likelihood. Syst
Biol 2003, 52:696-704.
67. Schmidt HA, Strimmer K, Vingron M, von Haeseler A: TREE-PUZ-
ZLE: maximum likelihood phylogenetic analysis using quar-
tets and parallel computing. Bioinformatics 2002, 18:502-504.
68. Kumar S, Hedges SB: A molecular timescale for vertebrate
evolution. Nature 1998, 392:917-920.
69. Hedges SB: The origin and evolution of model organisms. Nat
Rev Genet 2002, 3:838-849.
70. Baylor College of Medicine Blast Server: T. castaneum [http:/
/www.hgsc.bcm.tmc.edu/blast/blast.cgi?organism=Tcastaneum]
71. Kanehisa M, Goto S: KEGG: Kyoto Encyclopedia of Genes and
Genomes. Nucleic Acids Res 2000, 28:27-30.
72. Hubbard TJP, Aken BL, Beal K, Ballester B, Caccamo M, Chen Y,
Clarke L, Coates G, Cunningham F, Cutts T, et al.: Ensembl 2007.
Nucleic Acids Res 2007, 35:D610-617.
73. Bairoch A, Bougueleret L, Altairac S, Amendolia V, Auchincloss A, Puy
GA, Axelsen K, Baratin D, Blatter MC, Boeckmann B, et al.: The uni-
versal protein resource (UniProt). Nucleic Acids Res 2007,
35:D193-D197.
74. Crosby MA, Goodman JL, Strelets VB, Zhang PL, Gelbart WM: Fly-
Base: genomes by the dozen. Nucleic Acids Res 2007,
35:D486-D491.
75. Online Mendelian Inheritance in Man [http://
www.ncbi.nlm.nih.gov/omim]
76. Schoppmeier M, Schröder R: Maternal torso signaling controls
body axis elongation in a short germ insect. Curr Biol 2005,
15:2131-2136.