Statistical Methods for Survival Data Analysis Third Edition phần 2 potx
Bạn đang xem bản rút gọn của tài liệu. Xem và tải ngay bản đầy đủ của tài liệu tại đây (239.31 KB, 54 trang )
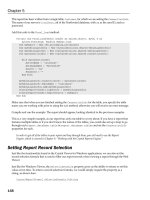
Figure 3.13 Curves of log[9log S(t)] for the two hypertension groups.
Table 3.9 Significant Variables (at 0.05 Level) Identified by Proportional Hazards
Model
Relative Risk@ Ratio
Regression p Value of
Variable? Coefficient (Ward Test) Favorable Unfavorable Risk
Age 0.0558 :0.001 9.32 28.45 3.05
Hypertension: 0.6360 :0.001 1.00 1.89 1.89
1, yes, 0, no
Duration of 0.0559 :0.001 1.32 2.19 1.66
diabetes
Fasting plasma 0.0023 :0.010 1.35 1.58 1.17
glucose
BMI 90.0330 0.035 0.32 0.44 0.72
Proteinuria: 0.3744 0.025 1.00 1.45 1.45
1, yes, 0, no
Use of diuretics: 0.4191 0.030 1.00 1.52 1.52
1, yes; 0, no
? Variables are listed in order of entry into model with a p-value limit for entry of 0.05.
@ Favorable categories are 40 years of age, no hypertension, duration of diabetes 5 years, fasting
plasma glucose 130mg/dL, BMI 35, no proteinuria, and no diuretics use. Unfavorable categories
are 60 years of age, hypertensive, duration of diabetes 14 years, fasting plasma glucose 200 mg/dL,
BMI 25, having proteinuria, and diuretics use.
EXAMPLE 3.5: IDENTIFICATION OF RISK FACTORS
41
developed the eye disease during the 10 to 16-year follow-up period (average
follow-up time 12.7 years). Twelve potential factors (assessed at time of baseline
examination) were examined by univariate and multivariate methods for their
relationship to retinopathy (RET): age, gender, duration of diabetes (DUR),
fasting plasma glucose (GLU), initial treatment (TRT), systolic (SBP) and
diastolic blood pressure (DBP), body mass index (BMI), plasma cholesterol
(TC), plasma triglyceride (TG), and presence of macrovascular disease (LVD)
or renal disease (RD). Table 3.10 gives the data for the first 40 patients. Among
other things, the authors related these variables to the development of
retinopathy.
1. Examine the individual relationship of each variable to the development of
diabetic retinopathy. Table 3.11 gives some summary statistics of the eight
continuous variables for patients who have developed retinopathy and for
those who have not. Notice that patients who have developed the disease were
younger at baseline and had much higher fasting plasma glucose, systolic and
diastolic blood pressure, and plasma triglyceride than did patients who have
not. Table 3.12 summarizes the contingency table analysis of retinopathy
incidence rates. The number of patients at risk of developing retinopathy and
the number of patients who developed the disease (and rate) are given by
subcategory of each potential risk factor. Using the chi-square test, it is found
that there was a significant difference in the retinopathy rate among the
subcategories of several variables using a significance level of 0.05: duration of
diabetes, fasting plasma glucose, systolic and diastolic blood pressure, and
treatment. It appears that patients with poor glucose control or high blood
pressure or treated with oral agents or insulin have a higher incidence of
retinopathy. In addition, patients with high triglyceride levels tend to have
higher incidence of retinopathy (p : 0.064). However, patients who had
developed macrovascular disease at the time of baseline examination had a
lower retinopathy incidence. The authors state that this may be due to the fact
that 68% of the patients who had macrovascular disease either died (54%)
during the follow-up period or were lost to follow-up (14%). Many of these
patients may have developed retinopathy, particularly the patients who have
died, but were not included. Therefore, the lower incidence of retinopathy in
patients who had macrovascular disease at baseline is probably the result of a
selection bias. Similarly, the large number of death plus the losses to follow-up
may also contribute to the drop in retinopathy rate in patients who had had
diabetes for more than 12 years at baseline. Among the 80 patients in this
duration of diabetes category, 56% have died and 10% did not participate in
the follow-up examination. The large number of deaths may also be responsible
for the finding that patients who survived long enough to develop retinopathy
were younger at baseline. The deceased patients were significantly older (mean
57 years) than the survivors who participated in the follow-up examination
(mean 48 years).
42 EXAMPLES OF SURVIVAL DATA ANALYSIS
Table 3.10 First 40 Patients Involved in Study of Risk Factors in Development of Diabetic Retinopathy
Patient RET? Age Gender DUR TRT@ GLU SBP DBP TC TG BMI LVD? RD?
1 1 47.6 M 4 2 100 156 98 195 405 33.1 0 0
2 0 54.4 M 7 1 112 112 78 204 77 31.7 0 0
3 0 50.8 M 4 2 83 134 80 206 178 41.5 1 0
4 1 49.4 F 5 2 276 102 70 190 222 24.1 0 0
5 1 50.0 M 2 2 104 142 86 178 100 39.5 0 0
6 1 50.7 F 7 2 242 142 78 217 268 31.6 0 1
7 1 35.3 F 2 2 130 134 80 390 564 47.0 0 0
8 0 50.2 F 5 2 130 100 70 174 128 29.8 0 0
9 1 45.0 M 5 2 115 134 100 238 177 18.9 1 0
10 0 38.3 M 2 2 110 132 80 204 180 31.2 1 0
11 0 45.8 F 5 3 130 118 68 185 316 26.6 1 0
12 1 51.6 F 3 2 141 112 78 152 77 31.2 0 1
13 1 36.3 M 6 2 238 142 94 194 162 24.2 0 0
14 1 44.7 F 16 2 190 152 90 132 161 32.0 0 0
15 1 37.2 F 1 2 126 136 90 133 211 32.7 0 0
16 1 52.6 F 9 2 159 140 76 151 132 26.7 0 0
17 1 44.1 M 1 1 116 126 76 251 153 33.3 0 0
18 1 35.9 M 3 1 120 132 80 129 76 30.1 0 0
19 1 50.4 M 1 2 128 144 90 190 123 27.7 0 0
20 1 48.0 M 1 2 95 128 74 207 59 28.1 1 0
21 0 47.5 F 1 2 85 124 82 161 190 31.6 1 0
22 1 50.1 F 6 2 138 106 72 181 135 30.5 0 1
(Continued overleaf )
43
Table 3.10 Continued
Patient RET? Age Gender DUR TRT@ GLU SBP DBP TC TG BMI LVD? RD?
23 0 43.3 F 1 1 104 128 86 204 198 26.1 0 0
24 1 54.5 M 0 3 104 142 84 490 540 30.8 1 0
25 1 52.2 F 3 3 304 132 84 192 119 36.9 1 0
26 1 53.3 F 3 2 249 128 72 120 85 35.5 0 0
27 1 64.3 F 6 2 297 138 80 145 64 30.1 1 0
28 1 44.6 F 4 1 139 112 80 156 111 36.1 0 1
29 1 47.1 F 2 2 169 130 84 198 99 39.0 0 1
30 1 46.5 F 7 1 159 128 78 238 157 34.5 0 0
31 0 51.5 F 3 1 147 128 78 185 182 32.0 0 0
32 1 59.5 M 3 2 180 132 78 188 308 28.1 1 0
33 1 52.0 F 6 2 183 142 84 175 68 37.6 0 0
34 1 45.7 F 6 2 180 138 80 179 189 44.1 1 0
35 1 48.2 F 18 2 267 158 100 195 112 25.2 1 0
36 1 57.4 M 0 1 159 172 108 219 294 33.7 0 1
37 1 42.0 F 4 2 158 106 68 224 157 33.6 0 0
38 1 50.7 F 1 2 211 142 84 390 645 37.1 0 0
39 1 53.8 F 0 1 177 154 80 175 208 35.3 0 1
40 0 56.9 M 1 1 98 116 70 146 97 26.5 0 1
? 1, yes; 0, no.
@ 1, diet only; 2, oral agent; 3, insulin.
44
Table 3.11 Summary Statistics for Eight Variables by Retinopathy Status at Follow-up
Retinopathy Status
No Yes
Variable Mean S.D. Mean S.D. p Value
Age 50.0 9.0 47.2 7.4 0.01
Duration of diabetes 4.2 4.5 4.8 4.4 0.34
Fasting plasma glucose 141.8 65.6 196.3 76.6 :0.0001
Systolic blood pressure 128.0 15.7 132.6 17.3 0.04
Diastolic blood pressure 80.3 10.8 84.9 10.1 :0.001
Body mass index 32.3 6.3 32.5 5.9 0.76
Cholesterol 204.4 66.0 206.8 58.7 0.76
Triglyceride 180.5 111.1 234.4 273.3 0.01
2. Examine the simultaneous relationship of the variables to the development
of retinopathy. Univariate analysis of each variable using the contingency table
or the chi-square test gives a preliminary idea of which individual variable
might be of prognostic importance. The simultaneous effect of all the variables
can be analyzed by the linear logistic regression model (discussed in Section
14.2) to determine the relative importance of each.
The 12 variables were fitted to the linear logistic regression model using a
stepwise selection procedure. The variables most significantly related to the
development of retinopathy were found to be initial treatment, fasting plasma
glucose, age, and diastolic blood pressure (p - 0.001). Table 3.13 gives the
regression coefficients of the four most significant variables (p - 0.05), the
standard errors, and adjusted odds ratios [exp(coefficient)]. The p values used
here are the significance levels based on the likelihood ratio test or the
improvement in the maximum likelihood due to the addition of the variable in
the stepwise procedure. This method is more powerful than the Wald test,
which is based on the standardized regression coefficients (Chapter 14). The
results are consistent with those in the univariate analysis.
On the basis of the regression coefficients, the probability of developing
retinopathy during a 10 to 16-year follow-up can be estimated by substituting
values of the risk factors into the regression equation,
log
P
1 9 P
:92.373 ; 1.495 (oral agent) ; 0.882 (insulin)
; 0.014 (GLU) 9 0.074 (age) ; 0.048 (DBP)
For example, for a 50-year-old patient who is on oral agents and whose fasting
plasma glucose and diastolic blood pressure are 170 mg/dl and 95 mmHg,
EXAMPLE 3.5: IDENTIFICATION OF RISK FACTORS 45
Table 3.12 Cumulative Incidence Rates of Retinopathy by Baseline Variables
Developed Retinopathy
Number of
Variable Persons at Risk Number Percent p value
Gender
Female 211 151 71.6
0.384
Male 101 77 76.2
Age (yr)
:35 13 10 76.9
35—44 101 77 76.2
0.242
45—54 155 115 74.2
.55 43 26 60.5
Duration of diabetes (yr)
:4 153 105 68.6
4—7 113 86 76.1
0.033
8—11 23 22 95.7
.12 23 15 65.2
Fasting plama glucose (mg/dl)
:140 117 62 53.0
140—199 90 74 82.2 :0.001
.200 105 92 87.6
Systolic blood pressure (mmHg)
:130 145 95 65.5
130—159 149 115 78.8 0.016
.160 20 18 85.7
Diastolic blood pressure (mmHg)
:85 179 118 65.9
85—94 87 73 83.9 0.004
.95 46 37 80.4
Plasma cholesterol (mg/dl)
:240 267 193 72.3
0.442
.240 45 35 77.8
Plasma triglyceride (mg/dl)
:250 237 167 70.5
0.064
.250 75 61 81.3
Body mass index (kg/m)
:28 73 49 67.1
28—33 121 94 77.7 0.261
.34 118 85 72.0
Renal disease
No 251 179 71.3
0.155
Yes 61 49 80.3
Macrovascular disease
No 205 157 76.6
0.053
Yes 107 71 66.4
Treatment (initial)
Diet alone 115 62 53.9
Oral agent 158 136 86.1 :0.001
Insulin 37 29 78.4
46 EXAMPLES OF SURVIVAL DATA ANALYSIS
Table 3.13 Results of Logistic Regression Analysis
Standard
Variable Coefficient Error exp(coefficient) Coefficient/S.E.
Constant 92.373 1.557
Initial treatment
Oral agent 1.495 0.330 4.459 4.53
Insulin 0.882 0.488 2.416 1.81
Fasting plasma
0.014 0003 1.014 4.67glucose
Age 90.074 0019 0.929 93.89
Diastolic blood
0.048 0.015 1.049 3.20pressure
respectively, the chance of developing retinopathy in the next 10 to 16 years is
91%.
The linear logistic regression model is useful in identifying important risk
factors. However, complete measurements of all the variables are needed;
missing data are a problem. In this example, complete data are available on
most of the patients. This may not always be the case. Although there are
methods of coping with missing data (discussed in Section 11.1), none is
perfect. Thus it is extremely important for investigators to make every effort to
obtain complete data on every subject.
Bibliographical Remarks
It is impossible to cite all the published examples of survival data analysis
similar to those in this chapter. Other similar studies can be found in the
literature: for example, Biometrics, Biometrika, Cancer, Journal of Chronic
Disease, Journal of the National Cancer Institute, American Journal of Epi-
demiology, Journal of the American Medical Association, and New England
Journal of Medicine. An easy way to find examples is to use the National
Library of Medicine’s Web site and search the file PubMed with appropriate
keywords.
EXERCISES
The four sets of data below are taken from actual research situations. Although
the data can be used for various analyses throughout the book, the reader is
asked here only to describe in detail how the data can be analyzed. The data
appear in examples and other exercises in subsequent chapters.
3.1 Thirty-three patients with hypernephroma were treated with combined
chemotherapy, immunotherapy, and hormonal therapy. Exercise Table 3.1
EXERCISES 47
Exercise Table 3.1 Data for 33 Patients with Hypernephroma
Date of
Date Death or Skin Test ResultsA
Treatment Last
Patient Age Gender Started Response? Follow-up Status@ Monilia Mumps PPD PHA SK-SD
1 53 F 3/31/77 1 10/1/77 0 7;723;23 0;025;25 0;0
2 61 M 6/18/76 0 8/21/76 1 10;10 15;20 0;013;13 9;9
3 53 F 2/1/77 3 10/1/77 0 0;07;70;025;25 0;0
4 48 M 12/19/74 2 1/15/76 1 0;00;00;00;00;0
5 55 M 11/10/75 0 1/15/76 1 12;12 ND 10;10 8;85;5
6 62 F 10/7/74 2 4/5/75 1 10;10 5;50;07;75;5
7 57 M 10/28/74 0 1/6/75 1 15;15 15;15 0;00;010;10
8 53 M 10/6/75 2 6/18/77 1 0;0ND0;012;12 0;0
9 45 M 4/11/77 0 10/1/77 0 6;44;40;00;00;0
10 58 M 8/4/76 3 2/11/77 1 13;13 13;13 22;22 23;23 0;0
11 61 F 1/1/77 3 10/1/77 0 0;08;817;17 11;11 0;0
12 61 M 7/25/76 1 10/1/77 0 9;912;12 0;020;20 0;0
13 77 M 5/8/75 0 9/26/75 1 0;00;00;00;00;0
14 55 M 4/27/77 2 10/1/77 0 0;00;015;15 10;10 0;0
15 50 M 4/20/77 3 10/1/77 0 0;014;14 5;532;32 21;21
16 42 M 8/24/76 0 10/1/77 0 11;11 7;70;012;12 0;0
48
17 50 F 1/8/75 0 6/30/75 1 0;00;00;00;00;0
18 66 F 9/8/76 3 10/1/77 0 9;910;10 6;615;15 11;11
19 58 M 2/18/75 0 10/1/77 0 0;00;00;00;0ND
20 62 M 5/12/76 0 10/17/76 1 2;2NDND3;32;2
21 71 F 10/22/76 3 12/12/76 1 10;10 6;60;012;12 0;0
22 44 M 6/6/77 3 10/1/77 0 10;10 10;10 0;020;20 0;0
23 69 M 6/21/76 0 10/13/76 1 0;015;15 25;25 25;25 0;0
24 56 M 6/7/77 2 10/1/77 0 0;07;70;00;00;0
25 57 M 11/16/76 0 12/10/76 1 11;11 5;50;020;20 0;0
26 69 M 5/10/77 0 7/25/77 1 0;00;00;015;15 0;0
27 60 M 6/29/77 0 7/7/77 1 0;00;00;026;26 0;0
28 60 M 7/21/75 3 10/1/77 0 11;11 20;20 10;10 18;18 0;0
29 72 M 7/19/75 0 10/18/75 1 10;10 0;07;710;10 0;0
30 42 F 3/3/75 0 4/23/75 1 0;0ND0;00;00;0
31 57 M 2/24/77 2 10/1/77 0 5;58;80;025;15 0;0
32 66 M 6/15/77 3 10/1/77 0 0;015;15 0;010;10 0;0
33 59 M 3/4/77 0 4/2/77 1 0;00;00;016;16 0;0
Source: Data courtesy of Richard Ishmael.
? 0, no response; 1, complete response; 2, partial response; 3, stable.
@ 0, alive; 1, dead.
A ND, not done.
49
gives the age, gender, date treatment began, response status, date of death
or last follow-up, survival status, and results of five pretreatment skin
tests. The investigator is interested in the response and survival of the
patients and in identifying prognostic factors. How would you analyze the
data?
3.2 In a study undertaken to compare the treatments given to hyperneph-
roma patients and to relate response and survival to surgery, metastasis,
and treatment time, data from 58 patients were collected (Exercise Table
3.2). How would you analyze the data to answer these questions?
(a) Do patients who had nephrectomy have a higher response rate?
(b) Is the time of nephrectomy related to response and survival?
(c) Are there significant differences between the treatments?
(d) What are the most important variables related to response and
survival?
3.3 Exercise Table 3.3 gives the age, gender, family history of melanoma,
remission duration, survival time, stage, and results of six pretreatment
skin tests (the larger diameter is given) of 102 stage 3 and 4 melanoma
patients (Lee et al., 1982).
(a) Study the immunocompetence of melanoma patients by investigating
skin test results.
(b) Determine if age, gender, or pretreatment skin test results are predic-
tive to remission and survival time.
(c) Find theoretical distributions that describe the survival and remission
patterns.
3.4 One hundred and forty-nine diabetic patients were followed for 17 years
(a subset of data from Lee et al., 1988). Exercise Table 3.4 gives the
survival time from baseline examination, survival status, and several
potential prognostic factors at baseline: age, body mass index (BMI), age
at diagnosis of diabetes, smoking status, systolic blood pressure (SBP),
diastolic blood pressure (DBP), electrocardiogram reading (ECG), and
whether the patient had any coronary heart disease (CHD). Identify the
important prognostic factors that are associated with survival.
50 EXAMPLES OF SURVIVAL DATA ANALYSIS
Exercise Table 3.2 Data of 58 Patients with Hypernephroma
Time of Survival Lung Bone
Patient Gender Age Nephrectomy@ NephrectomyA TreatmentB ResponseA Time StatusD Metastasis@ Metastasis@
12531 0.0 1 1 7701 0
21691 4.0 1 2 1810 1
31610 99.0 1 0 8 1 1 0
42521 2.0 1 2 6811 0
51461 2.0 1 2 3510 1
61551 0.0 1 0 811 0
72621 0.0 1 2 2611 0
81531 0.0 1 2 8410 1
91700 99.0 1 0 17 1 1 0
10 1 48 1 0.0 1 3 52 1 1 0
11 1 58 1 1.5 1 0 26 1 1 1
12 1 61 1 5.0 1 1 108 0 1 0
13 1 77 1 4.0 1 0 18 1 1 0
14 1 56 1 0.0 1 3 72 1 0 1
15 1 55 1 0.0 1 2 38 1 1 1
16 1 50 1 4.0 1 3 999 9 1 0
17 1 75 1 0.0 1 0 9 1 1 0
18 1 43 1 2.0 1 3 56 1 0 0
19 1 69 1 1.0 1 2 36 1 1 1
20 2 59 1 1.5 1 2 108 1 0 1
21 2 71 1 0.0 1 2 10 1 1 0
22 1 56 1 0.0 1 2 36 1 1 0
23 1 57 0 99.0 1 0 6 1 1 0
24 1 69 1 8.0 1 0 9 1 1 0
(Continued overleaf )
51
Exercise Table 3.2 Continued
Time of Survival Lung Bone
Patient Gender Age Nephrectomy@ NephrectomyA TreatmentB ResponseA Time StatusD Metastasis@ Metastasis@
25 1 72 0 99.0 1 0 12 1 1 0
26 1 67 1 0.0 1 9 5 0 1 0
27 1 41 1 2.0 1 2 104 0 1 0
28 1 77 1 10.0 1 0 6 1 1 0
29 2 63 1 2.0 1 3 115 1 0 1
30 2 42 1 12.0 1 0 9 1 0 0
31 1 59 0 99.0 1 0 21 1 0 0
32 1 62 1 5.0 1 0 14 1 1 0
33 1 65 1 0.0 1 0 52 1 1 0
34 2 53 0 99.0 1 0 9 1 0 1
35 1 57 1 0.0 1 2 48 1 1 0
36 2 60 0 99.0 1 0 15 1 1 1
37 1 59 1 0.0 1 0 5 1 1 0
38 1 75 1 0.0 2 3 28 0 1 0
39 2 53 1 0.0 2 2 25 0 1 0
40 2 67 1 5.0 2 3 25 0 0 1
41 1 58 1 8.0 2 3 40 1 1 1
42 1 62 1 8.0 2 0 16 1 1 1
43 1 69 0 99.0 2 0 8 1 1 1
52
44 1 44 1 0.0 2 2 70 0 1 0
45 1 60 1 1.0 2 0 6 1 0 1
46 1 57 0 99.0 2 0 8 1 1 1
47 1 45 1 2.0 2 4 12 1 1 0
48 2 50 1 1.0 2 4 20 1 1 0
49 1 58 0 99.0 2 4 8 1 1 0
50 1 51 1 0.0 2 3 999 0 0 1
51 1 59 1 3.0 2 3 12 1 1 0
52 1 53 1 0.0 2 1 181 0 1 0
53 1 70 1 0.5 2 0 20 1 1 1
54 1 69 1 3.0 2 0 14 1 1 0
55 1 62 1 0.0 2 3 26 1 0 0
56 1 52 1 2.0 2 0 16 1 1 0
57 1 77 1 2.0 2 2 30 1 1 0
58 1 61 1 8.0 2 0 20 1 1 0
Source: Data courtesy of Richard Ishmael.
? 1, male; 2, female.
@ 1, yes; 0, no.
A Number of years prior to treatment; negative value —no nephrectomy.
B 1, combined chemotherapy and immunotherapy, 2, others.
C 0, no response; 1, complete response; 2, partial response; 3, stable; 4, increasing disease; 9, unknown.
D 1, dead; 0, alive; 9, unknown.
53
Exercise Table 3.3 Data of 102 Patients with Stages 3 and 4 Melanoma
Family Remission Survival Skin TestsD
History of Time Remission Time Survival
Patient Age Gender Melanoma@ (months)A StatusB (months) StatusC Stage Monilia Mumps PPD PHA SK-SD Tricophyton
1 58 2 9 42.0 0 42.0 0 3B 18 16 0 20 14 99
2502 0 3.313.913B780070
3761 0 6.1110.513B01500990
4662 9 2.316.003B8001000
5 33 1 9 5.1 1 20.6 1 3B 17 10 0 5 18 99
6 55 2 0 11.1 0 21.8 0 4B 99 99 99 99 99 99
7 25 2 0 36.5 0 36.5 0 3B 7 5 0 8 90 99
8 23 1 0 24.3 0 24.3 0 3B 10 20 0 7 30 0
9 30 1 0 28.7 0 28.7 0 3B 8 99 0 6 10 17
10 34 1 9 7.7 0 7.7 0 3B 15 99 0 0 0 0
11 34 1 0 29.3 0 29.3 0 3B 15 99 0 7 10 0
12 26 2 0 5.9 1 19.3 1 3AB 0 99 0 42 25 0
13 27 1 9 2.6 1 6.9 1 3AB 15 99 0 10 10 0
14 72 2 9 16.7 0 18.0 0 4B 10 99 99 15 0 7
15 70 2 0 14.6 0 14.6 0 3B 0 99 0 16 0 20
16 82 2 0 999.0 9 23.6 0 4B 9 99 99 17 10 0
17 43 1 9 999.0 9 3.9 1 4B 25 0 0 7 20 5
18 52 1 9 999.0 9 7.3 1 4B 12 99 0 5 15 0
19 34 1 9 999.0 9 9.8 1 4B 13 20 0 15 30 30
20 48 1 0 26.5 0 26.5 0 4A 10 99 0 88 5 0
21 62 1 9 18.0 1 25.4 0 3AB 5 99 0 10 0 24
22 49 1 9 4.3 1 8.0 1 3B 0 99 8 3 0 0
23 46 1 0 0.3 1 13.8 1 3B 0 5 0 7 0 0
24 53 2 1 21.5 0 21.5 0 3A 16 20 14 14 18 12
25 21 2 9 999.0 9 9.3 1 4B 10 5 0 10 15 0
26 25 1 9 999.0 9 1.2 1 4B 15 10 5 18 10 5
27 35 2 0 999.0 9 20.0 1 4B 11 7 0 10 0 2
54
28 66 2 9 999.0 9 12.5 0 4B 99 99 99 99 99 99
29 54 2 0 999.0 9 7.4 1 4B 99 99 99 99 99 99
30 43 2 0 999.0 9 4.7 0 4B 13 19 9 11 30 0
31 40 1 0 13.3 0 13.3 0 3B 0 5 25 12 10 0
32 16 1 0 0.0 0 0.0 0 3B 7 10 14 10 0 0
33 59 1 0 999.0 9 25.8 0 4B 0 99 0 18 0 35
34 64 1 9 16.5 0 16.5 0 3B 8 7 0 0 0 0
35 52 1 9 999.0 9 2.5 1 4B 9 14 0 12 5 0
36 999 2 8 999.0 9 13.8 1 4B 30 75 0 35 0 12
37 27 1 0 999.0 9 4.2 1 4B 10 12 10 10 0 3
38 60 2 0 5.4 1 11.4 1 4B 20 10 0 10 0 0
39 73 1 9 999.0 9 5.8 1 4B 0 9 0 40 0 30
40 50 2 0 13.5 0 13.5 0 3B 0 8 0 10 5 0
41 63 2 0 999.0 9 2.7 1 4B 0 10 0 15 0 10
42 56 1 0 999.0 9 0.9 1 4B 6 6 0 15 0 0
43 62 2 0 2.1 1 8.0 1 3A 0 8 0 32 0 20
44 57 1 9 999.0 9 0.0 0 3AB 0 24 11 20 0 0
45 56 2 0 12.1 1 16.1 0 3B 0 5 0 25 6 30
46 41 2 1 999.0 9 13.3 1 4B 99 99 99 99 99 99
47 40 2 0 10.1 0 10.1 0 4A 0 15 0 15 17 20
48 81 2 0 999.0 9 0.0 0 4B 99 99 99 99 99 99
49 61 1 0 8.4 0 8.4 0 3B 0 4 0 10 0 8
50 62 2 0 7.7 0 7.7 0 3AB 0 11 0 16 23 0
51 34 1 0 15.1 1 24.4 1 3B 0 9 15 5 20 0
52 62 2 9 1.1 1 10.5 1 4A 8 99 0 99 0 0
53 63 2 9 999.0 9 22.2 1 4B 0 0 0 8 3 0
54 56 1 9 999.0 9 7.4 1 4B 0 99 0 6 0 0
55 66 2 9 999.0 9 1.3 1 4B 0 0· 0 22 0 0
56 62 1 0 11.1 0 20.5 1 4B 25 20 0 10 15 18
57 68 2 0 999.0 9 13.8 1 4B 20 99 0 17 15 15
58 45 1 0 999.0 9 6.3 1 4B 28 15 0 10 17 50
59 58 1 9 999.0 9 8.5 0 3B 10 17 0 25 30 25
60 55 1 9 999.0 9 5.8 0 4B 99 99 99 99 99 99
(Continued Overleaf )
55
Exercise Table 3.3 Continued
Family Remission Survival Skin TestsD
History of Time Remission Time Survival
Patient Age Gender Melanoma@ (months)A StatusB (months) StatusC Stage Monilia Mumps PPD PHA SK-SD Tricophyton
61 63 2 1 7.3 1 8.7 0 3B 0 9 0 23 12 15
62 53 1 9 36.4 0 36.4 0 3B 5 35 20 17 6 0
63 45 1 0 999.0 9 5.9 1 4B 0 0 0 0 0 0
64 41 1 0 999.0 9 1.7 1 4B 0 99 0 5 0 6
65 43 1 9 999.0 9 3.9 1 4B 25 0 0 7 20 5
66 80 1 0 5.8 0 11.0 1 4B 99 99 99 99 99 99
67 75 2 9 999.0 9 3.8 1 4B 0 99 0 6 0 0
68 47 2 9 999.0 1 15.9 0 3B 0 0 0 20 15 0
69 64 2 9 6.7 0 6.7 0 3AB 0 5 0 18 0 0
70 38 1 9 999.0 9 1.6 1 4B 99 99 99 99 99 99
71 27 1 0 6.0 0 6.0 0 3B 8 15 20 27 20 10
72 56 1 9 999.0 9 4.1 0 4B 0 0 0 0 0 0
73 60 2 9 999.0 9 2.8 0 3A 99 99 99 99 99 99
74 80 2 9 999.0 9 0.2 0 4B 0 20 99 40 0 20
75 38 1 9 999.0 9 7.0 0 4B 0 0 0 15 12 12
76 71 1 9 6.2 0 6.2 0 4A 99 99 99 99 99 99
77 57 2 0 6.1 0 6.1 0 4B 28 20 0 19 20 20
78 69 1 0 999.0 9 2.1 0 4B 15 15 15 10 0 0
79 17 2 9 4.9 0 4.9 0 3B 99 99 99 99 99 99
80 64 2 0 999.0 9 1.6 0 4B 99 99 99 99 99 99
81 91 1 0 6.5 0 8.3 1 4A 99 99 99 99 99 99
82 40 2 0 1.7 1 4.6 0 3B 99 99 99 99 99 99
56
83 63 1 0 7.3 0 28.0 1 3A 99 99 99 99 99 99
84 40 1 9 999.0 9 16.1 1 4B 99 99 99 99 99 99
85 53 1 9 999.0 9 4.5 1 4B 99 99 99 99 99 99
86 41 1 0 21.2 0 21.2 0 3A 99 99 99 99 99 99
87 27 1 9 999.0 9 4.0 1 4B 99 99 99 99 99 99
88 999 990999.0 9 7.8 1 4B 99 99 99 99 99 99
89 45 2 9 999.0 9 4.4 0 4B 99 99 99 99 99 99
90 50 2 9 999.0 9 4.2 1 4B 99 99 99 99 99 99
91 47 1 9 999.0 9 1.5 1 4B 99 99 99 99 99 99
92 63 1 9 999.0 9 3.5 0 4B 99 99 99 99 99 99
93 52 1 9 999.0 9 0.4 1 4B 99 99 99 99 99 99
94 53 1 9 999.0 9 2.5 1 4B 99 99 99 99 99 99
95 60 2 9 999.0 9 1.1 0 4B 99 99 99 99 99 99
96 35 1 9 999.0 9 11.1 1 4B 99 99 99 99 99 99
97 24 2 9 1.2 0 1.2 0 3B 99 99 99 99 99 99
98 80 2 0 999.0 9 1.9 0 3A 99 99 99 99 99 99
99 999 99 0 4.6 1 6.7 0 3B 99 99 99 99 99 99
100 60 2 9 0.9 0 0.9 0 3AB 99 99 99 99 99 99
101 60 2 9 999.0 9 4.3 0 4B 99 99 99 99 99 99
102 35 1 0 5.2 0 5.2 0 3B 99 99 99 99 99 99
Source: Lee et al. (1979)
? 1,male;2,female;99, unknown.
@ 1, yes; 0, No; 9, unknown.
A 999; never in remission during study period.
B 1, relapsed; 0, still in remission; 9, never in remission during study period.
C 1, dead; 0, still alive.
D In millimeters; 99, unknown.
57
Exercise Table 3.4 Data of 149 Diabetic Patients
Variable at Baseline
Survival Age at
Time Age Diagnosis Smoking SBP DBP
Patient Status? (yr)(yr) BMI (yr) Status@ (mmHg)(mmHg) ECGA CHDB
1 1 12.4 44 34.2 41 0 132 96 1 0
2 1 12.4 49 32.6 48 2 130 72 1 0
3 1 9.6 49 22.0 35 2 108 58 1 1
4 1 7.2 47 37.9 45 0 128 76 2 1
5 1 14.1 43 42.2 42 2 142 80 1 0
6 1 14.1 47 33.1 44 0 156 94 1 0
7 1 12.4 50 36.5 48 0 140 86 2 1
8 1 14.2 36 38.5 33 2 144 88 1 0
9 1 12.4 50 41.5 47 1 134 78 1 1
10 1 14.5 49 34.1 45 0 102 68 1 0
11 1 12.4 50 39.5 48 2 142 84 1 0
12 1 10.8 54 42.9 43 0 128 74 1 0
13 0 10.9 42 29.8 36 2 156 86 1 0
14 1 10.3 44 33.2 43 2 102 58 1 0
15 0 13.6 40 27.5 26 2 146 98 1 0
16 1 11.9 48 25.3 48 0 120 68 2 1
17 1 12.5 50 31.6 44 1 142 76 1 0
18 1 5.9 47 26.3 38 1 144 82 1 0
19 1 12.4 38 32.4 36 2 150 98 2 1
20 1 14.1 35 47.0 33 1 134 78 1 0
21 0 9.8 51 26.5 47 2 130 76 1 0
22 1 7.2 40 43.9 34 0 122 92 1 0
58
23 1 3.5 54 32.3 52 1 132 80 1 0
24 1 0.0 53 34.5 47 2 150 88 3 1
25 0 12.1 45 18.9 40 1 134 98 1 0
26 1 1.9 41 32.0 31 1 142 90 2 1
27 1 8.6 34 33.9 30 2 124 66 1 0
28 1 14.0 38 23.7 28 0 102 60 1 0
29 1 14.3 43 24.8 43 0 134 80 1 0
30 1 12.4 45 26.6 41 2 118 66 2 1
31 1 12.4 40 39.2 35 2 192 108 1 0
32 1 14.4 44 32.7 36 2 122 78 1 0
33 1 14.2 48 33.5 43 1 122 92 1 0
34 1 14.5 51 32.2 49 2 112 74 1 0
35 1 12.4 36 24.2 30 2 142 90 1 0
36 1 14.3 52 31.6 48 1 152 96 1 0
37 0 13.7 41 30.7 39 2 112 74 1 0
38 1 13.4 49 28.0 35 2 118 84 1 0
39 1 12.5 44 32.0 29 0 152 88 1 0
40 1 14.4 37 32.7 36 2 136 88 1 0
41 1 12.6 51 24.2 42 2 134 90 1 0
42 1 13.8 47 18.7 42 0 130 78 2 1
43 1 14.0 45 25.6 36 0 108 72 1 0
44 1 6.8 38 22.8 27 2 126 66 2 1
45 1 12.4 35 30.1 33 0 132 78 1 0
46 1 12.9 50 27.7 49 1 144 88 1 0
47 1 8.9 53 27.6 49 2 126 68 1 0
48 1 12.4 48 28.1 47 1 128 70 1 0
49 1 14.5 40 31.7 37 2 132 82 1 0
50 1 13.0 43 26.1 42 2 128 80 1 0
51 1 13.4 54 30.8 54 1 142 80 2 1
52 1 10.6 52 36.9 50 1 132 80 2 1
53 1 13.9 69 24.2 63 1 148 78 1 0
(Continued overleaf )
59
Exercise Table 3.4 Continued
Variable at Baseline
Survival Age at
Time Age Diagnosis Smoking SBP DBP
Patient Status? (yr)(yr) BMI (yr) Status@ (mmHg)(mmHg) ECGA CHDB
54 1 16.9 38 27.5 26 2 170 100 1 0
55 1 3.6 50 27.3 44 1 140 90 1 0
56 1 10.2 64 30.1 58 0 138 76 2 1
57 1 15.7 44 36.1 41 0 112 78 1 0
58 1 12.0 38 43.1 39 2 140 78 1 0
59 0 6.7 62 34.6 58 0 138 78 3 1
60 1 11.6 47 39.0 45 0 130 82 1 0
61 0 2.0 78 28.7 77 0 178 86 2 1
62 1 10.2 49 28.2 43 2 158 80 1 0
63 1 3.6 63 25.1 46 1 168 88 3 1
64 1 15.4 71 26.0 59 0 146 88 1 0
65 1 11.3 51 32.0 49 2 128 76 1 0
66 1 10.3 59 28.1 57 1 132 76 1 1
67 1 5.8 50 26.1 49 1 154 80 1 0
68 0 8.0 66 45.3 49 0 154 92 1 0
69 1 14.6 42 30.0 41 1 122 80 1 0
70 1 11.4 40 35.7 36 2 144 76 2 1
71 1 7.2 67 28.1 61 0 178 96 1 0
72 1 5.5 86 32.9 61 0 162 60 1 0
73 1 11.1 52 37.6 46 1 142 80 1 0
74 1 16.5 42 43.4 37 0 120 76 1 0
75 1 10.9 60 25.4 60 0 124 64 1 0
76 1 2.5 75 49.7 57 1 174 82 2 1
60
77 0 10.8 81 35.2 81 0 142 88 1 0
78 1 4.7 60 37.3 39 0 160 78 1 0
79 0 5.5 60 26.0 42 0 122 68 3 1
80 1 4.5 63 21.8 60 2 162 98 1 1
81 1 9.0 62 18.2 43 0 132 72 2 1
82 1 6.8 57 34.1 41 2 116 60 3 1
83 0 3.6 71 25.6 54 1 152 84 3 1
84 1 12.1 58 35.1 45 0 144 68 2 1
85 1 8.1 42 32.5 28 1 98 68 3 1
86 1 11.1 45 44.1 40 0 138 76 1 1
87 0 7.0 66 29.7 59 1 138 78 1 0
88 1 1.5 61 29.2 54 0 184 80 2 1
89 1 11.7 48 25.2 30 2 158 98 1 0
90 1 0.3 82 25.3 50 0 176 96 1 1
91 1 13.6 35 25.8 34 1 118 72 1 0
92 1 15.0 57 33.7 57 2 172 98 1 0
93 1 11.2 56 39.5 55 1 182 100 1 1
94 1 3.0 49 32.9 48 0 144 90 2 1
95 1 13.7 50 37.1 50 0 142 80 1 0
96 1 10.2 53 35.3 53 2 154 76 1 0
97 1 12.4 71 29.3 70 0 122 60 1 0
98 1 1.1 55 22.1 33 2 222 102 2 1
99 1 16.3 69 23.6 43 0 150 80 1 1
100 1 6.7 59 26.1 55 2 142 66 1 0
101 1 15.4 47 32.5 45 2 128 82 1 0
102 0 7.6 75 29.8 67 0 122 76 3 1
103 0 3.6 80 24.4 80 1 162 88 2 1
104 1 11.5 57 26.3 54 0 172 82 2 1
105 1 13.5 52 30.8 46 2 132 70 1 1
106 1 10.6 48 29.4 46 0 112 68 1 0
(Continued overleaf )
61
Exercise Table 3.4 Continued
Variable at Baseline
Survival Age at
Time Age Diagnosis Smoking SBP DBP
Patient Status? (yr)(yr) BMI (yr) Status@ (mmHg)(mmHg) ECGA CHDB
107 0 6.5 57 29.1 47 1 138 92 2 1
108 0 14.3 58 30.1 56 0 128 74 1 0
109 1 11.6 51 31.0 37 2 132 78 1 1
110 1 15.4 33 34.0 33 2 120 78 1 0
111 1 11.0 36 38.1 33 1 122 70 1 0
112 0 11.0 52 37.0 46 0 140 98 1 0
113 0 4.8 64 31.2 57 2 172 88 3 1
114 1 14.8 31 38.8 29 1 136 76 1 0
115 1 1.8 69 22.3 56 0 152 74 3 1
116 1 15.8 59 25.0 58 0 126 80 1 0
117 1 14.1 38 31.3 38 2 104 58 1 0
118 1 4.6 49 59.7 49 1 142 82 1 0
119 1 15.5 49 34.0 41 0 128 76 1 0
120 0 7.2 68 29.4 66 1 122 58 3 1
121 1 14.5 40 43.2 41 1 122 70 1 0
122 1 10.5 36 35.1 32 2 122 68 1 0
123 1 14.3 60 37.0 54 0 122 70 1 0
124 0 2.2 74 27.1 54 1 168 84 2 1
125 1 5.0 61 27.6 51 0 162 82 1 0
126 1 12.4 54 25.2 51 0 116 76 1 0
62
127 1 1.1 35 25.8 34 2 126 82 1 0
128 1 15.4 46 32.2 42 2 180 98 1 0
129 1 14.3 40 41.6 41 2 132 98 1 0
130 1 15.6 53 39.8 52 0 150 88 1 0
131 0 12.5 66 26.6 54 1 106 70 1 1
132 1 12.3 61 33.3 55 0 154 88 1 0
133 1 14.8 41 27.7 38 1 122 76 1 0
134 1 10.2 64 26.6 51 2 130 68 1 0
135 1 12.3 41 25.0 38 2 120 58 1 0
136 1 10.3 46 54.3 45 1 144 86 1 0
137 1 8.5 80 29.4 79 1 134 60 1 1
138 1 10.2 63 33.1 60 1 148 80 2 1
139 0 10.0 72 27.3 68 1 170 78 3 1
140 1 7.3 41 36.9 33 0 160 92 2 1
141 0 15.3 52 40.2 36 0 154 96 1 0
142 1 14.0 53 32.7 48 2 124 76 2 1
143 1 15.8 61 33.2 57 1 130 70 1 0
144 1 11.4 53 41.4 47 1 156 78 1 0
145 0 5.5 75 35.8 66 0 162 78 1 0
146 1 11.0 40 34.0 38 2 132 76 1 0
147 1 7.3 61 19.9 37 0 120 60 2 1
148 0 10.6 62 30.6 49 0 160 86 2 1
149 1 10.5 49 30.8 47 1 146 86 1 0
? Status: 0, dead; 1, alive.
@ 0, no; ex-smoker; 2, current.
A 1, normal; 2, borderline; 3, abnormal.
B 0, no; 1, yes.
63
CHAPTER 4
Nonparametric Methods of
Estimating Survival Functions
In this chapter we discuss methods of estimating the three survival (survivor-
ship, density, and hazard) functions for censored data. Unfortunately, the
simple method of Example 2.1 cannot be applied if some of the patients are
alive at the time of analysis and therefore their exact survival times are
unknown. Nonparametric or distribution-free methods are quite easy to
understand and apply. They are less efficient than parametric methods when
survival times follow a theoretical distribution and more efficient when no
suitable theoretical distributions are known. Therefore, we suggest using
nonparametric methods to analyze survival data before attempting to fit a
theoretical distribution. If the main objective is to find a model for the data,
estimates obtained by nonparametric methods and graphs can be helpful in
choosing a distribution.
Of the three survival functions, survivorship or its graphical presentation,
the survival curve, is the most widely used. Section 4.1 introduces the
product-limit (PL) method of estimating the survivorship function developed
by Kaplan and Meier (1958). With the increased availability of computers, this
method is applicable to small, moderate, and large samples. However, if the
data have already been grouped into intervals, or the sample size is very large,
say in the thousands, or the interest is in a large population, it may be more
convenient to perform a life-table analysis. Section 4.2 is devoted to the
discussion of population and clinical life tables. The PL estimates and life-table
estimates of the survivorship function are essentially the same. Many authors
use the term life-table estimates for the PL estimates. The only difference is that
the PL estimate is based on individual survival times, whereas in the life-table
method, survival times are grouped into intervals. The PL estimate can be
considered as a special case of the life-table estimate where each interval
contains only one observation.
64
In Section 4.3 we discuss three other measures that describe the survival
experience: the relative survival rate, the five-year survival rate, and the
corrected survival rate. In Section 4.4 we describe two methods, direct and
indirect standardization, to adjust rates to eliminate the effect of differences in
population composition with respect to age and other variables. In addition, it
introduces the standardized mortality rate and standardized incidence rate.
4.1 PRODUCT-LIMIT ESTIMATES OF SURVIVORSHIP FUNCTION
Let us first consider the simple case where all the patients are observed to death
so that the survival times are exact and known. Let t
, t
, , t
L
be the exact
survival times of the n individuals under study. Conceptually, we consider this
group of patients as a random sample from a much larger population of similar
patients. We relabel the n survival times t
, t
, , t
L
in ascending order such
that t
- t
- ···- t
L
. Following (2.1.2) and (2.1.3), the survivorship func-
tion at t
G
can be estimated as
S (t
G
) :
n 9 i
n
: 1 9
i
n
(4.1.1)
where n 9 i is the number of people in the sample surviving longer than t
G
. If
two or more t
G
are equal (tied observations), the largest i value is used. For
example, if t
: t
: t
, then
S (t
) : S (t
) : S (t
) :
n 9 4
n
This gives a conservative estimate for the tied observations.
Since every person is alive at the beginning of the study and no one survives
longer than t
L
,
S (t
) : 1 and S (t
L
) : 0(4.1.2)
In practice, S (t) is computed at every distinct survival time. We do not have to
worry about the intervals between the distinct survival times in which no one
dies and S (t) remains constant. Equations (4.1.1) and (4.1.2) show that S (t)is
a step function starting at 1.0 and decreasing in steps of 1/n (if there are no
ties) to zero. When S (t) is plotted versus t, the various percentiles of survival
time can be read from the graph or calculated from S (t). The following example
illustrates the method.
Example 4.1 Consider a clinical trial in which 10 lung cancer patients are
followed to death. Table 4.1 lists the survival times t in months. The function
- 65