rfid handbook fundamentals and applications in contactless smart cards and identification second edition phần 3 docx
Bạn đang xem bản rút gọn của tài liệu. Xem và tải ngay bản đầy đủ của tài liệu tại đây (2.74 MB, 52 trang )
(no resonance step-up)
(4.52)
('short-circuited' transponder coil).
Load resistance R
L
The load resistance R
L
is an expression for the power consumption of the data carrier
(microchip) in the transponder. Unfortunately, the load resistance is generally not
constant, but falls as the coupling coefficient increases due to the influence of the
shunt regulator (voltage regulator). The power consumption of the data carrier also
varies, for example during the read or write operation. Furthermore, the value of the
load resistance is often intentionally altered in order to transmit data to the reader (see
Section 4.1.10.3).
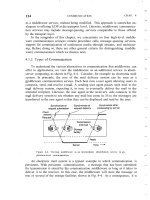
Figure 4.35 shows the corresponding locus curve for = f(R
L
). This shows that the
transformed transponder impedance is proportional to R
L
. Increasing load resistance
R
L
, which corresponds with a lower(!) current in the data carrier, thus also leads to a
greater value for the transformed transponder impedance . This can be
explained by the influence of the load resistance R
L
on the Q factor: a high-ohmic load
resistance R
L
leads to a high Q factor in the resonant circuit and thus to a greater
current step-up in the transponder resonant circuit. Due to the proportionality ~
jωM · i
2
— and not to i
RL
— we obtain a correspondingly high value for the
transformed transponder impedance.
Figure 4.35: Locus curve of (R
L
= 0.3–3 kO) in the impedance plane as
This document was created by an unregistered ChmMagic, please go to to register it. Thanks.
a function of the load resistance R
L
in the transponder at different
transponder resonant frequencies
If the transponder resonant frequency is detuned we obtain a curved locus curve for
the transformed transponder impedance . This can also be traced back to the
influence of the Q factor, because the phase angle of a detuned parallel resonant
circuit also increases as the Q factor increases (R
L
↑), as we can see from a glance at
Figure 4.34.
Let us reconsider the two extreme values of R
L
:
(4.53)
('short-circuited' transponder coil)
(4.54)
(unloaded transponder resonant circuit).
Transponder inductance L
2
Let us now investigate the influence of inductance L
2
on the transformed transponder
impedance, whereby the resonant frequency of the transponder is again held
constant, so that C
2
= 1/L
2
.
Transformed transponder impedance reaches a clear peak at a given inductance
value, as a glance at the line diagram shows (Figure 4.36). This behaviour is
reminiscent of the graph of voltage u
2
= f(L
2
) (see also Figure 4.15). Here too the peak
transformed transponder impedance occurs where the Q factor, and thus the current
i
2
in the transponder, is at a maximum ( ~ jωM · i
2
). Please refer to Section 4.1.7
for an explanation of the mathematical relationship between load resistance and the Q
factor.
This document was created by an unregistered ChmMagic, please go to to register it. Thanks.
Figure 4.36: The value of as a function of the transponder inductance L
2
at a constant resonant frequency f
RES
of the transponder. The maximum
value of coincides with the maximum value of the Q factor in the
transponder
4.1.10.3 Load modulation
Apart from a few other methods (see Chapter 3), so-called load modulation is the most
common procedure for data transmission from transponder to reader by some margin.
By varying the circuit parameters of the transponder resonant circuit in time with the
data stream, the magnitude and phase of the transformed transponder impedance can
be influenced (modulation) such that the data from the transponder can be
reconstructed by an appropriate evaluation procedure in the reader (demodulation).
However, of all the circuit parameters in the transponder resonant circuit, only two can
be altered by the data carrier: the load resistance R
L
and the parallel capacitance C
2
.
Therefore RFID literature distinguishes between ohmic (or real) and capacitive load
modulation.
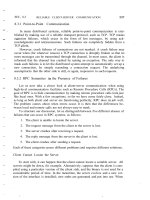
Ohmic load modulation
In this type of load modulation a parallel resistor R
mod
is switched on and off within the
data carrier of the transponder in time with the data stream (or in time with a
modulated subcarrier) (Figure 4.37). We already know from the previous section that
the parallel connection of R
mod
(→ reduced total resistance) will reduce the Q factor
and thus also the transformed transponder impedance . This is also evident from
the locus curve for the ohmic load modulator: is switched between the values
(R
L
) and (R
L
||R
mod
) by the load modulator in the transponder (Figure
4.38). The phase of remains almost constant during this process (assuming f
TX
= f
RES
)
This document was created by an unregistered ChmMagic, please go to to register it. Thanks.
Figure 4.37: Equivalent circuit diagram for a transponder with load modulator.
Switch S is closed in time with the data stream — or a modulated subcarrier
signal — for the transmission of data
Figure 4.38: Locus curve of the transformed transponder impedance with
ohmic load modulation (R
L
||R
mod
= 1.5-5kO) of an inductively coupled
transponder. The parallel connection of the modulation resistor R
mod
results
in a lower value of
In order to be able to reconstruct (i.e. demodulate) the transmitted data, the falling
voltage u
ZT
at must be sent to the receiver (RX) of the reader. Unfortunately,
is not accessible in the reader as a discrete component because the voltage u
ZT
is induced in the real antenna coil L
1
. However, the voltages u
L1
and u
R1
also occur at
the antenna coil L
1
, and they can only be measured at the terminals of the antenna
coil as the total voltage u
RX
. This total voltage is available to the receiver branch of the
reader (see also Figure 4.25).
The vector diagram in Figure 4.39 shows the magnitude and phase of the voltage
components u
ZT
, u
L1
and u
R1
which make up the total voltage u
RX
. The magnitude and
phase of u
RX
is varied by the modulation of the voltage component u
ZT
by the load
modulator in the transponder. Load modulation in the transponder thus brings about
the amplitude modulation of the reader antenna voltage u
RX
. The transmitted data is
therefore not available in the baseband at L
1
; instead it is found in the modulation
products (= modulation sidebands) of the (load) modulated voltage u
1
(see Chapter
6).
This document was created by an unregistered ChmMagic, please go to to register it. Thanks.
Figure 4.39: Vector diagram for the total voltage u
RX
that is available to the
receiver of a reader. The magnitude and phase of u
RX
are modulated at the
antenna coil of the reader (L
1
) by an ohmic load modulator
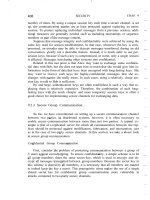
Capacitive load modulation
In capacitive load modulation it is an additional capacitor C
mod
, rather than a
modulation resistance, that is switched on and off in time with the data stream (or in
time with a modulated subcarrier) (Figure 4.40). This causes the resonant frequency
of the transponder to be switched between two frequencies.
Figure 4.40: Equivalent circuit diagram for a transponder with capacitive load
modulator. To transmit data the switch S is closed in time with the data
stream — or a modulated subcarrier signal
We know from the previous section that the detuning of the transponder resonant
frequency markedly influences the magnitude and phase of the transformed
transponder impedance . This is also clearly visible from the locus curve for the
capacitive load modulator (Figure 4.41): is switched between the values
(ω
RES1
) and (ω
RES2
) by the load modulator in the transponder. The locus curve
This document was created by an unregistered ChmMagic, please go to to register it. Thanks.
for thereby passes through a segment of the circle in the complex Z plane that
is typical of the parallel resonant circuit.
Figure 4.41: Locus curve of transformed transponder impedance for the
capacitive load modulation (C
2
||C
mod
= 40–60 pF) of an inductively coupled
transponder. The parallel connection of a modulation capacitor C
mod
results
in a modulation of the magnitude and phase of the transformed transponder
impedance
Demodulation of the data signal is similar to the procedure used with ohmic load
modulation. Capacitive load modulation generates a combination of amplitude and
phase modulation of the reader antenna voltage u
RX
and should therefore be
processed in an appropriate manner in the receiver branch of the reader. The relevant
vector diagram is shown in Figure 4.42.
This document was created by an unregistered ChmMagic, please go to to register it. Thanks.
Figure 4.42: Vector diagram of the total voltage u
RX
available to the receiver of
the reader. The magnitude and phase of this voltage are modulated at the
antenna coil of the reader (L
1
) by a capacitive load modulator
Demodulation in the reader
For transponders in the frequency range <135 kHz the load modulator is generally
controlled directly by a serial data stream encoded in the baseband, e.g. a
Manchester encoded bit sequence. The modulation signal from the transponder can
be recreated by the rectification of the amplitude modulated voltage at the antenna
coil of the reader (see Section 11.3).
In higher frequency systems operating at 6.78 MHz or 13.56 MHz, on the other hand,
the transponder's load modulator is controlled by a modulated subcarrier signal (see
Section 6.2.4). The subcarrier frequency f
H
is normally 847 kHz (ISO 14443-2), 423
kHz (ISO 15693) or 212 kHz.
Load modulation with a subcarrier generates two sidebands at a distance of ± f
H
to
either side of the transmission frequency (see Section 6.2.4). The information to be
transmitted is held in the two sidebands, with each sideband containing the same
information. One of the two sidebands is filtered in the reader and finally demodulated
to reclaim the baseband signal of the modulated data stream.
The influence of the Q factor
As we know from the preceding section, we attempt to maximise the Q factor in order
to maximise the energy range and the retroactive transformed transponder
impedance. From the point of view of the energy range, a high Q factor in the
transponder resonant circuit is definitely desirable. If we want to transmit data from or
to the transponder a certain minimum bandwidth of the transmission path from the
data carrier in the transponder to the receiver in the reader will be required. However,
the bandwidth B of the transponder resonant circuit is inversely proportional to the Q
factor.
This document was created by an unregistered ChmMagic, please go to to register it. Thanks.
(4.55)
Each load modulation operation in the transponder causes a corresponding amplitude
modulation of the current i
2
in the transponder coil. The modulation sidebands of the
current i
2
that this generates are damped to some degree by the bandwidth of the
transponder resonant circuit, which is limited in practice. The bandwidth B determines
a frequency range around the resonant frequency f
RES
, at the limits of which the
modulation sidebands of the current i
2
in the transponder reach a damping of 3 dB
relative to the resonant frequency (Figure 4.43). If the Q factor of the transponder is
too high, then the modulation sidebands of the current i
2
are damped to such a
degree due to the low bandwidth that the range is reduced (transponder signal range).
Figure 4.43: The transformed transponder impedance reaches a peak at the
resonant frequency of the transponder. The amplitude of the modulation
sidebands of the current i
2
is damped due to the influence of the bandwidth B
of the transponder resonant circuit (where f
H
= 440 kHz, Q = 30)
Transponders used in 13.56 MHz systems that support an anticollision algorithm are
adjusted to a resonant frequency of 15 -18 MHz to minimise the mutual influence of
several transponders. Due to the marked detuning of the transponder resonant
frequency relative to the transmission frequency of the reader the two modulation
sidebands of a load modulation system with subcarrier are transmitted at a different
level (see Figure 4.44).
This document was created by an unregistered ChmMagic, please go to to register it. Thanks.
Figure 4.44: If the transponder resonant frequency is markedly detuned
compared to the transmission frequency of the reader the two modulation
sidebands will be transmitted at different levels. (Example based upon
subcarrier frequency f
H
= 847 kHz)
The term bandwidth is problematic here (the frequencies of the reader and the
modulation sidebands may even lie outside the bandwidth of the transponder resonant
circuit). However, the selection of the correct Q factor for the transponder resonant
circuit is still important, because the Q factor can influence the transient effects during
load modulation.
Ideally, the 'mean Q factor' of the transponder will be selected such that the energy
range and transponder signal range of the system are identical. However, the
calculation of an ideal Q factor is non-trivial and should not be underestimated
because the Q factor is also strongly influenced by the shunt regulator (in connection
with the distance d between transponder and reader antenna) and by the load
modulator itself. Furthermore, the influence of the bandwidth of the transmitter
antenna (series resonant circuit) on the level of the load modulation sidebands should
not be underestimated.
Therefore, the development of an inductively coupled RFID system is always a
compromise between the system's range and its data transmission speed (baud
rate/subcarrier frequency). Systems that require a short transaction time (that is,
rapid data transmission and large bandwidth) often only have a range of a few
centimetres, whereas systems with relatively long transaction times (that is, slow data
transmission and low bandwidth) can be designed to achieve a greater range. A good
example of the former case is provided by contactless smart cards for local public
transport applications, which carry out authentication with the reader within a few 100
ms and must also transmit booking data. Contactless smart cards for 'hands free'
access systems that transmit just a few bytes — usually the serial number of the data
carrier — within 1 – 2 seconds are an example of the latter case. A further
consideration is that in systems with a 'large' transmission antenna the data rate of the
reader is restricted by the fact that only small sidebands may be generated because of
the need to comply with the radio licensing regulations (ETS, FCC). Table 4.4 gives a
brief overview of the relationship between range and bandwidth in inductively coupled
RFID systems.
This document was created by an unregistered ChmMagic, please go to to register it. Thanks.
Table 4.4: Typical relationship between range and bandwidth in 13.56 MHz systems.
An increasing Q factor in the transponder permits a greater range in the
transponder system. However, this is at the expense of the bandwidth and thus also
the data transmission speed (baud rate) between transponder and reader
SystemBaud ratef
Subcarrier
f
TX
Range
ISO 14443106 kBd847kHz13.56
MHz
0–10
cm
ISO 15693 short26.48 kBd484kHz13.56
MHz
0–30
cm
ISO 15693 long6.62 kBd484kHz13.56
MHz
0–70
cm
Long-range
system
9.0 kBd212kHz13.56
MHz
0–1 m
LF system-0-10kBdNo
subcarrier
<125 kHz0-1.5m
4.1.11 Measurement of system parameters
4.1.11.1 Measuring the coupling coefficient k
The coupling coefficient k and the associated mutual inductance M are the most
important parameters for the design of an inductively coupled RFID system. It is
precisely these parameters that are most difficult to determine analytically as a result
of the — often complicated — field pattern. Mathematics may be fun, but has its limits.
Furthermore, the software necessary to calculate a numeric simulation is often
unavailable — or it may simply be that the time or patience is lacking.
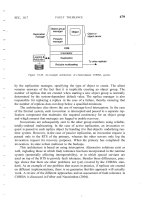
However, the coupling coefficient k for an existing system can be quickly determined
by means of a simple measurement. This requires a test transponder coil with
electrical and mechanical parameters that correspond with those of the 'real'
transponder. The coupling coefficient can be simply calculated from the measured
voltages U
R
at the reader coil and U
T
at the transponder coil (in Figure 4.45 these are
denoted as V
R
and V
T
):
(4.56)
This document was created by an unregistered ChmMagic, please go to to register it. Thanks.
Figure 4.45: Measurement circuit for the measurement of the magnetic
coupling coefficient k. N1— TL081 or LF 356N, R1— 100–500 O (reproduced
by permission of TEMIC Semiconductor GmbH, Heilbronn)
where U
T
is the voltage at the transponder coil, U
R
is the voltage at the reader coil, L
T
and L
R
are the inductance of the coils and A
K
is the correction factor (<1).
The parallel, parasitic capacitances of the measuring circuit and the test transponder
coil itself influence the result of the measurement because of the undesired current i
2
.
To compensate for this effect, equation (4.56) includes a correction factor A
K
. Where
C
TOT
= C
para
+ C
cable
+ C
probe
(see Figure 4.46) the correction factor is defined as:
(4.57)
Figure 4.46: Equivalent circuit diagram of the test transponder coil with the
parasitic capacitances of the measuring circuit
In practice, the correction factor in the low capacitance layout of the measuring circuit
is A
K
~ 0.99 - 0.8 (TEMIC, 1977).
4.1.11.2 Measuring the transponder resonant frequency
The precise measurement of the transponder resonant frequency so that deviations
from the desired value can be detected is particularly important in the manufacture of
inductively coupled transponders. However, since transponders are usually packed in
a glass or plastic housing, which renders them inaccessible, the measurement of the
resonant frequency can only be realised by means of an inductive coupling.
The measurement circuit for this is shown in Figure 4.47. A coupling coil (conductor
loop with several windings) is used to achieve the inductive coupling between
transponder and measuring device. The self-resonant frequency of this coupling coil
should be significantly higher (by a factor of at least 2) than the self-resonant
frequency of the transponder in order to minimise measuring errors.
This document was created by an unregistered ChmMagic, please go to to register it. Thanks.
Figure 4.47: The circuit for the measurement of the transponder resonant
frequency consists of a coupling coil L
1
and a measuring device that can
precisely measure the complex impedance of Z
1
over a certain frequency
range
A phase and impedance analyser (or a network analyser) is now used to measure the
impedance Z
1
of the coupling coil as a function of frequency. If Z
1
is represented in
the form of a line diagram it has a curved path, as shown in Figure 4.48. As the
measuring frequency rises the line diagram passes through various local maxima and
minima for the magnitude and phase of Z
1
. The sequence of the individual maxima
and minima is always the same.
Figure 4.48: The measurement of impedance and phase at the measuring coil
permits no conclusion to be drawn regarding the frequency of the transponder
In the event of mutual inductance with a transponder the impedance Z
1
of the
coupling coil L
1
is made up of several individual impedances:
(4.58)
Apart from at the transponder resonant frequency f
RES
, tends towards zero, so
Z
1
= R
L
+ jωL
1
. The locus curve in this range is a line parallel to the imaginary y axis
of the complex Z plane at a distance of R
1
from it. If the measuring frequency
approaches the transponder resonant frequency this straight line becomes a circle as
a result of the influence of . The locus curve for this is shown in Figure 4.49. The
transponder resonant frequency corresponds with the maximum value of the real
component of Z
1
(however this is not visible in the line diagram shown in Figure 4.48).
The appearance of the individual maxima and minima of the line diagram can also be
seen in the locus curve. A precise measurement of the transponder resonant
This document was created by an unregistered ChmMagic, please go to to register it. Thanks.
frequency is therefore only possible using measuring devices that permit a separate
measurement of R and X or can display a locus curve or line diagram.
Figure 4.49: The locus curve of impedance Z
1
in the frequency range 1–30
MHz
4.1.12 Magnetic materials
Materials with a relative permeability > 1 are termed ferromagnetic materials. These
materials are iron, cobalt, nickel, various alloys and ferrite.
4.1.12.1 Properties of magnetic materials and ferrite
One important characteristic of a magnetic material is the magnetisation characteristic
or hysteresis curve. This describes B = f (H), which displays a typical path for all
ferromagnetic materials.
Starting from the unmagnetized state of the ferromagnetic material, the virgin curve A
→ B is obtained as the magnetic field strength H increases. During this process, the
molecular magnets in the material align themselves in the B direction.
(Ferro-magnetism is based upon the presence of molecular magnetic dipoles. In
these, the electron circling the atomic core represents a current and generates a
magnetic field. In addition to the movement of the electron along its path, the rotation
of the electron around itself, the spin, also generates a magnetic moment, which is of
even greater importance for the material's magnetic behaviour.) Because there is a
finite number of these molecular magnets, the number that remain to be aligned falls
as the magnetic field increases, thus the gradient of the hysteresis curve falls. When
all molecular magnets have been aligned, B rises in proportion to H only to the same
degree as in a vacuum (Figure 4.50).
This document was created by an unregistered ChmMagic, please go to to register it. Thanks.
Figure 4.50: Typical magnetisation or hysteresis curve for a ferromagnetic
material
When the field strength H falls to H = 0, the flux density B falls to the positive residual
value B
R
, the remanence. Only after the application of an opposing field (-H) does the
flux density B fall further and finally return to zero. The field strength necessary for this
is termed the coercive field strength H
C
.
Ferrite is the main material used in high frequency technology. This is used in the form
of soft magnetic ceramic materials (low B
r
), composed mainly of mixed crystals or
compounds of iron oxide (Fe
2
O
3
) with one or more oxides of bivalent metals (NiO,
ZnO, MnO etc.) (Vogt. Elektronik, 1990). The manufacturing process is similar to that
for ceramic technologies (sintering).
The main characteristic of ferrite is its high specific electrical resistance, which varies
between 1 and 10
6
Om depending upon the material type, compared to the range for
metals, which vary between 10
-5
and 10
-4
Om. Because of this, eddy current losses
are low and can be disregarded over a wide frequency range.
The relative permeability of ferrites can reach the order of magnitude of µ
r
= 2000.
An important characteristic of ferrite materials is their material-dependent limit
frequency, which is listed in the datasheets provided by the ferrite manufacturer.
Above the limit frequency increased losses occur in the ferrite material, and therefore
ferrite should not be used outside the specified frequency range.
4.1.12.2 Ferrite antennas in LF transponders
Some applications require extremely small transponder coils (Figure 4.51). In
transponders for animal identification, typical dimensions for cylinder coils are d × l = 5
mm × 0.75 mm. The mutual inductance that is decisive for the power supply of the
transponder falls sharply due to its proportionality with the cross-sectional area of the
coil (M ~ A; equation (4.13)). By inserting a ferrite material with a high permeability µ
into the coil (M ~ Ψ → M ~ µ · H → A; equation (4.13)), the mutual inductance can be
significantly increased, thus compensating for the small cross-sectional area of the
coil.
Figure 4.51: Configuration of a ferrite antenna in a 135 kHz glass transponder
The inductance of a ferrite antenna can be calculated according to the following
equation (Philips Components, 1994):
This document was created by an unregistered ChmMagic, please go to to register it. Thanks.
(4.59)
4.1.12.3 Ferrite shielding in a metallic environment
The use of (inductively coupled) RFID systems often requires that the reader or
transponder antenna be mounted directly upon a metallic surface. This might be the
reader antenna of an automatic ticket dispenser or a transponder for mounting on gas
bottles (see Figure 4.52).
Figure 4.52: Reader antenna (left) and gas bottle transponder in a u-shaped
core with read head (right) can be mounted directly upon or within metal
surfaces using ferrite shielding
However, it is not possible to fit a magnetic antenna directly onto a metallic surface.
The magnetic flux through the metal surface induces eddy currents within the metal,
which oppose the field responsible for their creation, i.e. the reader's field (Lenz's law),
thus damping the magnetic field in the surface of the metal to such a degree that
communication between reader and transponder is no longer possible. It makes no
difference here whether the magnetic field is generated by the coil mounted upon the
metal surface (reader antenna) or the field approaches the metal surface from
'outside' (transponder on metal surface).
By inserting highly permeable ferrite between the coil and metal surface it is possible
to largely prevent the occurrence of eddy currents. This makes it possible to mount the
antenna on metal surfaces.
When fitting antennas onto ferrite surfaces it is necessary to take into account the fact
that the inductance of the conductor loop or coils may be significantly increased by
the permeability of the ferrite material, and it may therefore be necessary to readjust
the resonant frequency or even redimension the matching network (in readers)
altogether (see Section 11.4).
4.1.12.4 Fitting transponders in metal
Under certain circumstances it is possible to fit transponders directly into a metallic
environment (Figure 4.53). Glass transponders are used for this because they contain
a coil on a highly permeable ferrite rod. If such a transponder is inserted horizontally
into a long groove on the metal surface somewhat larger than the transponder itself,
then the transponder can be read without any problems. When the transponder is
fitted horizontally the field lines through the transponder's ferrite rod run in parallel to
the metal surface and therefore the eddy current losses remain low. The insertion of
the transponder into a vertical bore would be unsuccessful in this situation, since the
This document was created by an unregistered ChmMagic, please go to to register it. Thanks.
field lines through the transponder's ferrite rod in this arrangement would end at the
top of the bore at right angles to the metal surface. The eddy current losses that occur
in this case hinder the interrogation of a transponder.
Figure 4.53: Right, fitting a glass transponder into a metal surface; left, the use
of a thin dielectric gap allows the transponders to be read even through a
metal casing (Photo— HANEX HXID system with Sokymat glass transponder
in metal, reproduced by permission of HANEX Co. Ltd, Japan)
It is even possible to cover such an arrangement with a metal lid. However, a narrow
gap of dielectric material (e.g. paint, plastic, air) is required between the two metal
surfaces in order to interrogate the transponder. The field lines running parallel to the
metal surface enter the cavity through the dielectric gap (see Figure 4.54), so that the
transponder can be read. Fitting transponders in metal allows them to be used in
particularly hostile environments. They can even be run over by vehicles weighing
several tonnes without suffering any damage.
Figure 4.54: Path of field lines around a transponder encapsulated in metal.
This document was created by an unregistered ChmMagic, please go to to register it. Thanks.
As a result of the dielectric gap the field lines run in parallel to the metal
surface, so that eddy current losses are kept low (reproduced by permission
of HANEX Co. Ltd, Japan)
Disk tags and contactless smart cards can also be embedded between metal plates.
In order to prevent the magnetic field lines from penetrating into the metal cover, metal
foils made of a highly permeable amorphous metal are placed above and below the
tag (Hanex, n.d.). It is of crucial importance for the functionality of the system that the
amorphous foils each cover only one half of the tag.
The magnetic field lines enter the amorphous material in parallel to the surface of the
metal plates and are carried through it as in a conductor (Figure 4.55). At the gap
between the two part foils a magnetic flux is generated through the transponder coil,
so that this can be read.
[1]
However, in 13.56MHz systems with anticollision procedures, the resonant
frequency selected for the transponder is often 1–5 MHz higher to minimise the effect
of the interaction between transponders on overall performance. This is because the
overall resonant frequency of two transponders directly adjacent to one another is
always lower than the resonant frequency of a single transponder.
[2]
If the antenna current of the transmitter antenna is not known it can be calculated
from the measured field strength H(x) at a distance x, where the antenna radius R and
the number of windings N
1
are known (see Section 4.1.1.1).
[3]
This is in accordance with Lenz's law, which states that 'the induced voltage always
attempts to set up a current in the conductor circuit, the direction of which opposes
that of the voltage that induced it' (Paul, 1993).
[4]
The low angular deviation in the locus curve in Figure 4.32 where f
RES
= f
TX
is
therefore due to the fact that the resonant frequency calculated according to equation
(4.34) is only valid without limitations for the undamped parallel resonant circuit. Given
damping by R
L
and R
2
, on the other hand, there is a slight detuning of the resonant
frequency. However, this effect can be largely disregarded in practice and thus will not
be considered further here.
This document was created by an unregistered ChmMagic, please go to to register it. Thanks.
4.2 Electromagnetic Waves
4.2.1 The generation of electromagnetic waves
Earlier in the book we described how a time varying magnetic field in space induces
an electric field with closed field lines (rotational field) (see also Figure 4.11). The
electric field surrounds the magnetic field and itself varies over time. Due to the
variation of the electric rotational field over time, a magnetic field with closed field lines
occurs in space (rotational field). It surrounds the electric field and itself varies over
time, thus generating another electric field. Due to the mutual dependence of the time
varying fields there is a chain effect of electric and magnetic fields in space (Fricke et
al., 1979).
Figure 4.55: Cross-section through a sandwich made of disk transponder and
metal plates. Foils made of amorphous metal cause the magnetic field lines
to be directed outwards
Radiation can only occur given a finite propagation speed (c ≈ 300 000 km/s; speed of
light) for the electromagnetic field, which prevents a change in the voltage at the
antenna from being followed immediately by the field in the vicinity of the change.
Figure 4.56 shows the creation of an electromagnetic wave at a dipole antenna. Even
at the alternating voltage's zero crossover (Figure 4.56c), the field lines remaining in
space from the previous half wave cannot end at the antenna, but close into
themselves, forming eddies. The eddies in the opposite direction that occur in the next
half wave propel the existing eddies, and thus the energy stored in this field, away
from the emitter at the speed of light c. The magnetic field is interlinked with the
varying electrical field that propagates at the same time. When a certain distance is
reached, the fields are released from the emitter, and this point represents the
beginning of electromagnetic radiation (→ far field). At high frequencies, that is small
wavelengths, the radiation generated is particularly effective, because in this case the
separation takes place in the direct vicinity of the emitter, where high field strengths
still exist (Fricke et al., 1979).
This document was created by an unregistered ChmMagic, please go to to register it. Thanks.
Figure 4.56: The creation of an electromagnetic wave at a dipole antenna. The
electric field E is shown. The magnetic field H forms as a ring around the
antenna and thus lies at right angles to the electric field
The distance between two field eddies rotating in the same direction is called the
wavelength λ of the electromagnetic wave, and is calculated from the quotient of the
speed of light c and the frequency of the radiation:
(4.60)
4.2.1.1 Transition from near field to far field in conductor loops
The primary magnetic field generated by a conductor loop begins at the antenna (see
also Section 4.1.1.1). As the magnetic field propagates an electric field increasingly
also develops by induction (compare Figure 4.11). The field, which was originally
purely magnetic, is thus continuously transformed into an electromagnetic field.
Moreover, at a distance of λ/2π the electromagnetic field begins to separate from the
antenna and wanders into space in the form of an electromagnetic wave. The area
from the antenna to the point where the electromagnetic field forms is called the near
field of the antenna. The area after the point at which the electromagnetic wave has
fully formed and separated from the antenna is called the far field.
A separated electromagnetic wave can no longer retroact upon the antenna that
generated it by inductive or capacitive coupling. For inductively coupled RFID systems
this means that once the far field has begun a transformer (inductive) coupling is no
longer possible. The beginning of the far field (the radius r
F
= λ/2π can be used as a
rule of thumb) around the antenna thus represents an insurmountable range limit for
inductively coupled systems.
This document was created by an unregistered ChmMagic, please go to to register it. Thanks.
Table 4.5: Frequency and wavelengths of different VHF-UHF frequencies
FrequencyWavelength (cm)
433 MHz69 (70 cm band)
868 MHz34
915 MHz33
2.45 GHz12
5.8 GHz5.2
Table 4.6: r
F
and λ for different frequency ranges
Frequency
Wavelength λ (m)λ/2π (m)
< 135 kHz>2222>353
6.78 MHz44.77.1
13.56 MHz22.13.5
27.125 MHz11.01.7
The field strength path of a magnetic antenna along the coil x axis follows the
relationship 1/d
3
in the near field, as demonstrated above. This corresponds with a
damping of 60 dB per decade (of distance). Upon the transition to the far field, on the
other hand, the damping path flattens out, because after the separation of the field
from the antenna only the free space attenuation of the electromagnetic waves is
relevant to the field strength path (Figure 4.57). The field strength then decreases only
according to the relationship 1/d as distance increases (see equation (4.65)). This
corresponds with a damping of just 20 dB per decade (of distance).
Figure 4.57: Graph of the magnetic field strength H in the transition from near
to far field at a frequency of 13.56 MHz
4.2.2 Radiation density S
This document was created by an unregistered ChmMagic, please go to to register it. Thanks.
An electromagnetic wave propagates into space spherically from the point of its
creation. At the same time, the electromagnetic wave transports energy in the
surrounding space. As the distance from the radiation source increases, this energy
is divided over an increasing sphere surface area. In this connection we talk of the
radiation power per unit area, also called radiation density S.
In a spherical emitter, the so-called isotropic emitter, the energy is radiated uniformly
in all directions. At distance r the radiation density S can be calculated very easily as
the quotient of the energy supplied by the emitter (thus the transmission power P
EIRP
)
and the surface area of the sphere.
(4.61)
4.2.3 Characteristic wave impedance and field strength E
The energy transported by the electromagnetic wave is stored in the electric and
magnetic field of the wave. There is therefore a fixed relationship between the
radiation density S and the field strengths E and H of the interconnected electric and
magnetic fields. The electric field with electric field strength E is at right angles to the
magnetic field H. The area between the vectors E and H forms the wave front and is at
right angles to the direction of propagation. The radiation density S is found from the
Poynting radiation vector S as a vector product of E and H (Figure 4.58).
Figure 4.58: The Poynting radiation vector S as the vector product of E and H
(4.62)
The relationship between the field strengths E and H is defined by the permittivity and
the dielectric constant of the propagation medium of the electromagnetic wave. In a
vacuum and also in air as an approximation:
(4.63)
Z
F
is termed the characteristic wave impedance (Z
F
= 120π O = 377 O). Furthermore,
the following relationship holds:
(4.64)
Therefore, the field strength E at a certain distance r from the radiation source can be
calculated using equation (4.61). P
EIRP
is the transmission power emitted from the
isotropic emitter:
(4.65)
This document was created by an unregistered ChmMagic, please go to to register it. Thanks.
4.2.4 Polarisation of electromagnetic waves
The polarisation of an electromagnetic wave is determined by the direction of the
electric field of the wave. We differentiate between linear polarisation and circular
polarisation. In linear polarisation the direction of the field lines of the electric field E in
relation to the surface of the earth provide the distinction between horizontal (the
electric field lines run parallel to the surface of the earth) and vertical (the electric field
lines run at right angles to the surface of the earth) polarisation.
So, for example, the dipole antenna is a linear polarised antenna in which the electric
field lines run parallel to the dipole axis. A dipole antenna mounted at right angles to
the earth's surface thus generates a vertically polarised electromagnetic field.
The transmission of energy between two linear polarised antennas is optimal if the two
antennas have the same polarisation direction. Energy transmission is at its lowest
point, on the other hand, when the polarisation directions of transmission and
receiving antennas are arranged at exactly 90° or 270° in relation to one another (e.g.
a horizontal antenna and a vertical antenna). In this situation an additional damping of
20 dB has to be taken into account in the power transmission due to polarisation
losses (Rothammel, 1981), i.e. the receiving antenna draws just 1/100 of the
maximum possible power from the emitted electromagnetic field.
In RFID systems, there is generally no fixed relationship between the position of the
portable transponder antenna and the reader antenna. This can lead to fluctuations in
the read range that are both high and unpredictable. This problem is aided by the use
of circular polarisation in the reader antenna. The principle generation of circular
polarisation is shown in Figure 4.59: two dipoles are fitted in the form of a cross. One
of the two dipoles is fed via a 90° (λ/4) delay line. The polarisation direction of the
electromagnetic field generated in this manner rotates through 360° every time the
wave front moves forward by a wavelength. The rotation direction of the field can be
determined by the arrangement of the delay line. We differentiate between left-handed
and right-handed circular polarisation.
Figure 4.59: Definition of the polarisation of electromagnetic waves
A polarisation loss of 3 dB should be taken into account between a linear and a
circular polarised antenna; however, this is independent of the polarisation direction of
the receiving antenna (e.g. the transponder).
4.2.4.1 Reflection of electromagnetic waves
An electromagnetic wave emitted into the surrounding space by an antenna
encounters various objects. Part of the high frequency energy that reaches the object
is absorbed by the object and converted into heat; the rest is scattered in many
directions with varying intensity.
A small part of the reflected energy finds its way back to the transmitter antenna.
Radar technology uses this reflection to measure the distance and position of distant
objects (Figure 4.60).
This document was created by an unregistered ChmMagic, please go to to register it. Thanks.
Figure 4.60: Reflection off a distant object is also used in radar technology
In RFID systems the reflection of electromagnetic waves (backscatter system,
modulated radar cross-section) is used for the transmission of data from a
transponder to a reader. Because the reflective properties of objects generally
increase with increasing frequency, these systems are used mainly in the frequency
ranges of 868 MHz (Europe), 915 MHz (USA), 2.45 GHz and above.
Let us now consider the relationships in an RFID system. The antenna of a reader
emits an electromagnetic wave in all directions of space at the transmission power
P
EIRP
. The radiation density S that reaches the location of the transponder can easily
be calculated using equation (4.61). The transponder's antenna reflects a power P
S
that is proportional to the power density S and the so-called radar cross-section σ is:
(4.66)
The reflected electromagnetic wave also propagates into space spherically from the
point of reflection. Thus the radiation power of the reflected wave also decreases in
proportion to the square of the distance (r
2
) from the radiation source (i.e. the
reflection). The following power density finally returns to the reader's antenna:
(4.67)
The radar cross-section σ (RCS, scatter aperture) is a measure of how well an object
reflects electromagnetic waves. The radar cross-section depends upon a range of
parameters, such as object size, shape, material, surface structure, but also
wavelength and polarisation.
The radar cross-section can only be calculated precisely for simple surfaces such as
spheres, flat surfaces and the like (for example see Baur, 1985). The material also has
a significant influence. For example, metal surfaces reflect much better than plastic or
composite materials. Because the dependence of the radar cross-section σ on
wavelength plays such an important role, objects are divided into three categories:
Rayleigh range: the wavelength is large compared with the object
dimensions. For objects smaller than around half the wavelength, σ
exhibits a λ
-4
dependency and so the reflective properties of objects
smaller than 0.1 λ can be completely disregarded in practice.
Resonance range: the wavelength is comparable with the object
dimensions. Varying the wavelength causes σ to fluctuate by a few
decibels around the geometric value. Objects with sharp resonance,
such as sharp edges, slits and points may, at certain wavelengths,
exhibit resonance step-up of σ. Under certain circumstances this is
This document was created by an unregistered ChmMagic, please go to to register it. Thanks.
particularly true for antennas that are being irradiated at their
resonant wavelengths (resonant frequency).
Optical range: the wavelength is small compared to the object
dimensions. In this case, only the geometry and position (angle of
incidence of the electromagnetic wave) of the object influence the
radar cross-section.
Backscatter RFID systems employ antennas with different construction formats as
reflection areas. Reflections at transponders therefore occur exclusively in the
resonance range. In order to understand and make calculations about these systems
we need to know the radar cross-section σ of a resonant antenna. A detailed
introduction to the calculation of the radar cross-section can therefore be found in the
following sections.
It also follows from equation (4.67) that the power reflected back from the transponder
is proportional to the fourth root of the power transmitted by the reader (Figure 4.61).
In other words: if we wish to double the power density S of the reflected signal from
the transponder that arrives at the reader, then, all other things being equal, the
transmission power must be multiplied by sixteen!
Figure 4.61: Propagation of waves emitted and reflected at the transponder
4.2.5 Antennas
The creation of electromagnetic waves has already been described in detail in the
previous section (see also Sections 4.1.6 and 4.2.1). The laws of physics tell us that
the radiation of electromagnetic waves can be observed in all conductors that carry
voltage and/or current. In contrast to these effects, which tend to be parasitic, an
antenna is a component in which the radiation or reception of electromagnetic waves
has been to a large degree optimised for certain frequency ranges by the fine-tuning
of design properties. In this connection, the behaviour of an antenna can be precisely
predicted and is exactly defined mathematically.
4.2.5.1 Gain and directional effect
Section 4.2.2 demonstrated how the power P
EIRP
emitted from an isotropic emitter at a
distance r is distributed in a fully uniform manner over a spherical surface area. If we
integrate the power density S of the electromagnetic wave over the entire surface area
of the sphere the result we obtain is, once again, the power P
EIRP
emitted by the
isotropic emitter.
(4.68)
However, a real antenna, for example a dipole, does not radiate the supplied power
This document was created by an unregistered ChmMagic, please go to to register it. Thanks.
uniformly in all directions. For example, no power at all is radiated by a dipole antenna
in the axial direction in relation to the antenna.
Equation (4.68) applies for all types of antennas. If the antenna emits the supplied
power with varying intensity in different directions, then equation (4.68) can only be
fulfilled if the radiation density S is greater in the preferred direction of the antenna
than would be the case for an isotropic emitter. Figure 4.62 shows the radiation
pattern of a dipole antenna in comparison to that of an isotropic emitter. The length of
the vector G(Θ) indicates the relative radiation density in the direction of the vector. In
the main radiation direction (G
i
) the radiation density can be calculated as follows:
(4.69)
Figure 4.62: Radiation pattern of a dipole antenna in comparison to the
radiation pattern of an isotropic emitter
P
1
is the power supplied to the antenna. G
i
is termed the gain of the antenna and
indicates the factor by which the radiation density S is greater than that of an isotropic
emitter at the same transmission power.
An important radio technology term in this connection is the EIRP (effective isotropic
radiated power).
(4.70)
This figure can often be found in radio licensing regulations (e.g. Section 5.2.4) and
indicates the transmission power at which an isotropic emitter (i.e. G
i
= 1) would have
to be supplied in order to generate a defined radiation power at distance r. An antenna
with a gain G
i
may therefore only be supplied with a transmission power P
1
that is
lower by this factor so that the specified limit value is not exceeded:
(4.71)
4.2.5.2 EIRP and ERP
In addition to power figures in EIRP we frequently come across the power figure ERP
(equivalent radiated power) in radio regulations and technical literature. The ERP is
also a reference power figure. However, in contrast to the EIRP, ERP relates to a
This document was created by an unregistered ChmMagic, please go to to register it. Thanks.