Radio network planning and optimisation for umts 2nd edition phần 6 doc
Bạn đang xem bản rút gọn của tài liệu. Xem và tải ngay bản đầy đủ của tài liệu tại đây (13.72 MB, 66 trang )
antennas, MHAs and feeder networks to be installed. In many networks sites will also
be shared by at least two operators.
Co-siting
The term ‘co-locating’ shall be used when BSs are installed at the same site.
When sites are co-located and share feeders and antennas this shall be called ‘co-
siting’. Basically the same isolation requirements are still vali d as in co-located sites but
the means to achieve this could be different.
Different kinds of sharing situations may be distinguished, such as antenna and/or
feeder sharing, or there could even be multi-mode BSs that share the same cabinets, site
support equipment, transmission, feeders and antennas.
In the basic situation, there would be an existing BS with the required site support
equipment, feeders and antennas, and the operator installs a WCDMA BS on the same
site. If the existing system is GSM1800, the attenuation of the feeder would be of the
same order as in WCDMA, but in the case of GSM900 the attenuation of the feeder
should be checked and changed if needed. Single-mode antennas can be replaced by
multi-mode antennas. One example is shown in Figure 5.13.
Based upon the preceding discussion and the assumed NFs in Section 5.1.4, the
isolation between a WCDMA BS cab inet and a GSM900 BS cabinet should be at
least 40 dB whereas the isolation between a WCDMA BS cabinet and a GSM1800
BS cab inet should be at least 45 dB. If the receiver NF is greater than that assumed –
e.g., for an active distributed antenna system indoor solution – then the isolation
requirement can be reduced.
WCDMA–GSM Co-planning Issues 297
WCDMA
BS
GSM
BTS
Diplexer
Iub
Iub/Abis
To/From
RNC/BSC
Diplexer
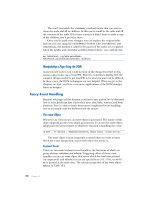
Figure 5.13 Example of site, feeder and antenna sharing.
The way in which this isolation requirement is achieved depends upon the detai led
site design. If a diplexer is being used to combine the WCDMA and GSM signals such
that they can share the same feeders then the diplexor provides the majority of the
isolation requirement. A diplexer typically offers 40 dB of isolation between the GSM
and W CDMA systems.
By changing the single-mode BS to dual- or triple-mode, the space required could be
smaller due to the single-site support package.
5.3.1.3 Antenna Configurations
Interference between other systems and the WCDMA band depends heavily on the
antenna configurations used for both systems. The main problem has been identified
with the GSM1800 band; all other systems pose little or no risk of blocking and/or
intermodulation with the WCDMA band. Therefore, only the GSM1800 case is further
investigated.
If antennas for both GSM and UMTS systems have to be mounted on a single
carrier pole, the usual 120
three-sector configuration with vertical stacking of GSM
and UMTS antennas seems to be a suitable solution, providing isolation values of
approximately 30 dB between sectors and systems.
If diversity reception is needed, the diversity branches of both systems can be handled
by a single physical antenna (assuming dual-band antennas). This is beneficial when the
diversity antenna is as far as possible from the (possibly interfering) GSM transmit
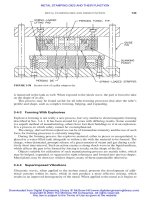
antenna. Such a triple-stack antenna requires tall poles and may not be feasible in many
locations (Figure 5.14).
On large flat roofs, isolation between antenna positions can be improved by setting
GSM and UMTS antennas physically apart, so that no direct Line-of-Sight (LOS)
connection between them exists. One way to do this is by lowering one set of
298 Radio Network Planning and Optimisation for UMTS
120 deg
front view top view
> 2m
> 2m
GSM TX/RX
UMTS TX/RX
GSM & UMTS
RX div.
Figure 5.14 Possible antenna configuration for dual-system GSM and UMTS site (with
diversity).
antennas down over the edge of the rooftop, if that position is available and suitable
from a radio propagation perspective.
5.3.1.4 Traffic and Service Distribution between Systems
Traffic between systems could be separated according to the type of service – e.g., voice
and low-speed data traffic could be directed mainly into the 2G network, whereas
higher speed data traffic can be directed into the WCDMA.
Traffic sharing between layers can be implemented so that the high-speed data traffic
is concentrated in pico- and micro-cells and the low-speed data and voice traffic in
macro-cells. This is reasonable, because in WCDMA the coverage is tightly bound to
the data speeds through processing gain, the higher data rate implying smaller coverage.
The services can be handed over as a function of the loading – e.g., speech services can
be handed over from WCDMA to 2G if loading is higher than 10 % – which in practice
directs speech services into the 2G network.
Subscribers could be classified into different groups that have different rights
depending on their subscription, and accordingly redirected to the relevant systems.
Subscribers with lower priority could be redirected to the 2G network, which has lower
maximum data rates for different services. Packet data users who might suffer from
excessive delays could be handed over to whichever network has the most extra capacity
available.
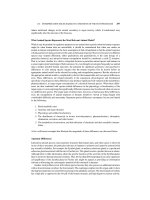
5.3.1.5 Coverage and Capacity
At the beginning of WCDMA deployment, coverage will not be continuous, but it
could be extended by selective handover to the 2G network. In areas where
WCDMA coverage is continuous, dual-mode or multi-mode mobiles could be set to
start their calls in the WCDMA network by proper setting of idle mode parameters. By
doing this, the loading between 2G and WCDMA networks can be balanced and in
some cases reduce the traffic in overloaded 2G networks: see Figure 5.15.
WCDMA–GSM Co-planning Issues 299
WCDMA
WCDMA
WCDMA
WCDMA
WCDMA
WCDMA
GSM
GSM
GSM
GSM
GSM
GSM
GSM
GSM
GSM
GSM
GSM
GSM
Handover WCDMA → GSM
for coverage extension
Handover GSM → WCDMA
for capacity extension or
service optimization
Urban area Rural area
Handover GSM !WCDMA
for capacity extension or
service optimisation
Figure 5.15 Schematic view of handovers between GSM and WCDMA networks for load and
coverage reasons.
Such handover for coverage reasons should be initiated sufficiently early, because
during compressed mode measurements higher power is needed if spreading factor
splitting is used. If the mobile is located at the cell edge and is already transmitting
with full power, it cannot increase its transmit power further and the connection might
be lost if handover is not started early enough. To avoid this kind of problem, handover
statistics can be used to determine the sites where inter-system handovers happen most
frequently and trigger compressed mode measurements early enough.
Instead of switching to compressed mode, blind handover ca n be performed if both
systems are located at the same site, since path loss remains the same. Blind handover is
especially useful for Non-Real Time (NRT) users, as synchronisation for Real Time
(RT) users might take too long, leading to deterioration of connection quality below
acceptable limits.
Load sharing between 2G and WCDMA networks can be exploited to make full use
of their capacity and to achieve some trunking gain, as their resources are in the same
pool (see Table 5.7). It is seen that the trunking gain increases as the used data rate
increases.
Load sharing operation is closely related to how traffic and services are distributed
between systems. Speech users can be kept in the 2G network as long as the loading of
that network is below the pre-defined threshold, whereas high-speed data users can
always be handed ov er to the 3G network if it is available. The order of the mobiles
that are handed over to the other radio system can be determined according to their
service, transmit power and type of connection.
5.3.1.6 Joint Optimisation
Resources in 2G and WCDMA networks can be fully utilised if their management and
deployment can be jointly optimised. In order to effe ct successful joint optimisation,
there should be a means of gathering performance data from the active network,
analyse it and change the parameters accordingly.
Handover parameters can be adjusted to balance the load between different systems
and to take full advantage of the common resource pool to achieve trunking gains from
it. By adjusting idle mode parameters, the initial camping of the mobile can be directed
to the desired radio system and unnecessar y handovers can be avoided.
300 Radio Network Planning and Optimisation for UMTS
Table 5.7 Trunking gain in the case of load sharing between EDGE and WCDMA. The
blocking probability used was 2% and the capacity of EDGE is the same as that of WCDMA.
Number of WCDMA or WCDMA þEDGE Combined Trunking
channels EDGE capacity gain
[Erl] [Erl] [Erl] [%]
Speech 60 49.6 99.3 107.4 8.2
64 kbps 10 5.1 10.2 13.2 29.7
144 kbps 5 1.7 3.3 5.1 53.4
384 kbps 2 0.2 0.4 1.1 145.2
5.3.2 Transmission Planning
The aim of transmission planning is to connect BSs to BSCs or Radio Network
Controllers (RNCs). Transmission media can be copper wire, coaxial cable, micro-
wave links or fibre-optic line. Microwave links are flexible and can easily be located
at the same places as BSs, whereas the copper wire solution will need more civil engin-
eering work. Fibre-optic lines are deployed if there is a need for high-capacity links.
The main difference between radio network and transmission planning is that in the
latter case the network should be planned to fulfil the capacity demand s throughout the
network’s lifespan. The topology of the transmission network determines its capacity,
protection and expandability, theref ore topology changes should be avoided if possible.
5.3.2.1 Transmission Topologies
Co-siting of WCDMA and GSM BSs means that the whole network will be affected,
both access and core. Together with capacity growth, the content of the carried signal
moves from circuit switched speech to packet data, both RT and NRT.
Upgrading means important modifications in three areas. There could be topological
changes, site configuration changes, and media upgrading and changes.
The topologies used can be divided into five structures: chain, star, tree, loop and
mesh. Chain topology can be used, for example, along highways but gives poor
protection against faults. Loop and mesh topologies can provide good protection but
they are quite expensive solutions.
In any case a major upgrade of the transmission backbone for 3G systems is needed,
compared with a GSM network. While a standard 4 þ 4 þ4 GSM site can be fitted to a
single E1 trunk, a single WCDMA TRX (transmit and receive unit, or transceiver)
delivers up to 1.5 Mbps of data on the Iub interface.
In a typical urban European network, macro-cells with one carrier have been
simulated to have an average throughput of 700–1000 kbps. Including 30% soft
handover overhead, various protocol overheads, and so on, this adds up to a total of
typically 1.5 Mbps per TRX, meaning a typical WCDMA 1 þ 1 þ1 site will need a
transmission capacity of approximately 5 Mbps for 3G traffic. This is additional to
existing GSM traffic. Note that GPRS does not contribute extra traffic, since it is
handled via the GSM air interface, which has a direct mapping to the Abis interface
(non-blocking).
On the access network (Abis, Iub) the existing chain and loop topologies must be
investigated and modified to accommodate the additional 3G traffic. This is likely to
cause redesign of transmission topologies, or at least of traffic routing. In any case the
issue leads to additional capacity needs. A factor of approximately 4 in additional
capacity is needed.
5.3.2.2 Transmission Methods
The transmission method defines the structure of the data and control stream in a
transmission medium. In 2G networks the data and control streams were structured
according to E1 or T1 trunks; the method was based on Time Division Multiplex
WCDMA–GSM Co-planning Issues 301
(TDM). In 3G transmission networks the new method will be Asynchronous Transfer
Mode (ATM) and, in the future, Internet Protocol Radio Access Network (IP RAN).
The main difference between 2G and 3G traffic is assumed to be the burstiness of 3G
services, as the packet data share will increase more than circuit switched data. The
variety of services in 3G networks will also ben efit from the statistical multiplexing gain
achieved in ATM networks. The delay characteristics of ATM networks are looser than
those of TDM networks where in practice the delay is constant. In all-IP networks the
delay characteristics will be specified. All-IP deployment enables the combining of
different services and technologies under the same protocol, which will reduce system
building and operating costs.
5.3.2.3 Transmission Sharing between Systems
Sharing of the transmission systems between GSM and WCDMA would be useful in
order to make full use of the existing hardware and to prevent the building of a totally
new transmission network. By sharing hardware resources, some trunki ng gain can be
achieved, and statistical multiplexing gain can also be obtained for 2G network services
if the ATM or all-IP transmission network is deployed. In most cases there would be no
strict necessity to change geographical topology and therefore sharing can be done by
just adding or changing low-capacity devices to higher capacity ones.
5.3.3 Perception of Different Technologies by the End-user
Technology comparison is a natural issue if the UMTS technology layer is included in
an existing 2–2.5G network. As the netw ork needs to meet customer expectations from
the end-user point of view, new technology must meet very good interworking
standards from the beginning. This means especially inter-system handovers and cell
reselection functionality along with similar or better Call Drop Rate (CDR) experience
by the end-user. The property is important for services like speech where behaviour and
quality is known from GSM and other cellular systems. Thus, the CDR must be the
same or better. Let us consider the behaviour of speech quality in the situation when the
mobile is moving out of the coverage area and it is not feasible to make a handover to a
better cell either in the same or another technology. In this situation the desired
behaviour of the mobile is to drop the connection after a similar period of bad
quality as would have happened in the already used technology. Such behaviour
represents an optimum between customer churn on one side and effective usage of
technology on the other side. This should be adjusted by parameters and it is a
natural optimisation target from the beginning.
5.3.4 Tight Usage of Frequency Spectrum by Different Technologies
In some cases the frequency regulator issues a technology-independent licence. Thus,
the operator can handle the spectru m owned quite freely. One possibility is thus that the
spectrum is tightly used by different cellular technologies. Tight frequency use of the
spectrum by different technologies brings challenges to the additional filtration solution
for 2G BSs. The minimum coupling requirements between different BSs and different
302 Radio Network Planning and Optimisation for UMTS
cellular systems are specified in [15]. Concrete solution of such cases depends on the
spectrum situation of the specific case. 3GPP technical specifications for BS radio
transmission and reception in FDD mode are in [15] and the Mobile Station (MS) is
specified in [1]. The impact of narrowband technologies with tight frequency separation
from the UMTS band is discussed in the next section.
5.4 Narrowband and WCDMA System Operation in Adjacent
Frequency Bands
Utilisation of WCDMA outside the 2 GHz UMTS core band – e.g., in the GSM1800
band or in the US Personal Communication System (PCS) 1900 MHz band – is now
discussed. When the adjacent system to WCDMA is some narrowband mobile tele-
communication system, such as GSM/EDGE, TDMA or narrowband CDMA, the
evolution of mobile network systems from 2G to 3G requires flexible utilisation of
available frequency bands. Operation of the WCDMA system when there are
adjacent narrowband systems working in the same geographical area is, however,
different from operation with the basic frequency allocation because of increased inter-
ference between the narrowband system and the WCDMA system.
In the 3GPP specifications the coexistence of WCDMA with the spectrally adjacent
narrowband system has been taken into account. 3GPP Release 5 specifies both the
characteristics for the WCDM A BS and the User Equipment (UE) respective MS when
operating at the same band with the narrowban d system – the PCS system in this case
([1] and [15]). The most essential requirements covered by the specifications are
blocking for the BS and out-of-band emission levels, as well as requirements for the
narrowband blocking and intermodulation characteristics of the MS.
New 3G multimedia services and enhanced capacity require more user bandwidth,
which in turn causes decreased tolerance to interference from systems operating at
adjacent frequency bands. This is due to the more demanding design of the
wideband, linear components and also because a wideband receiver is more exposed
to various interference sources. Also, the new frequency alloc ation schemes set
additional requirements for the components. For example, the narrower duplex gap
in the case of the PCS band sets more stringent requirements for duplex filters at the
MS.
In interference limited systems such as WCDMA, the increased interference causes a
need for additional power in order to maintain the link quality, which in turn effects
additional capacity and coverage degradation. In the adjacent channel operation of
WCDMA and narrowband syst ems, several possible interference sources or
interference mechanisms are present. The relative importance of various interference
mechanisms is dependent on implementation of different network elements, locations of
interfered and interfering sites with respect to each other, and the type and size of the
cells. Performance degradation can be decreased by introducing guardbands around the
WCDMA carrier, by frequency planning, by careful site and power planning or by co-
siting with the interfering system. The general frequency allocation scenario showing
WCDMA–GSM Co-planning Issues 303
the WCDMA band W
WCDMA
, the band allocated for the narrowban d system W
NB
and
the guardband Df
g
are shown in Figure 5.16.
By co-siting, it is possible to avoid the near–far effect between WCDMA and
narrowband systems. The near–far effect here means, for example, that when the
narrowband mobile is close to the WCDMA site and far away from its own site
there will be uplink inter ference from the narrowband mobile to the WCDMA BS,
and also that when the WCDMA MS is close to the narrowband BS there will be a
large downlink interference component from the narrowband system to the WCDMA
system. These same interference mechanisms also occur from the WCDMA system to
the narrowband system, but the effect is smaller. Figure 5.17 shows some of the
principal frequency allocation schemes associated with the WCDMA narrowband co-
operation case. The upper scheme shows the situation where operator 1 has one
WCDMA carrier and several narrowband carriers and the other operators have only
narrowband carriers. The middle scheme shows the situations wher e operator 1 has
only one WCDMA carriers and adjacent to that there are narrowband carriers of other
operators. In the lower scheme operator 1 has two adjacent WCDMA carriers.
In the first scheme, operator 1 can coordinate the usage of WCDMA and its own
narrowband systems by co-siting them. By doing this the uncoordinated narrowband
304 Radio Network Planning and Optimisation for UMTS
∆
f
g
f
…
W
N
B
W
WCDMA
∆
f
Figure 5.16 Frequency allocation with narrow and wideband systems including a guardband.
(a)
Operator2
Operator1Operator2
Operator1
WCDMA
WCDMA
(b)
NB
NB
NB
NB
Operator3
Operator3
Operator3
Operator2
Operator1
Operator3
Operator2
Operator1
NB
NB
NB
NB
NB
NB
WCDMA
WCDMA
NB
NB
(c)
Operator3
Operator1
WCDMA
WCDMA
WCDMA
NB
NB
NB
Operator3
NB
Operator2
Operator1
Operator2
WCDMA
Figure 5.17 Different frequency scenarios: (a) embedded scenario; (b) 5 MHz operation
scenario; (c) 10 MHz operation scenario. The upper frequency allocations are for downlink
and the lower ones are for uplink transmission directions.
system is spectrally far away from the WCDMA system, decreasing the interference
levels considerably. In the second case, operator 1 has only one WCDMA carrier just
next to adjacent operators’ bands. In this case the interference is high, since the sites of
different operators are usually not co-located. There is a possibility that the WCDMA
and narrowband systems interfere each other, and such interfer ence has to be taken
into account in radio network planning and dimensioning. Interference between
narrowband and CDMA systems has also been studied in [8]–[10]. In the last
frequency scenario, operator 1 has two adjacent WCDMA carriers. In this case the
performance degradation of the WCDMA system due to additional interference can be
avoided with inter-frequency handover between WCDMA carriers.
5.4.1 Interference Mechanisms
Figure 5.18 shows the main interference mechanisms between WCDMA and
narrowband systems. In the following sections these interference mechanisms will be
discussed. More detailed information about different interference mechanisms can be
found, for example, from [4].
5.4.1.1 Adjacent Channel Interference
Adjacent Channel Interference (ACI) results from non-ideal receiver filtering outside
the band of interest. Even with an ideal transmitter emission mask, there is interference
coming from adjacent channels because of ACI. Adjacent channel filtering and
therefore ACI dep end on the implementation of analogue and digital filter ing at the
MS in the downlink and at the BS in the uplink. Additionally, ACI is dependent on the
power of the interfering system as well as the frequency offset between the interferer and
the interfered systems. Usually, ACI is most severe when the channel separation
between the own band and the interfering band is low. The effect of ACI decreases
WCDMA–GSM Co-planning Issues 305
1) Adjacent
Channel
Interference
3) Adjacent C hannel
Interfernece (ACI)
4) IMD at the
WCDMA MS
6) WB emissions
from NB BS
NB BS
WCDMA BS
5) Crossmodulati
o
(XMD)
Adjacent channel
interference
IMD at the
WCDMA MS
Cross-modulation
NB BS
WB emissions
from NB BS
WCDMA BS
Adjacent channel
interference
Figure 5.18 Main interference mechanisms between the narrowband system and the WCDMA
system.
rapidly outside the receive band, so ACI can be eliminated with an adequate guardband
beside the WCDMA band.
5.4.1.2 Wideband Noise
Wideband noise refers to all out-of-band emission components coming from the trans-
mitter outside the wanted channel of the interfering system. It includes unwanted
wideband emissions, thermal noise, phase noi se and spurious emissions as well as
transmitter intermodulation. These interference mechanisms usually appear at fre-
quencies which are far away from the band of interest and therefore these
mechanisms can be considered as wideband. The allowed upper limit of wideband
noise is usually described in the specifications of the narrowband system.
5.4.1.3 Intermodulation Distortion at the Receiver
Intermodulation Distortion (IMD) is caused by non-linearities in the RF components
of the receiver or transmitter. Intermodulation takes place in the non-linear component
when two or more signal components reach it and the signal level is high enough for the
operating point to be in the non-linear part of the component. When two or more
signals are added together in the non-linear element, the resulting outcome from the
element includes, in addition to the desired signal frequency, higher order frequencies
caused by the higher order non-linearities. Third-order IMD is particularly problem-
atic, because it is typically strongest and falls close to the band of interest. In the case of
two interfering signals on frequencies f
1
and f
2
, in the proxim ity of the desired signal,
third-order IMD products are those falling on frequencies 2f
1
À f
2
and 2 f
2
À f
1
(Figure
5.19). Higher order IMD products exist but are usually less strong.
Usually, the receiver IMD is the most relevant source of intermodulation, since the
active components in the receiver are less linear than those in the transmitter; therefore,
only the receiver IMD is considered here. Furthermore, we can focus on the downlink,
since the active components in the BS are more linear than those in the MS. This is
because, when increasing the linearity of the receiver, the power consumption increases
as well, which is usually more critical in the design of the MS.
The IMD in the downlink is caused by the mixing of products of the narrowband BS
with carrier frequencies f
1
and f
2
. Assuming that these frequencies have equal powers,
so that P
f 1
¼ P
f 2
, the third-order intermodulation power reduced to the input of the
nonlinear element is given by:
P
in
IMD
¼ 3 Á P
i
À 2 ÁIIP
3
ð5:13Þ
306 Radio Network Planning and Optimisation for UMTS
f
IMD
=2f
2
-f
1
f
1
f
2
f
Figure 5.19 Third-order intermodulation distortion.
where P
i
[dBm] is the power at the input of the non-linear component; and IIP
3
[dBm]
is the third -order input intercept point of the same. So, the strength of this mechanism
depends on the output power of the interfering BS as well as the receiver linearity. The
strength of the IMD is proportional to the third power of P
i
so that it is large when the
receiver is close to the interfereing source but decreases rapidly as distance and there-
fore path loss increase.
5.4.1.4 Transmission Intermodulation Distortion
In CDMA systems, mobile transmission and reception occur simultaneously and a
portion of the transmitted signal leaks into the receiver due to non-idealities of the
duplex filter. Therefore, another IMD mechanism results from the interaction of a
single strong interferer and the leaking transmission signal. Figure 5.20 illustrates
this phenomenon, here referred to as Transmissi on Inter M odulation Distortion
(TxIMD). If the interfering frequency, f
I
, is below the mobile trans mission
frequency, f
Tx
, so that f
TxIMD
¼ 2f
Tx
À f
1
, the intermodulation power at the input of
the LNA is given as:
P
TxIMD
¼ P
i
þ 2 ÁP
MS;leak
À 2 ÁIIP
3
; if f
Tx
> f
I
ð5:14Þ
where P
i
is the interferer power at the receiver input; and P
MS;leak
is the leakage power
from the mobile transmission. If the interfering frequency, f
I
, is above the mobile
transmission frequency, f
Tx
, so that f
TxIMD
¼ 2f
I
À f
Tx
, the intermodulation power at
the input of the receiver is given as:
P
TxIMD
¼ 2 Á P
i
þ P
MS;leak
À 2 ÁIIP
3
; if f
Tx
< f
I
ð5:15Þ
The severity of the TxIMD depends on the particular frequency scenario. In mobile
telecommunicatio n app lications the component given in Equation (5.15) is usually
more relevant, because it corresponds to the case where the frequency of the
interferer is located wi thin the receive frequency band and has no attenuation due to
band-selective filtering. It should be noted that TxIMD is proportional to the strength
of the leakage power, which is subsequently dependent on the isolation properties of
duplex filtering. If the isolation of the duplex filter is large enough, the TxIMD has
quite a minor effect on system performance.
DL band
f
TxIMD
f
RX
UL band
f
TX
f
f
I
Figure 5.20 Transmission intermodulation.
5.4.1.5 Cross-modulation Distortion
Cross-modulation Distortion (XMD) is also caused by third-order receiver non-
linearities. It is produced in the non-linear receiver element when an amplitude-
modulated mobile transmission signal is mixed with a narrowband interferer located
WCDMA–GSM Co-planning Issues 307
close to the mobile reception frequency. The power of the cro ss-modulation at the input
of the receiver can be written as:
P
XMD
¼ P
i
þ 2 ÁP
MS;leak
À 2 ÁIIP
3
À C
XMD
À L
XMD
ðDf
c
Þð5:16Þ
where P
MS;leak
represents transmission leakage; P
i
is the narrowband interferer power;
and C
XMD
is a factor that depends on the transmit signal modulation index. Reduction
of cross-modulation power as a function of channel separation, due to the partial
overlap with the wanted signal, is given by:
L
XMD
ðDf Þ¼
À10 Álog
10
2
Df
B
1 À
ðDf ÀB=2Þ
B
2
; if Df 3B=2
1; if Df > 3B=2
8
<
:
ð5:17Þ
For further description of cross-modulation see [4]–[6], for example. Figure 5.21
shows the cross-modulation spectrum around the narrowband signal which flows
into the reception band.
5.4.2 Worst Case Analysis
In this section a simple comparison between different interference compon ents is carried
out. The target is to show the interfer ing power of the most important interference
mechanisms in different cases in a situation where the interfering BS or MS is very close
to the interfered BS/MS. Table 5.8 shows the basic parameter values used for this
analysis.
308 Radio Network Planning and Optimisation for UMTS
f
X
MD
f
Rx
f
i
f
Tx
f
Figure 5.21 Cross-modulation spectrum modulated around the outside interferer.
Table 5.8 Parameters used for worst case analysis.
Bandwidth 5 MHz
WCDMA MS transmission power 21 dBm
WCDMA BS transmission power 43 dBm
Narrowband MS transmission power 30 dBm
Narrowband BS transmission power 43 dBm
Rejection loss of duplexer in MS 40 dB
IIP
3
at the MS -10 dBm
C
XMD
5dB
XMD attenuation at 1 MHz channel separation 0.5 dB
Minimum coupling loss between MS and BS (MCL) 75 dB
Time averaging of MS power (one over eight slots ¼À10 Á log
10
ð1=8Þ)9dB
Table 5.9 shows the assumptions of the out-of -band noise and adjacent channel
filtering of both the MS and BS of the narrowband system and WCDMA.
Table 5.10 shows the worst case analysis based on these parameter, out-of-band
emissions and filtering values. From these results we can see that the worst direction
for interference is from the BS of the narrowband system to the WCDMA mobile.
The uplink interference from the narrowband MS to the WCDMA BS is also con-
siderable, since the increase of interference level at the BS influences the coverage area
of the whole cell (Figure 5.22). Assuming that the interference limit for the narrowband
WCDMA–GSM Co-planning Issues 309
Table 5.9 Assumed out-of-band emission and adjacent channel filtering values for worst case
analysis.
WCDMA MS WCDMA BS Narrow- Narrow-
band MS band BS
Out-of-band No guardband À26.8 dBc À48.8 dBc À11.5 dBc À11.5 dBc
emissions, at 200 kHz at 200 kHz at 5 MHz at 5 MHz
[1], [2] and [15] 1 MHz À42.0 dBc À60.8 dBc À53.1 dBc À64.5 dBc
guardband at 200 kHz at 200 kHz at 5 MHz at 5 MHz
Channel No guardband 10 dB 20 dB 41 dB over 45 dB over
filtering 5 MHz 5 MHz
1 MHz 30 dB 45 dB 67 dB over 70 dB over
guardband 5 MHz 5 MHz
Table 5.10 Interference levels with minimum coupling loss.
Uplink Downlink
Channel separation 200 kHz
WCDMA !NB 21 À 26:8 À 75 ¼À80.8 dBm (WB) 43 À 48:8 À75 ¼À80.8 dBm (WB)
21 À 75 À 45 ¼À99 dBm (ACI) 43 À 75 À41 ¼À73 dBm (ACI)
NB !WCDMA 30 À 11:5 À 75 À 9 ¼À65.5 dBm (WB) 43 À 11:5 À75 ¼À43.5 dBm (WB)
30 À 75 À 20 À 9 ¼À74 dBm (ACI) 43 À 75 À 10 ¼À42 dBm (ACI)
43 À 75 þ 2 Âð21 À 35ÞÀ2 Â
ðÀ10ÞÀ5 ¼À45 dBm (XMD)
2 Âð43 À75Þþð21 À35ÞÀ2 Â
ðÀ10Þ¼À58 dBm (TxIMD)
Channel separation 1 MHz
WCDMA !NB 21 À 42:1 À 75 ¼À96.1 dBm (WB) 43 À 60:8 À75 ¼À92.8 dBm (WB)
21 À 75 À 55 ¼À109 dBm (ACI) 43 À 75 À 67 ¼À99 dBm (ACI)
NB !WCDMA 30 À 53:1 À 75 À 9 ¼À107.1 dBm (WB) 43 À64:5 À75 ¼À96.5 dBm (WB)
30 À 75 À 45 À 9 ¼À99 dBm (ACI) 43 À 75 À 30 ¼À62 dBm (ACI)
43 À 75 þ 2 Âð21 À 35ÞÀ2 Â
ðÀ10ÞÀ5 À 0:5 ¼À45:5 dBm
(XMD)
2 Âð43 À75Þþð21 À35ÞÀ2 Â
ðÀ10Þ¼À58 dBm (TxIMD)
system is 90 dBm in the downlink, when the WCDMA interference reaches this limit the
coupling loss is 43 À41 þ90 ¼92 dB, assuming 41 dB filtering at the GSM MS over the
5 MHz band. This means that when the coupling loss is below 92 dB the GSM MS is in
outage, due to interference from the WCDMA BS. With 92 dB path loss the inter-
ference at the WCDMA BS is 30 À 9 À 92 À11:5 ¼À82.5 dBm. When the coverage
target is 95 dBm this means that there might be a coverage reduction of 12.5 dB. This
happens only in those cases where the narrowband mobile is allocated to the next
carrier and is very close to the WCDMA cell.
5.4.3 Simulation Case Study with a Static Simulator
This section shows two sim ulation studies of narrowband and WCDMA operators
working in the same geographical area. In this scenario, the figures shown in colour
can be found at the weblink (www.wiley.com/go/laiho). In these studies there is no
guardband between operators. In the first case study, both the WCDMA and the
narrowband operator utilise macro-cells. The sites of these two operators are
assumed to be independently located. In the second case study, one ope rator uses
macro-cells and the other uses micr o-cells. Only downlink interference effects have
been studied here because of their relative importance as concluded in Section 5.4.2.
Table 5.11 shows the main input values for the simulation case.
The main interference-related parameters are collected in Table 5.12. Narrowband
BS powers have been assumed to be constant in the simulations. Out-of-band noise
emissions have been considered as constant over the spectrum.
In the presence of narrowband interference the Signal-to-Interference Ratio (SIR) in
the downlink is given by:
S
I
i
¼
p
i
=L
p;i
ð1 À
i
ÞÁP þI
oth;i
þ I
WB;i
þ I
ACI;i
þ L
1
Á I
XMD;i
þ N
ð5:18Þ
where P is the trans mitting power of the BS;
i
is the orthogonality of the propagation
channel; I
oth;i
is the interference coming to mobile i from other BSs of the WCDMA
systems; I
WB;i
, I
ACI;i
and I
XMD;i
are the narrowband interference powers of wideband
emissions, AC I and cross-modulation, respectively; L
1
is the attenuation between the
antenna and the LNA; N is thermal noise; and L
p;i
is the link loss between the
310 Radio Network Planning and Optimisation for UMTS
NB BS
WCDMA BS
Interference from NB MS to WCDMA BS
downlink dead-
zone area
Interference from WCDMA BS to NB MS
Figure 5.22 Uplink interference when a narrowband mobile station is close to the WCDMA
base station.
WCDMA BS and MS i, including a ntenna gains. The contribution of the IMD and the
TxIMD has been neglected in these simulations.
The transmission power for each link is allocated to meet the SIR requirement of the
service carried on that link. Increased downlink interference also increases the needed
transmission power at the BS, and the link will be blocked if the maximum allowed
transmission power is exceeded. This could happen especially when the mobile is very
close to the interfering BS. This might cause deadzones around narrowband BSs and
thus mainly limits the coverage. The capacity of the WCDMA cell is limited by the
maximum allowed transmission power of the BS and, therefore, increased interference
also decreases the capacity of the WCDMA system. This effect is visual ised in
Figure 5.23.
WCDMA–GSM Co-planning Issues 311
Table 5.11 Main system parameters.
Chip rate 3.84 Mcps
Base station maximum transmit power 43 dBm (macro-cells)
37 dBm (micro-cells)
Mobile station maximum transmit power 21 dBm
Mobile station minimum transmit power À50 dBm
Shadow fading correlation between base stations/sectors 50 %/80 %
Channel profile ITU vehicular
Service 12.2 kbps, speech
Mobile station speed 3 km/h
MS/BS noise figures 11 dB/5 dB
CPICH power 30 dBm
Combined power for other common control channels 23 dBm
Orthogonality 50 %
BS antennas 65
, 17.5 dBi (macro-cells)
Omni (micro-cells)
MS antennas Omni, 0 dBi
Cable losses 0 dB
Propagation model Okumura–Hata (macro-cells)
Ray-tracing model (micro-cells)
Table 5.12 Main interference-related parameters.
Transmission power of narrowband macrocell 43 dBm
Transmission power of narrowband microcell 35 dBm
Rejection loss of duplex filter 40 dBm
Noise emission level from narrowband BS À13 dBm
Narrowband bandwidth 3 MHz
MS IIP
3
À10 dBm
C
XMD
5 dBm
Guardband 0 MHz
Assumed slope function for MS filter
( f ¼separation between WCDMA and narrowband carriers in MHz) À21 Áðf À 2:5ÞÀ11 dB
When a large number of mobiles in a WCDMA cell are affected by narrowband
interference and the power needed for each link increases, the total transmission power
needed increases as well. In the Radio Resource Management (RRM) functionalities of
the WCDMA, such as admission control, packet scheduling or load control, the total
transmission power is measured to detect the downlink load. The load of the system is
adjusted to the target level and RRM actions take place when the load exceeds the
target level. Thus, the increased average interference reduces the maximum number of
users that the system is able to support.
If the link-specific power is above the maximum allowed link power, the mobile is
unable to get the required service. Also, if the target BS power is exceeded, the system
has to limit the number of users. These two limitations have also been taken into
account in system simulations. When link-specific maximum powers are limiting,
those users who need large power levels – e.g., for increased narrowband interference
– will be dropped from the calculations. This, in fact, most probably increases the
overall maximum capacity of the system since – after dropping the large power
allocated to one user – it is now available to support the remaining users (interference
is large only in limited areas around narrowband BSs).
Because of different propagation conditions in micro-cells and macro-cells, inter-
ference also depends on cell type. In micro-cells the radiowave propagates through
street canyons and the shadowing effects of individual buildings can be significant.
One example is the street corner effect, where the signal strength drops by 10–30 dB
when the mobile moves from LOS to Non LOS (NLOS). In particular, the worst case
scenario might be when the interfering narrowband BS is micro-cellular and the
WCDMA cell is macro-cellular, so that the mobile can be in LOS to the interfering
BS and in NLOS to its own BS. In the basic interference case both the interfering and
interfered cells are in macro-cellular networks; this means that the antennas are above
the rooftops, the proportion of LOS area is negligible and the effect of interference is
rather small.
Generally speaking the effect of the external interference depends on the relative cell
sizes of the interfering and the interfered cells. When the average size of the interfer ing
cell is small compared with the interfered cell, the effect of interference is large
compared with the case where the interfering network is sparse and the interfered
network is denser. This means that, for examp le, in the rollout phase of the new
system, the macro-cells that are usually preferred are those that are, however, more
exposed to interference problems.
312 Radio Network Planning and Optimisation for UMTS
users in the WCDMA cell
capacity reduction
power increase
DL Tx
power
target DL power
without interference
with interference
target DL Tx power
Figure 5.23 The effect of narrowband interference on WCDMA downlink capacity.
In the first case study, the effect of macro-cell narrowband interference on WCDMA
macro-cell downlink capacity and coverage was studied. It was assumed that operators
do not share sites but plan their networks independently. In the simulation study, two
operators were assumed to have both their WCDMA networks and narrowband
networks co-sited. The frequency scenario used is shown in Figure 5.24. In the first
sub-case the lower frequencies were allocated to operator 2 and the upper frequencies to
operator 1, and in the second sub-case vice versa. Interference between the WCDMA
carriers of different operators was neglected and only the capacity effects of the
WCDMA systems are considered here. ACI, wideband noise and XMD have been
taken into account in these simulations. The main reason for the increased interference
in this example is the ACI, because no guardband between operators was used.
5.4.3.1 Macro-cell–Macro-cell Scenario
The network scenario of the macro-cell case, as well as the initial user distribution of
operator 1, are shown in Figure 5.25. In these simulations the channel spacing of the
narrowband system is 200 kHz. In the macro-cell case each narrowband cell has been
allocated to its own frequency channel so that cell d1 has the channel closest to the
WCDMA carrier of the adjacent operator with 2.6 MHz channel separation, cell d2is
allocated to the next carrier with 2.8 MHz channel separation and so on. The overall
narrowband spectrum used by operator 1 is 12 Â 0:2 ¼ 2:4 MHz and by operator 2 is
13 Â0:2 ¼ 2.6 MHz.
The service probability in the downlink for 12.2 kbps users was simulated first
without and then with narrowband interference. The respective coverage results with
no interference are shown in Figures 5.26–5.28. The initial number of users requesting
service in the downlink was 400 for both WCD MA macro-cell operators. Two
downlink power allocation schemes were also tested, with and without the link-
specific power limitations. With no link-specific power limitations, the numbers of
satisfied users were 382 and 366 for operators 1 and 2, respectively, giving a service
probability of 95% and 92% for the two operators. If the downl ink link power s of
12.2 kbps users were limited to 30.4 dBm, the numbers of satisfied users would be 391
and 393 for operators 1 and 2, respectively, now giving a service probability of about
98%. When the link-specific downlink powers were limited, the service probability
increased slightly, because those users who need more power also reduce the power
resources for other users. Figure 5.26 shows the downlink coverage analysis for
operator 1 in the case without narrowband interference. Each pixel in the coverage
WCDMA–GSM Co-planning Issues 313
WCDMA NB
Case1: Op2
Case2: Op1
guard band
WCDMA NB
Case1: Op1
Case2: Op2
Figure 5.24 Frequency scenario for operators 1 and 2 used in the simulation case study.
Operator 1 has 12 cells and operator 2 has 13 cells.
map represents the needed link-specific transmit power from the best server cell for that
point in current interference conditions. It can be seen that the needed power is usually
above 15 dBm, and at the cell borders about 30 dBm. The calculated coverage
percentage, however, is very high at 99.9%. Figure 5.28 shows the cumulative distribu-
tion of the needed powers from the best server cell. According to these results, about
25–27 dBm power per link would be needed in order to reach 95% coverage probability.
When narrowban d interference was present the number of users without downlink
power limitations were 340 and 366 for operators 1 and 2, respectively, and the service
probabilities were 85% and 92% with respect to simulation cases 1 and 2 in Figu re 5.24.
When using the link-specific power limitation of 30.4 dBm the number of served users
were 378 and 391, respectively. Thus, the narrowband interference decreases the
capacity of operator 1 from 391 to 378 and that of operator 2 from 393 to 391. The
overall capacity reduction was then 11% and 3.3% without and with the link-specific
DL power limitations for operator 1, and 0% and 0.5% for operator 2, respectively.
The final results of this capacity analysis are summarised in Table 5.13. Figures 5.29–
5.31 show the area coverage in the case when narrowband interference is present. The
coverage probability is 97.5% for operator 1 and 97.4% for operator 2. There are,
however, very large deadzone areas around the other operator’s BS. For operator 1 the
problems are concen trated on areas where there are cells working at the closes t carriers,
which are sites 1–3 of operator 2 using carriers with 2.6, 2.8 and 3.0 MHz separation
from the WCDMA carrier. In other locations there are only minor deadzone areas. In
the case of operator 2, there are also deadzones around the closest carriers (sites 1–3 of
operator 1), but even larger deadzone areas exist on the left-hand side of the figure at
carriers 4 and 5, which are 3.2 and 3.4 MHz away from the WCDMA centre frequency.
314 Radio Network Planning and Optimisation for UMTS
384200 384600 385000 385400 385800 386200 386600 387000 387400 387800
6674000
6674400
6674800
6675200
6675600
6676000
USER DISTRIBUTION for operator 1 (all) (total = 400 users)
OP1
1
OP1
2
OP1
3
OP1
4
OP1
5
OP1
6
OP1
7
OP1
8
OP1
9
OP1
10
OP1
11
OP1
12
OP2
1
OP2
2
OP2
3
OP2
4
OP2
5
OP2
6
OP2
7
OP2
8
OP2
9
OP2
10
OP2
11
OP2
12
OP2
13
X-coordinate [m]
Y-coordinate [m]
Figure 5.25 Macro-cell–macro-cell network scenario and the initial user distribution: 12 macro-
cells of operator 1 (green sites) and 13 macro-cells of operator 2 (red sites). See www.wiley.com/go/
laiho for colour images.
This is because of the more open propagat ion environment around sites 4 and 5, so that
the path loss difference between the own and the interfering site is much larger in this
case. It has to be noted that narrowband interference only includes the contribution
from the adjacent operator, an d the effect of the own narrowband network has not been
taken into account.
Figure 5.31 shows the cumulative distribution of the required link-specific trans-
mission powers with the narrowband interference. The needed power in this case in
order to achieve 95% coverage probability was 28–29 dBm, which is 2–3 dB higher than
in the case without narrowband interference.
Macro-cell–Macro- cell Case without Interference (Figures 5.26–5.28)
WCDMA–GSM Co-planning Issues 315
Table 5.13 Capacity simulation results in the macro-cellular case. The initial number of users
was 400 in each of the two operators’ networks.
Without narrowband interference With narrowband interference
Without power With power Without power With power
limitation limitation limitation limitation
Operator 1 382 391 340 378
Operator 2 366 393 366 391
Figure 5.26 Link powers needed in WCDMA macro-cells (operator 1) when narrowband
interference is not present. Downlink coverage of 12.2-kbps service is 99.9%.
316 Radio Network Planning and Optimisation for UMTS
10 15 20 25 30 35 40
0
10
20
30
40
50
60
70
80
90
100
CDF of required power per link for Operator 1
Required Tx power (dBm)
P
ro
b
a
bilit
y
(%)
Target coverage probability
15 20 25 30 35 40
0
10
20
30
40
50
60
70
80
90
100
CDF of required power per link for Operator 2
Required Tx power (dBm)
Probability (%)
Target coverage probability
Required Tx power [dBm]
Required Tx power [dBm]
Probability
[%]
Probability
[%]
Figure 5.28 Cumulative distributions of downlink powers needed for 12.2 kbps service for
operator 1 (left) and operator 2 (right) with no narrowband interference from the adjacent
operator.
Figure 5.27 Link powers needed in WCDMA macro-cells (operator 2) when narrowband
interference is not present. Downlink coverage of 12.2 kbps service is 98.3%.
Macro-cell–Macro- cell Case with Interference (Figures 5.29–5.31)
WCDMA–GSM Co-planning Issues 317
Figure 5.29 Link powers needed in WCDMA macro-cells (operator 1) when narrowband
interference is present. Downlink coverage of 12.2 kbps service is 97.5%.
Figure 5.30 Link powers needed in WCDMA macro-cells (operator 2) when narrowband
interference is present. Downlink coverage of 12.2 kbps service is 97.4%.
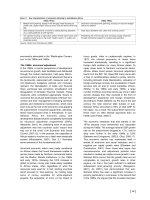
5.4.3.2 Micro-cell–Macro-cell Scenario
The micro-cell simulation case was basically similar to the macro-cell case but with
operator 2 now using micro-cells. With this scenario it is possible to study the extent to
which the narrowband micro-cellular network interferes with WCDMA macro-cells
and also the extent to which the narrowband macro-cell system interferes with the
318 Radio Network Planning and Optimisation for UMTS
2.5 3 3.5 4 4.5 5 5.5 6 6.5 7
0
10
20
30
40
50
60
70
80
90
100
capacity reduction (%)
carrier separation (MHz)
macro, I
GSM
=-50 dBm
micro, I
GSM
=-50 dBm
macro, I
GSM
=-70 dBm
micro, I
GSM
=-70 dBm
macro, I
GSM
=-90 dBm
micro, I
GSM
=-90 dBm
Carrier separation [MHz]
Capacity reduction [%]
Figure 5.32 Macro-cell–micro-cell network scenario and initial user distribution for the
macrocell: 13 macro-cells of operator 1 (green sites) and 35 micro-cells operator 2 (red sites).
See www.wiley.com/go/laiho for colour images.
10 20 30 40 50 60 70 80
0
10
20
30
40
50
60
70
80
90
100
CDF of required power per link for Operator 1
Required Tx power (dBm)
Probability (%)
Target coverage probability
15 20 25 30 35 40 45 50 55 60
0
10
20
30
40
50
60
70
80
90
100
CDF of required power per link for Operator 2
Required Tx power (dBm)
Probability (%)
Target coverage probability
Required Tx power [dBm]
Required Tx power [dBm]
Pr
obability
[%]
Pr
obability
[%]
Figure 5.31 Cumulative distributions of downlink powers needed for 12.2 kbps service for
operator 1 (left) and operator 2 (right), assuming narrowband interference from the adjacent
operator.
WCDMA micro-cellular system. The used scenario consisted of 12 macro-cells (for
operator 1) and 35 micro-cells (for operator 2) and is shown in Figure 5.32. The micro-
cell antennas were 10 m high and were horizontally omni-directional. Propagation data
were computed with the ray-tracing propagation model.
The micro-cell frequencies were allocated among 15 carriers, thus requiring the 3-
MHz frequency band. The channels were allocated as follows (cell number|channel
number): 1|5, 2|4, 3|3, 4|2, 5|1, 6|15, 7|14, 8|13, 9|12, 10|11, 11|10, 12|9, 13|8, 14|7,
15|6, 16|5, 17|4, 18|3, 19|2, 20|1, 21|15, 22|14, 23|13, 24|12, 25|11, 26|10, 27|9, 28|8,
29|7, 30|6, 31|5, 32|4, 33|3, 34|2 and 35|1. Channel 1 corresponds to the carrier that is
closest to the WCDMA carrier, and channel 15 is the farthest, with 5.4 MHz channel
separation from the WCDMA carrier.
The capacity without the downlink link-specific power limitation when narrowband
interference is not present was 446 for the macro-rcell network and 776 for the micro-
cell network. Initially, there were 500 and 800 mobiles for the macro-cell and micro-cell
networks, respectively. If the link-specific powers were limited, the capacities were 452
and 778, respectively. The service probability was then 89.2% and 97% without the
power limitation, and 90.4% and 97.2% with the power limitation. So the power
limitation increases the overall service probability of the system. In the case of power
limitation, the maximum allowed power per link for the 12.2 kbps service was 30.4 dBm.
Figures 5.33–5.35 show the downlink coverage of the macro-cells of operator 1 and the
micro-cells of operator 2 with no interference from the adjacent operator. The
respective coverage percentage is 99.9% in both cases. Figure 5.35 shows the
cumulative distribution of the transmission power required from the best server of
each pixel, which is about 25 dBm in the macro-cell case and 18 dBm in the micro-
cell case.
WCDMA–GSM Co-planning Issues 319
Figure 5.33 Link powers needed in WCDMA macro-cells (operator 1) when narrowband
interference is not present. Downlink coverage of 12.2 kbps service is 99.9%.
In the next simulation case the effect of narrowband interference from operator 2’s
narrowband micro-cellular network to operator 1’s WCDMA macro-cell network
(Case 1 in Figure 5.24) and from operator 1’s narrowband macro-cellular network
to operator 2’s WCDMA micro-cell network (Case 2 in Figure 5.24) were studied. The
capacities of the WCDMA macro-cell and micro-cell systems were 351 and 761,
respectively, without any link-specific power allocation, and 422 and 763, respectively,
when the link-specific power allocation was applied. The respective service probabilities
in this case were 70.2% and 95.1%.
When the link power limitation of 30.4 dBm is utilised, the respective service
320 Radio Network Planning and Optimisation for UMTS
Figure 5.34 Link powers needed in WCDMA micro-cells (operator 2) when narrowband inter-
ference is not present. Downlink coverage of 12.2 kbps service is 99.9%.
10 15 20 25 30 35 40
0
10
20
30
40
50
60
70
80
90
100
CDF of required power per link for Operator 1
Required Tx power (dBm)
Probability (%)
Target coverage probability
10 15 20 25 30 35 40 45
0
10
20
30
40
50
60
70
80
90
100
CDF of required power per link for Operator 2
Required Tx power (dBm)
Probability (%)
Target coverage probability
Required Tx power [dBm]
Required Tx power [dBm]
Probabil
ity
[%]
Probabil
ity
[%]
Figure 5.35 Cumulative distributions of downlink powers needed for 12.2-kbps service for oper-
ator 1 (left) and operator 2 (right) with no narrowband interference from the adjacent operator.
probabilities were 84.4% and 95.4%. So the service probability in macro-cells dropped
by 6% when narrowband interference was introduced when downlink powers were
limited (Table 5.14).
Figures 5.36–5.38 show the coverage of the micro–macro case study results when the
cells are fully loaded – i.e., the very high interference situation. From Figure 5.36 we
can see that there will be large coverage holes around narrowband micro-cell BSs. The
size of the deadzone is mainly de pendent on three factors: (1) the extent of the LOS
around the narrowband BS, (2) the distance between the narrowband BS and the own
WCDMA BS, and (3) the carrier separation between the own WCDMA carrier and the
narrowband carrier. Also, the antenna pa ttern of the narrowband system as well as its
WCDMA–GSM Co-planning Issues 321
Table 5.14 Capacity simulation results in the micro-cellular case. The initial number of users
was 500 in operator 1’s network and 800 in operator 2’s network.
Without narrowband interference With narrowband interference
Without power With power Without power With power
limitation limitation limitation limitation
Operator 1 446 452 351 422
Operator 2 776 778 761 763
Figure 5.36 Link powers needed in WCDMA macro-cells (operator 1) when narrowband
interference is present. Downlink coverage of 12.2 kbps service is 83.8%. Black areas indicate
locations that cannot be served.