Radio network planning and optimisation for umts 2nd edition phần 7 pps
Bạn đang xem bản rút gọn của tài liệu. Xem và tải ngay bản đầy đủ của tài liệu tại đây (1.35 MB, 66 trang )
In the following each paragraph begins with a direct reference to requirements given
therein.
MIMO proposals shall be comprehensive to include techni ques for one, two and four
antennas at both the base station and UE. This requirement is motivated by the fact that
deploying multiple antennas in the mobile terminal or BS to support MIMO techniques
is not straightforward due to concerns of cost, complex ity and visual impact. This is
especially true of today’s mobile terminals, where basic products with large production
volumes may have at most two antennas. Multi-mode terminals supporting, for
example, WCDMA, GSM and GPS may already require several antennas even
without applying MIMO processing. Macro-BSs typically employ two or four
antennas, and it is expected that two-antenna BSs will dominate in number in the
near future. Thus, in practice, mobile terminals and data modems may have four
antennas at the maximum, while two antennas rep resent the most likely solution.
For each proposal, the transmission techniques for the range of data rates from low to
high SIR shall be evaluated. This is a trivial but important requirement since the gain
from information MIMO greatly depends on the SIR/SNR as is seen from Figure 6.10.
Especially in macro-cell environments the operating SIR/SNR in HSDPA is most of the
time less than 10 dB and the practical performance differences between various diversity
MIMO and information MIMO techniques need not to be as large as Figure 6.10 hints.
Operation of MIMO technique shall be specified under a range of realistic conditions.
The conclusion drawn from this requirement is that there should be realistic
channel models for simulations. This topic has been considered in [24]. Moreover, to
imitate realistic conditions implementation non-idealities should also be taken into
account.
The MIMO technique shall have no significant negative impact on features available in
earlier releases. Let us give an example of a serious backward compatibility problem
that may arise when introducing MIMO. According to present standards there are at
maximum two P-CPICHs applied in UTRA FDD downlink to aid channel estimation
in the mobile terminal. To support four-antenna MIMO a straightforward solution
would be to define two additional P-CPICHs. However, since total transmission
power in the BS cannot be increased due to network interference and capacity
reasons, the transmission power per antenna needs to be ha lved when doubling the
number of transmit antennas in the BS. But then UEs that are made according to
earlier standard releases and can identify only two common pilot signals would
receive in a four-antenna cell only half of the pilot power when compared with the
pilot power that they would receive in a two-antenna cell. This would lead to serious
performance losses.
MIMO techniques shall demonstrate significant incremental gain over the best
performing systems supported in the current release with reasonable complexity.
Although the capacity curves of Figure 6.10 suggest that information MIMO would
give remarkable gains over various diversity systems, it is found that – especially when
the number of antennas is only two at both ends – the practical gains from information
MIMO can be small in some cases [26]. Not only does increasing the number of
antennas increase the gain of information MIMO, but the implementation
complexity also grows rapidly and backward compatibilit y issues – such as the
above-mentioned pilot design problem – need to be faced.
Coverage and Capacity Enhancement Methods 363
6.10.4 Candidate MIMO Algorithms in 3GPP Standardisation
The standardisation of MIMO is still ongoing and there are many candidate algorithms
that are proposed by different parties. In the following sections the proposed algorithms
are briefly summarised. A more detailed description and performance analysis can be
found in [23] and corresponding standardisation contributions.
6.10.4.1 Per-Antenna Rate Control
According to information theory results ([27] and [28]) the capacity limit for an ope n-
loop MIMO link can be achieved by transmitting separately encoded data streams from
different antennas with equal power but possibly with different data rates. This idea
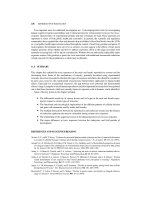
provides a background for the basic Per-Antenna Rate Control (PARC) architecture
that is given in Figure 6.11 in case of N ¼ 2.
PARC shows how the HS-DSCH da ta stream is demultiplexed into two low-rate
streams. Both streams are turbo-encoded, interleaved and mapped onto either QPSK or
16 State Quadrature Amplitude Modulation (16QAM) symbols. Code rates and symbol
mappings can vary between low-rate streams, and therefore the number of information
bits assigned to each stream can be different. Symbols are further demultiplexed into a
maximum of K sub-streams, where K is the maxi mum number of High-speed Physical
Downlink Shared Channels (HS-PDSCHs) defined by the mobile terminal capability.
After spreading these sub-streams – employing distinct Orthogonal Variable Spreading
Factor (OVSF) channelisation codes denoted by OC
1
–OC
K
in Figure 6.11 – they are
summed and modulated by a scrambling code. The resulting antenna-specific WCDMA
signal is transmitted from the associated antenna.
The data rates for different antennas are selected in the BS based on antenna-specific
Signal-to-Interference-and-Noise Ratio (SINR) feedback. If the SINR for a particular
transmit antenna is too low to support even the lowest data rate, then transmission
364 Radio Network Planning and Optimisation for UMTS
MCS
1
D
E
M
U
X
MCS
2
HS-DSCH
Data stream
Coding
Interleaving
Mapping
Coding
Interleaving
Mapping
OC
1
OC
2
SC
SC
OC
K
.
.
.
Scrambling
Channelisation
MCS
1
D
E
M
U
X
MCS
2
HS-DSCH
Data stream
Coding
Interleaving
Mapping
Coding
Interleaving
Mapping
OC
1
OC
2
SC
SC
OC
K
.
.
.
Scrambling
Channelisation
Figure 6.11 Transmitter structure for per-antenna rate control.
through that antenna is suspended. For this purpose the mobile terminal estimates the
CSI for all antennas and sends the required information to the BS through a feedback
channel. Since the Modulation and Coding Scheme (MCS) for each antenna is selected
using SINR feedback, the design of feedback quantisation is an important task. In fact,
quantised CSI defines a mapping onto the table giving the modulation, coding and
number of spreading codes used for each transmit antenna. Since the total number of
possible transport format combinations is large, a suitable subset of combinations
should be designed in order to avoid large signalling overhead.
6.10.4.2 Double STTD with Sub-group Rate Control
Double STTD with Sub-group Rate Control (DSTTD-SGRC) is designed for a system
with 2N transmit and at least N receive antennas. The basic idea is to divide antennas
into N sub-groups each containing two antennas and apply adaptive modulation and
coding along with STTD-based transmission by each group to transmit data. Within
the sub-group both antennas apply the same MCS but the data rates of separate groups
can be adjusted independently or jointly by selection of suitable MCSs. In the
framework given by present 3GPP standardisation the maximum number of transmit
antennas is expected to be four and thus, at maximum, two independent da ta streams
can be transmitted.
DSTTD-SGRC can be viewed as an extension to conventional STTD supported by
Release ’99 standards – STTD was introduced in Section 6.9. While conventional STTD
employs two transmit antennas and a single data stream, DSTTD-SGRC doubles the
number of transmit antennas and data streams, provided that the mobile term ibal is
equipped with at least two antenna s. From this viewpoint it can be expected that
DSTTD-SGRC attains good backward compatibility with previous standard releases.
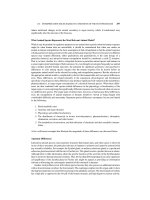
Figure 6.12 shows the structure of the DSTTD-SGRC transmitter when four
antennas are being used. The incoming HS-DSCH data is divided into two streams
by the demux module and transmitted by the first and second sub-groups. The applied
Coverage and Capacity Enhancement Methods 365
MCS
1
D
E
M
U
X
MCS
2
HS-DSCH
Data stream
Coding
Interleaving
Mapping
Coding
Interleaving
Mapping
STTD
STTD
Demux
Demux
Demux
Demux
OC
1
OC
K
SC
OC
1
OC
K
SC
Scrambling
Channelisation
MCS
1
D
E
M
U
X
MCS
2
HS-DSCH
Data stream
Coding
Interleaving
Mapping
Coding
Interleaving
Mapping
STTD
STTD
Demux
Demux
Demux
Demux
OC
1
OC
K
SC
OC
1
OC
K
SC
Scrambling
Channelisation
Figure 6.12 Transmitter structure for double space–time transmit diversity with sub-group rate
control.
MCS and the number of spreading codes define the number of information bits
allocated to each stream. For both streams information bits are coded, interleaved
and modulated according to the selected MCS. The two symbol streams obtained
after STTD encoding are then split into K parallel streams corresponding to K
spreading codes. In the last stage the streams are combined, scrambled and transmitted.
6.10.4.3 Other proposed MIMO algorithms
Besides PARC and DSTTD-SGRC six other MIMO algorithms are proposed in [23].
Since most of these schemes are not as well-documented as PARC and DSTTD-SGRC
they are introduced here only very briefly.
In Rate-Control Multi-Paths Diversity (RC-MPD) each data stream is transmitted
from at least two antennas and the number of data streams is equal to the number of
transmit antennas. Furthermore, a pair of data streams that share the same two
antennas apply the same MCS. The basic idea is to transmit another copy of the
signal after a 1 chip delay by using STTD encoding. Hence, if there are two
antennas, two data streams and the corresponding symbols are s
1
and s
2
, then the
transmitted signal consists of symbols s
1
and s
2
at time T and symbols Às
Ã
2
and s
Ã
1
at
time T þT
C
where T
C
is the chip interval. The aim in the method is to achieve multi-
path diversity that is orthogonalised through STTD encoding.
The single-stream closed-loop MIMO is a four-antenna extension of the two-antenna
closed-loop mode 1 that is supported by Release ’99 standards – it was introduced in
Section 6.9. There are tw o basic problems with this method. First, only a single data
stream is supported limiting achievable peak data rates. Second, for the phase reference
four common pilots instead of two are needed. This leads to backward incompatibilit y
with previous standard releases.
Per-User Unitary Rate Control (PU
2
RC) is based on the singular value decom-
position of MIMO channels. In this method transmit weights are computed based on
the unitary matrix that is a combination of the selected unitary basis vector from all
mobile terminals. The aim is to utilise multi-user diversity on top of MIMO
transmission.
In Transmit Power Ratio Control for Code Domain Successive Interference Cancella-
tion (TPRC for CD-SIC) the receiver is characterised by the code domain successive
interference canceller. The goal is to suppress the impact of code domain interference in
addition to space–time interference. System performance is further boosted by
employing the so-called ‘code domain transmit power ratio control’ that requires
additional feedback signalling.
The aim of the Selective PARC (S-PARC) is to improve the performance of
conventional PARC. This is done by improving the feedback format of conventional
PARC. Performance gains are expected especially when the number of receive antennas
is smaller than the number of transmit antennas or SNR is low.
Finally, in Double Transmit Antenna Array (D-TxAA) the data stream is split into
two sub-streams and each sub-stream is transmitted from two antennas by applying
either one of the closed-loop methods according to Release ’99. Hence, the total
number of transmit antennas is four. Again the same common pilot problem as in
the case of single-stream closed-loop MIMO is faced.
366 Radio Network Planning and Optimisation for UMTS
Various performance results for the above-mentioned candidate algorithms have
been presented during the 3GPP standardisation process. However, since there is no
wide agreement concerning the mutual ranking of the candidate algorithms and even
simulation assumptions are under consideration, no performance results are shown
here.
6.10.5 MIMO in UTRA FDD Uplink
So far, MIMO discussions in 3GPP have focused on HSDPA. However, when new
services such as videophones become more popular, it is extremely important to reach
high spectral efficiency in the uplink direction as well. Furthermore, if multi-antenna
mobiles are deployed for HSDPA, it is important to study the gain of multiple transmit
antennas in the uplink.
In the UTRA framework, the feasibility of different MIMO methods varies between
the uplink and downlink. While intra-cell users in the downlink are separated by
different orthogonal channelisation codes, and the capacity is limited by the shortage
of channelisation codes, in the uplink, different users are separated by long scrambling
codes, and a single user may use the entire family of orthogonal channelisation codes.
Transmit power control is an inherent characteristic of the asynchronous WCDMA
uplink. Due to non-orthogonality of the users’ channelisation codes multi-user inter-
ference cannot be avoided. Accurate transmit power control is indispensable to uplink
performance and should be taken into accoun t when designing MIMO algorithms.
In [29] simple diversity and information MIMO approaches were studied assuming
the UTRA FDD fram ework. Results show that the uplink coverage and capacity of the
UTRA FDD mode are significantly increased by SIMO and MIMO. While the
performance increase from additional BS antennas reflects to coverage and capacity
results straightforwardly, the transmit diversity gain from addition al antennas at the
mobile end is relatively small. This is due to the fact that link-level power control
converts the increased diversity to a decrease in required transmission power. On the
contrary, if user bit rates higher than 2 Mbps are needed, the gain from information
MIMO is large, because heavy code puncturing can be avoided. Thus, multiple transmit
antennas should be used in the mobile terminal for spatial multiplexing rather than for
transmit diversity. Furthermore, the simplest information MIMO algorithms only
require minor changes to the present UTRA FDD specifications.
6.11 Beamforming
Whereas higher order receive diversity improves uplink performance and transmit
diversity improves downlink performance, beamforming improves both uplink and
downlink performance. If the antenna array has between two and eight elements,
uplink receive diversity provides approximately the same uplink gains as beamforming.
However, antenna arrays with more than two elements can provide greater downlink
gains than those provided by transmit diversity. This is a result of spatial filtering,
which confines downlink interference to a limited angular spread. The choice of
whether to use beamforming or higher order receive diversity combined with
Coverage and Capacity Enhancement Methods 367
transmit diversity is dependent upon the specific radio environment as well as the
maturity of each technology.
6.11.1 Mathematical Background
Directing a beam in a particular direction can be achieved using a phased array
antenna. A common solution is the uniform linear array, which adjusts the phase
shift for each antenna element such that the desired signal sums coherently at a
specific Direction of Arrival (DoA). Figure 6.13 illustrates the phase difference
between two adjacent antennas of a four-element array for a DoA . The phase shift
relative to the reference element increases linearly from element to element. Compensat-
ing for the phase shifts corresponding to a specific DoA results in coherent summation.
The phase shift at element m is a function of the inter-element spacing d,DoA and
carrier wavelength . Equation (6.7) expresses the relationship:
’
m
¼
2 Á
Á Dl
m
¼
2 Á
Áðm À 1ÞÁd Á sin ; m ¼ 1; ; M ð6:7Þ
The response vector a of an antenna array with M elements describes the complex
antenna weights for the beam directed towards DoA :
a ¼½1; expðj Á ’
1
Þ; ; expðj Á ’
M
Þ ð6:8Þ
There are two fundamental approaches to beamforming: either multiple fixed beams
or user-specific beams. Orthogonal fixed beams can be generated using the Butler
matrix, which defines the parallel sets of phase shifts associ ated with each beam.
Table 6.22 presents the phase shifts of a four-element array used to generate four
orthogonal beams.
Figure 6.14 illustrates the corresponding beam patterns with respect to a hexagonal
cell footprint. This figure takes account of the beam pattern of each individual antenna
element.
The fixed beam approach can be implemented in a relatively simple manner by
integrating analogue phase shift components into the antenna pa nel. In this case
multiple users are assigned to each beam. The user-specific approach to beamforming
368 Radio Network Planning and Optimisation for UMTS
θ
1
2 3 4
d
Antenna
element
∆
l
2
Σ
ΣΣ
Σ
Beam to
DoA of
θ
Phase
shifter
∆
l
3
Figure 6.13 Geometry of a uniform linear array for a planewave in the direction of arrival .
is more complex and requires a separate response vector to be assigned to each mobile
terminal.
6.11.2 Impact of Beamforming
Table 6.23 presents a set of link-level simulation results comparing the uplink perform-
ance gains for a range of antenna configu rations. The beamforming results correspond
to the fixed beam approach rather than the user-specific beam approach. The 4 þ4
configuration implies two sets of four beams separated by polarisation diversity. The
gain is presented in terms of a reduction in E
b
=N
0
requirement relative to two-branch
receive diversity. E
b
=N
0
reductions improve both coverage and capacity in the uplink
direction.
The gain is relatively insensitive to the DoA of the mobile terminal – i.e., whether it is
towards the centre of a beam or between two beams. This is a result of the angular
diversity gain being at a maximum between two beams while the beamforming gain is at
a maximum in the direction of a beam. In the Pedestrian A environment which exhibits
only two delay spread components, the fixed eight-beam approach performs no bette r
than four-branch MRC.
Coverage and Capacity Enhancement Methods 369
-80 -60 -40 -20 0 20 40 60 80
-35
-30
-25
-20
-15
-10
-5
0
Orthogonal Butler Beams
Azimuth angle [degrees]
Relative amplitude [dB]
Cell boundary
Figure 6.14 Beam pattern of a four-element array based upon the Butler matrix of Table 6.22.
Table 6.22 Phase shifts ’
m
for the 4 Â 4 Butler matrix.
Antenna element d
Beam d 12 34
[
][
][
][
]
10À135 À270 À405
20À45 À90 À135
3 0 45 90 135
4 0 135 270 405
Beamforming provides spatial filtering of down link transmit power towards the
desired mobile terminal. Spatial filtering provides two benefits. First of all transmit
power can be reduced by the gain of the antenna array. For example, in an ideal
scenario a four-antenna array provides an array gain of 4 and the transmit powers
can be reduced by a corresponding factor of 4. The second benefit of spatial filtering is
the reduction in interference between users associated with different beams. This allows
a significant increase in the number of users supported.
The physical layer performance of the WCDMA downlink is dependent upon the
mobile terminal’s ability to accurately estimate the channel impulse response and
measure the received SIR. In the case of single transmit antenna configurations, the
3GPP specifications define a reliable phase reference in terms of the P-CPICH. When an
operator deploys fixed beam beamforming Secondary CPICHs (S-CPICHs) are used to
provide a separate and reliable phase reference for each beam. It is possible to evaluate
the downlink beamforming gains based upon the mobile terminal’s reception of
CPICHs [15].
Table 6.24 presents a set of simulation results for a macro-cell environment as a
function of the BS antenna configuration and the angular spread of the radio
environment. The angular spread at the BS antenna array has been modelled as a
Laplacian distribution. The gains have been evaluated by averaging over all
azimuths. The results indica te that beamforming provides an effective technique for
improving downlink performance, especially in environments with low angular spread.
6.11.3 Practical Considerations
The requirements of beamforming techniques have been taken into account throughout
the standardisation of WCDMA. The fixed beam approach is more mature than the
user-specific beam approach. Fixed beams are usually generated by analogue phase
shifters. In the case of user-specific beamforming, a different beam points in the
370 Radio Network Planning and Optimisation for UMTS
Table 6.23 Reduction in uplink E
b
=N
0
requirements provided by fixed beam beamforming and
four-antenna MRC relative to the E
b
=N
0
requirement of a two-branch receiver for a 12.2 kbps
speech service with a BLER of 1%.
Antenna configuration Modified Vehicular A Pedestrian A
3 km/h 50 km/h 120 km/h 3 km/h
[dB] [dB] [dB] [dB]
4-antenna MRC
a
3.0 2.5 2.3 5.9
8 beams
b
4.9 5.2 5.1 5.9
8 beams
c
4.4 4.9 4.8 5.8
4 þ4 beams
b
5.5 5.7 5.9 7.0
4 þ4 beams
c
4.4 4.3 4.5 6.0
a
Uncorrelated antennas.
b
Mobile terminal direction of arrival towards the maximum beam gain, eight RAKE fingers.
c
Mobile terminal direction of arrival between two beams, eight RAKE fingers.
direction of each mobile terminal. User-specific beamforming necessitates the use of the
pilot sequence within the Dedicated Physical Control Channel (DPCCH), which
reduces link performance by 2–3 dB relative to when using the P-CPICH. The power
of the DPCCH can be varied, but excessive powers lead to inefficient use of downlink
transmit power and a corresponding loss in capacity. User-specific beamforming can be
implemented either fully digitally or as a hybrid analogue/digital solution.
The WCDMA specification favours adoption of the fixed beam approach. Reasons
include the following:
. Mobile terminal functions are well-specified. Beam-specific S-CPICHs can be
exploited allowing standard channel impulse response and SIR estimation
algorithms to be used.
. Primary and secondary scrambling codes can be assigned across the beams
belonging to a cell. This helps alleviate the issue of limitations in the channelisation
code tree.
. One or more downlink shared channels can be assigned to each beam to help improve
packet scheduling for shared channels. This can lead to improved trunking efficiency.
. The impact upon RRM functionality is minimal.
The fixed beam approach is also attractive because of its strong physical layer
performance and reasonable mobile terminal complexity requirement. The largest
drawback with the user-specific approach is the increase in complexity an d the
requirement for non-standard functionality. In addition, the specification for user-
specific beamforming does not support transmit diversity and there is a relatively
large impact upon RRM functions. Finally, the fact that user-specific beamforming
does not provide significant performance gains over the fixed beam approach
means that the fixed beam approach is likely to be the preferred technique for
WCDMA.
A significant advantage of beamforming is that the antenna array can be constructed
within a single antenna radome. The relatively high gain of the array means that the
vertical dimensions of the antenna panel can be reduced while maintaining service
coverage and system capacity performance.
Coverage and Capacity Enhancement Methods 371
Table 6.24 Reduction in downlink E
b
=N
0
requirement associated with
fixed beam beamforming relative to a cell configured with a single
transmit element.
Antenna Angular spread
configuration
2
6
10
20
[dB] [dB] [dB] [dB]
Two-beam 2.2 2.2 2.1 1.8
Four-beam 5.1 5.0 4.5 3.7
Six-beam 6.9 6.3 5.8 4.5
Eight-beam 8.8 8.0 7.0 5.2
6.11.4 Impact of Fixed Beam Approach upon Radio Resource
Management Algorithms
The spatial filtering that is characteristic of beamforming means that the loading per
beam varies as a function of the azimuth distribution of the traffic and multiple access
interference. Mobile terminals using high data rate services tend to generate a non-
uniform spatial traffic and interference distribution. The admission control and load
control schemes should recognise when cell loading is non-uniformly distributed and
react accordingly.
The conventional power-based admission control algorithms used with standard
sectorised sites can be modified to cope with the fixed beam configuration ([16]–[18]).
Power-based admission control algorithms monitor received interference power as well
as BS transmit power. Users are granted access to the system if both the receiver
interference floor and the BS transmit power are below certain pre-defined
thresholds. In the case of power-based admission control with fixed beam beamforming
a new user is granted access if the angular power distribution remains satisfactory – i.e.,
the total BS power and interference level thresholds in each fixed beam are not
exceeded. The power increase in each beam depends upon the angular spread and
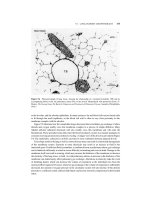
the DoA of the mobile terminal as well as the beam patterns themselves. Figure 6.15
illustrates a fixed beam antenna configuration with a new user attempting to access the
system.
If the new user is granted access to beam Pð
4
Þ then not only will the load of this
beam increase but also those of beams Pð
1
Þ, Pð
2
Þ and Pð
3
Þ. This is caused by the side
lobes of each beam leaking and receiving power across the entire cove rage area of the
cell. Figure 6.14 shows the side lobes from a four-beam antenna array. The capacity
provided by this form of admission control is greatest for uniform traffic and inter -
ference loading the cell.
372 Radio Network Planning and Optimisation for UMTS
BTS
RNC
Antenna
array
Angular spread
of signal paths
from the mobile
terminal
P(θ
1
)
P(θ
2
)
P(θ
3
)
P(θ
4
)
RNC
Angular spread
of signal paths
from the mobile
terminal
Antenna
array
BS
P ð
1
Þ
P ð
2
Þ
P ð
3
Þ
P ð
4
Þ
Figure 6.15 An illustration of the effective transmit and receive azimuth power spectrum from a
base station configured with a fixed four-beam beamforming antenna array.
6.12 Rollout Optimised Configuration
Rollout Optimised Configuration (ROC) is based upon sharing power amplifiers
between cells. Section 6.5.1 described how BS power amplifier modules can be shared
between carriers. Doing so generally reduces site capacity but also reduces the require-
ment for power amplifiers and therefore the capital expenditure associated with the BS.
For some uplink capacity limited scenarios the use of ROC may not affect system
capacity. This is dependent upon the BS transmit power requirement.
The uplink of an ROC BS appears identical to that of a standard BS – i.e., there are
separate transceiver modules for each cell. The downlink is characterised by a splitter
dividing the total downlink power between sectors. The downlink appears as a single
logical cell configured with a single scrambling code. This is a result of the same signal
being transmitted from all three sectors. The downlink antenna gain patterns effectively
combine and it is possible to receive multi-path signals from multiple antennas. The
combination of the three downlink antenna patterns needs careful consideration, since
nulls are likely to appear. Figure 6.16 illustrates the architecture of an ROC BS.
The downlink may be configured with one or tw o power amplifier modules to share
between sectors. Adding a third means that the splitter can be removed and the BS
evolves to a standard configuration. In addition, an ROC BS can be configured with
multiple carriers. Following the arguments presented in Section 6.4, BS capacity will be
greater if power amplifiers are assigned a carrier each rather than being shared across
the same carrier.
Coverage and Capacity Enhancement Methods 373
PA
to
TRX 1
to
TRX 2
to
TRX 3
to
TRX 1
to
TRX 2
to
TRX 3
TRX
Tx
Rx Rx
TRX
Tx
Rx Rx
TRX
Tx
Rx Rx
to
TRX
1
Diplexors
Spliter
1
2
3
Diplexers
Figure 6.16 Architecture of a rollout optimised configuration base station.
6.12.1 Impact of Rollout Optimised Configuration
If service coverage is uplink limited then the ROC configuration has the same service
coverage performance as a standard three-sector site – i.e., the uplink link budget does
not change and the cell range remains similar to that of a standard site configuration. If
service coverage is downlink limited then the ROC configuration is likely to have a
lower coverage performance. This is because there is less downlink transmit power
available from each sector. In interferenc e limited scenarios this has little impact
because the level of interference is also lower for a population of ROC sites but in a
thermal noise limited scenario the service coverage is reduced.
The impact upon system capacity is dependent upon whether the system is uplink or
downlink capacity limited. For downlink capacity limited scenarios, the use of an ROC
will reduce capacity as a result of the lower BS transmit power capability, although the
downlink inter-cell interference ratio is also reduced to a level comparable with that of
an omni-directional site configuration. The extent of the loss is dependent upon the
allowed propagation loss. A site planned for the 64 kbps data service and having a
relatively large allowed propagation loss wi ll incur a great er loss in capacity than a site
planned for the 384 kbps data service having a smaller allowed propagation loss.
Consider an ROC BS configured with a single 20 W power amplifier. The 20 W are
shared between the three sectors. This means that a maximum of 6.7 W are transmitted
to each sector. Typically, 0.5 W of this 6.7 W must be assigned to the P-CPICH and a
further 1 W to the Primary and Secondary Common Control Physical Channels
(P-CCPCH and S-CCPCH). Thi s results in 5.2 W being available for TCHs.
However, not all of the entire 5.2 W are useful power. The ROC configuration leads
to a significant transmission power overhead as a result of the same signal being
transmitted to all three sectors, as illustrated in Figure 6.17.
User 1 resides within a single cell and is not in softer handover. The downlink
transmit power is non-intelligently split between sectors, with no discriminating
based on the location of the user. This generates a 200% overhead. In fact only one-
third of the 5.2 W is useful TCH power. The remaining two-thirds comprises signal
power intended for users in the other two sectors.
Tables 6.25 and 6.26 compare the capacity of a conventional 1 þ 1 þ1BS
configuration with that of a 1 þ1 þ 1 ROC. Table 6.25 is based upon an allowed
propagation loss corresponding to a cell planned for the 64 kbps data service.
Table 6.26 is based upon a larger allowed propagation loss, corresponding to a cell
planned for the 12.2 kbps speech service.
374 Radio Network Planning and Optimisation for UMTS
User 1
Signal for
user 1
Signal for
user 1
Signal for
user 1
Figure 6.17 Rollout optimised configuration’s inherent downlink transmit power overhead.
Coverage and Capacity Enhancement Methods 375
Table 6.25 A comparison of the capacity associated with a conventional base station
configuration and a rollout optimised base station configuration, based upon an allowed
propagation loss of 154.4 dB.
Base station transmit power Service Downlink Uplink Downlink
capacity load load
per site
[users] [%] [%]
Conventional 1 þ1 þ1 12.2 kbps speech 233 75.5 78.1
20 W per sector 64/64 kbps data 31 50.2 75.5
(12 W total assigned to 64/128 kbps data
a
17 2.8 74.7
CPICH and CCCHs) 64/384 kbps data
a
7 1.1 75.5
ROC 1 þ1 þ1 12.2 kbps speech 84 27.3 25.8
20 W shared between sectors 64/64 kbps data 11 16.8 23.1
(4.5 W assigned to 64/128 kbps data
a
6 0.9 22.3
CPICH and CCCHs) 64/384 kbps data
a
2 0.4 23.1
ROC 1 þ1 þ1 12.2 kbps speech 134 43.4 41.0
40 W shared between sectors 64/64 kbps data 17 27.3 37.5
(9 W assigned to 64/128 kbps data
a
10 1.5 37.6
CPICH and CCCHs) 64/384 kbps data
a
4 0.6 37.5
a
Includes an activity factor ratio of 1 : 10 for uplink-to-downlink traffic channel activity.
Table 6.26 Comparison of the capacity associated with a conventional base station
configuration and a rollout optimised base station configuration, based upon an allowed
propagation loss of 156.6 dB.
Base station transmit power Service Downlink Uplink Downlink
capacity load load
per site
[users] [%] [%]
Conventional 1 þ1 þ1 12.2 kbps speech 202 65.5 67.8
20 W per sector 64/64 kbps data 27 42.9 64.5
(12 W total assigned to 64/128 kbps data
a
15 2.4 64.4
CPICH and CCCHs) 64/384 kbps data
a
6 0.9 64.5
ROC 1 þ1 þ1 12.2 kbps speech 56 18.0 17.0
20 W shared between sectors 64/64 kbps data 7 11.0 15.0
(4.5 W assigned to 64/128 kbps data
a
4 0.6 14.1
CPICH and CCCHs) 64/384 kbps data
a
1 0.2 15.0
ROC 1 þ1 þ1 12.2 kbps speech 95 30.7 29.0
40 W shared between sectors 64/64 kbps data 12 19.0 26.1
(9 W assigned to 64/128 kbps data
a
7 1.1 25.9
CPICH and CCCHs) 64/384 kbps data
a
2 0.4 26.1
a
Includes an activity factor ratio of 1 : 10 for uplink-to-downlink traffic channel activity.
These tables demonstrate the principles described in Section 6.4 – i.e., that as the
allowed propagation loss increases the downlink capacity bec omes dominated by the
BS transmit power capability rather than the level of downlink loading. This means the
BS runs out of power before reaching the ‘elbow’ in the exponential rise in interference
floor. When the cell range is small the elbow in the exponential is reached before the BS
runs out of power and the subsequent sharp increase in interference floor means that
the BS runs out of power relatively independentl y of its transmit power capability.
Table 6.25 illustr ates the fact that when planning for 64 kbps uplink coverage the
20 W ROC configuration’s capacity is $35% of the conventional configuration.
Table 6.26 illustrates that when the cell range is increased the capacity becomes more
sensitive to the BS transmit power capability and the 20 W ROC configuration has a
capacity of approximately 25% of the conventional configuration.
The results for the 40 W ROC configuration demonstrate that larger allowed
propagation loss figures lead to greater relative increases in capacity as the transmit
power is increased. It is evident that the cell capacity of an ROC BS is almost always
downlink capacity limited. The only result that indicates the possibility of an uplink
capacity limited system is the speech row for the 40 W ROC configuration. In this case
the uplink loading figures are 43.4% and 30.7%. This means that if the radio network
has been planned for 30% loading and the traffic is dominated by speech users then the
cell capacity will be uplink limited. In this case, there is no loss in capacity by using the
ROC configuration compared with the conventional configuration. This makes the
ROC configuration particularly applicable to rural scenarios where the network has
been planned for a relatively low uplink cell load.
6.12.2 Practical Considerations
The antenna sub-system and cabinet requirements for an ROC BS are similar to those
of a standard BS with the addition of a splitter to divide the downlink power between
sectors. This chapter focused upon describing a three-sector ROC configuration. The
same principle may be applied to any number of sectors. Two-sector ROC sites are
often appropriate providing coverage along roads. The reduced cost of ROC BSs must
be balanced against the relatively low capacity and the need for future upgrades.
6.13 Sectorisation
The term ‘sectorisation’ refers to increasing the number of sectors belonging to a site.
Sectorisation is used primarily as a technique to increase system capacity, although
service coverage is generally improved at the same time. This is a result of the increased
antenna gain associated with more directional antennas. Antenna selection is a critical
part of planning for increa sed sectorisation. Levels of inter-cell interference and soft
handover overhead must be carefully controlled. For example, upgrading a three-sector
site to a six-sector site does not involv e simply rigging an additional three antennas but
also changing the original three. For this reason it is useful to plan the requirement for
high sectorisation during initial system rollout. It may be advantageous to deploy
376 Radio Network Planning and Optimisation for UMTS
highly sectorised configurations during initial rollout to reduce the requirement for
subsequent upgrades.
Increasing the number of sectors at a BS places a greater requirement upon the
quantity of hardware required within the BS cabinet. In general, doubling the
number of sectors will require twice as many transceiver modules, twice as many
power amplifier modules and twice as much baseband processing capability. If the
site uses multiple carriers and multi-carrier power amplifiers, the existing transmit
power may be shared across carriers. For example, a 2 þ2 þ 2 site configured with
dedicated 20 W multi-carrier power amplifiers for each carrier of each cell can be
upgraded to a 2 þ 2 þ2 þ 2 þ 2 þ2 configuration without increasing the requirement
for power amplifier modules. The existing six power amplifiers may be shared across the
carriers belonging to each cell, such that 10 W are available to each carrier in each cell.
The configurations associated with various degrees of sectorisation are presented in
Table 6.27.
6.13.1 Impact of Sectorisation
The most important factor influencing the system performance of a sectorised site is the
choice of antenna. To a large extent this determines the levels of inter-cell interference,
soft handover overhead and any changes in the maximum allowed propagation loss.
System capacity is directly affected by all three. Service coverage is affected by changes
in the maximum allowed propagation loss. Table 6.28 presents a set of typical figures
for the sectorisation of both macro-cells and micro-cells.
Micro-cell sectorisation does not normally exceed two sectors. Antennas must be
placed with extreme care to ensure adequate isolation between cells. The nature of
micro-cellular radio propagation means that simply pointing antennas in different
directions is not sufficient to ensure clearly defined dominance areas with adequate
inter-cell isolation.
In the case of macro-cells, it is common to consider up to six sectors per site. As the
level of sectorisation increases then so too does the associated antenna gain and level of
inter-cell interference. Antenna side lobes are also likely to be greater for more
directional antennas. The soft handover overhead should be maintained at approxi-
mately 30% with the help of the relevant RRM parameters – e.g., defining the active set
size and soft handover window.
Coverage and Capacity Enhancement Methods 377
Table 6.27 The application of various levels of sectorisation.
Level Application
1 sector Micro-cell or low capacity macro-cell
2 sectors Sectored micro-cell or macro-cell providing roadside coverage
3 sectors Standard macro-cell configuration providing medium capacity
4 or 5 sectors Not commonly used but may be chosen to support a specific traffic scenario
6 sectors High capacity macro-cell configuration
Tables 6.29 and 6.30 present typical downlink capacity figures per site. Uplink load is
also presented to illustrate which scenarios are more likely to be uplink capacity limited.
The level of downlink load is provided to indicate whether the BS is running out of
transmit power due to high levels of system load ( >80%) or simply as a result of the
number of users combined with the allowed propagation loss. In the latter case,
capacity may be increased by increasing BS transmit power capability.
378 Radio Network Planning and Optimisation for UMTS
Table 6.29 Impact of sectorisation upon site capacity, based on an allowed propagation loss of
154.4 dB corresponding to the 64 kbps uplink data service for the 1 þ 1 þ1 configuration.
Base station transmit Service Downlink Uplink Downlink
power capacity load load
per site
[users] [%] [%]
Omni 20 W 12.2 kbps speech 83 75.4 76.5
64/64 kbps data 11 50.0 73.8
64/128 kbps data
a
6 2.8 74.1
64/384 kbps data
a
2 1.0 73.8
1 þ 1 þ1 20 W per cell 12.2 kbps speech 233 75.5 78.1
64/64 kbps data 31 50.2 75.5
64/128 kbps data
a
17 2.8 74.7
64/384 kbps data
a
7 1.1 75.5
1 þ 1 þ1 þ1 þ 1 þ 1 20 W per cell 12.2 kbps speech 410 75.7 80.7
64/64 kbps data 55 50.5 78.4
64/128 kbps data
a
31 2.8 78.6
64/384 kbps data
a
12 1.1 78.4
a
Includes an activity factor ratio of 1 : 10 for uplink-to-downlink traffic channel activity.
Table 6.28 Typical antenna, inter-cell interference and soft handover overhead assumptions for
various levels of sectorisation.
Cell type Level of Typical antenna Typical inter-cell Typical soft
sectorisation beamwidth interference handover
and gain ratio overhead
[sectors] [
/dBi]
Micro-cell 1 65/12.0 25% 20%
2 65/12.0 Scenario- Scenario-
dependent dependent
Macro-cell 1 360/6.0 55% 30%
2 90/16.5 60% 40%
3 65/18.5 65% 40%
4 or 5 65/18.5 75% 40%
6 33/21.0 85% 40%
In each case, increasing the sectorisation from a single sector to three sectors leads to
a capacity increase in the order of 2.8. Similarly, increasing the sectorisation from three
sectors to six sectors leads to a capacity gain of approximately 1.8. Decreasing the cell’s
maximum allowed propagation loss means that more users can be supported before the
BS runs out of transmit power. This is due to relatively low levels of downlink load as
shown in Table 6.29. Table 6.30 indicates higher levels of downlink load. In this case,
further reducing the allowed propagation loss or increasing the BS transmit power will
not increase site capacity. Here, capacity can only be increased by enhancing some
parameters within the downlink load equation – i.e., reducing the E
b
=N
0
requirement
or reducing inter-cell interference. The uplink load column illustrates the fact that when
the traffic profile is dominated by speech or symmetric data services, there is a high
likelihood of site capacity being uplink limited.
6.13.2 Practical Considerations
Deploying highly sectorised sites requires a correspondingly high quantity of hardware
in terms of both the antenna sub-system and modules to be fitted within the BS
cabinet. A single-carrier 6-sector site taking advantage of dual-branch receive
diversity requires 6 crosspolar antennas, 12 runs of feeder cable, potentially 12 MHAs,
6 transceiver modules, 6 power amplifier modules and a significant quantity of
baseband processing capability. Configuring an additional carrier at the site would
require another 6 transceiver modules, potentially another 6 power amplifiers and
Coverage and Capacity Enhancement Methods 379
Table 6.30 Impact of sectorisation upon site capacity, based on an allowed propagation loss of
149.6 dB corresponding to the 384 kbps uplink data service for the 1 þ 1 þ1 configuration.
Base station transmit Service Downlink Uplink Downlink
power capacity load load
per site
[users] [%] [%]
Omni 20 W 12.2 kbps speech 99 89.5 90.8
64/64 kbps data 14 60.7 89.5
64/128 kbps data
a
8 3.4 89.3
64/384 kbps data
a
3 1.3 89.5
1 þ 1 þ1 20 W per cell 12.2 kbps speech 273 88.3 91.3
64/64 kbps data 37 59.9 90.1
64/128 kbps data
a
21 3.4 90.1
64/384 kbps data
a
8 1.3 90.1
1 þ 1 þ1 þ1 þ 1 þ 1 20 W per cell 12.2 kbps speech 471 86.9 92.7
64/64 kbps data 65 59.1 91.6
64/128 kbps data
a
36 3.3 90.7
64/384 kbps data
a
14 1.2 91.6
a
Includes an activity factor ratio of 1 : 10 for uplink-to-downlink traffic channel activity.
twice as much baseband processing. If the power amplifiers are multi-carrier then it is
feasible to share the original 6 modules between the 2 carriers with some loss in
capacity. In some cases the additional transceiver s an d power amplifiers may require
a second BS cabinet. Alternatively, standard transceiver modules can be upgraded to
double-transceiver modules and 20 W power amplifier modules can be upgraded to
40 W modules.
6.14 Repeaters
Repeaters may be used to enhance or extend an area of existing macro-cell coverage.
The repeater coverage area may be either an outdoor or indoor location. Repeaters are
generally connected to their donor cell via a directional radio link. Using a directional
radio link helps to provide favourable performance in terms of maximising antenna
gain and minimising any interference and multi-path effects. In some cases an optical
link may be used to connect the repeater to the donor cell. Repeaters are transparent to
their donor cell, which is able to operate without needing to know whether or not a
repeater is present. Inner-, outer- and open-loop power control algorithms are able to
function transparently through the repeater. The main benefits of a repeater solution
are the low cost and ease of installation. An important consideration when deploying a
repeater for macro-cell coverage is configuring uplink and downlink repeater gains. The
majority of repeaters allow configuring uplink and downlink gains independently.
Downlink gain is typically configured relatively high to maximise the downlink
coverage of the repeater. If uplink gain is also configured high then the donor cell
may be desensitised by the thermal noise floor of the repeater. A repeater’s uplink
gain should usually be about 10 dB less than the link loss between the repeater and
the donor cell. If the difference between uplink and downlink gains becomes too great
then there is likely to be an impact upon soft handover performance. There is thus a
requirement to balance the tradeoff between repeater coverage, donor cell desensitisa-
tion and soft handover performance. Multiple repeaters can be daisy-chained to extend
areas of coverage beyond that feasible using a single repeater, but the inserted delays
put a practical upper limit on the number of repeaters in a chain. Figure 6.18 illustrates
the concept of using a repeater.
In general, digital repeaters have the advantage of allowi ng the received signal to be
cleaned before retransmission by making hard decisions on the bit stream. In the case of
380 Radio Network Planning and Optimisation for UMTS
WCDMA
Base Station
WCDMA
Repeater
Same logical cell
Figure 6.18 The concept of using a repeater.
WCDMA repeaters, the repeater cannot clean the bit stream unless it first applies
scrambling and channelisation codes. The repeat er has no knowledge of either of
these and is forced to simply amplify the received signal plus noise in the same way
as an analogue repeater. A comparison of the various types of repeater is illustrated in
Figure 6.19.
Passing the WCDMA signal through two receiver sub-systems plus an additional
transmitter degrades signal quality. This impacts directly upon the receiver E
b
=N
0
requirement and indirectly upon system capacity and service coverage performance.
If the system capacity is uplink limited then the capacity will be degraded by the
repeater. If the system capacity is downlink limited then the impact upon capacity
will depend upon the link budget between the donor cell and the repeater, the
transmit power capability of the repeater, the allowed propagation loss between the
mobile terminal and the repeater and the distribution of the traffic between the donor
cell and the repeater. The majority of WCDMA BSs have dual-branch receive diversity
whereas many repeaters do not have this functionality. This results in an increased fast
fading margin and a greater uplink E
b
=N
0
requirement. This further impacts upon the
link budget for the coverage area of the repeater as well as the uplink capacity of the
donor cell.
Soft handover does not occur between the donor cell and the repeater. This is because
both belong to the same logical cell and transmit the same downlink signal with the
same scrambling code. Mobile terminals located within the boundary area between the
donor cell and the repeater may incur high levels of multi-path generated by the two
sources of downlink transmission power and a corresponding loss in channelisation
code orthogonality. Table 6.31 presents a typical specification for a WCDMA repeater.
Similar to the donor cell, the downlink transmit power must be sufficient to support
the capacity requirements of the TCHs while reserving an allocation for the CPICH and
Coverage and Capacity Enhancement Methods 381
Analogue
Repeater
Noisy amplified
signal
Noisy received
signal
Digital
Repeater
Clean amplified
signal
Noisy received
signal
WCDMA
Repeater
Noisy amplified
signal
Noisy received
signal
Figure 6.19 A comparison of analogue, digital and WCDMA repeaters.
Table 6.31 Typical specification for a WCDMA repeater.
Downlink Uplink Delay Uplink Size Weight
transmit transmit noise
power power figure
5.00 W 0.25 W 5 ms 3 dB 50 cm Â40 cm Â30 cm 25 kg
CCCHs. Repeaters introduce a delay in both uplink and downlink directions in the
order of 5ms. This delay is small enough – relative to the period of a slot (667 ms) – to be
transparent to the performance of the inner-loop power control.
6.14.1 Impact of Repeaters
Repeaters are used primarily for extending the coverage area of an existing cell. The
link budget performance of the donor cell remains unchanged. A second set of link
budgets must be completed for the coverage area of the repeater. These link budgets are
likely to be quite different from that of the donor cell. The parameters most likely to
differ include E
b
=N
0
requirement, receiver NF, antenna gain, cable loss and fast fading
margin. Table 6.32 describes how these parameters may differ between the donor cell
and the repeater. In addition, the difference between repeater gain and repeater-to-
donor cell link loss should be accounted for within the link budgets. The combined
effect of these parameters is likely to result in a lower maximum allowed propagation
loss for the repeater when compared with the donor cell.
The impact of a repeater upon system capacity depends upon whether capacity is
uplink or downlink limited. If it is uplink limited, there will be a loss of capacity by
using a repeater. This is a direct result of the increased uplink E
b
=N
0
requirement for
those users linking to the donor cell via the repeater. The increased requiremen t
depends largely upon whether or not the repeater benefits from receive diversity.
Table 6.33 illustrates a typical loss in capacity when introducing a repeat er to an
uplink capacity limited cell.
In the case that system capacity is downlink limited, both the downlink load equation
and downlink link budgets must be considered. The downlink link budgets include that
of the donor cell as well as that of the repeater and the directional radio link between
donor cell and repeater. The users linked to the donor cell via the repeater will have an
increased E
b
=N
0
requirement. This will increase the downlink loading of both the
repeater and the donor cell. The increase in downlink cell loading will tend to
decrease system capacity. In addition, the users located at the boundary area
between the donor cell and repeater are likely to incur high levels of multi-path and
382 Radio Network Planning and Optimisation for UMTS
Table 6.32 Differences between link budgets of donor cell and repeater.
Factor Difference
Uplink E
b
=N
0
requirement Repeater requires increased E
b
=N
0
, especially if it does not benefit
from receive diversity
Receiver noise figure Depends upon the repeater’s receiver design
Receiver antenna gain Depends upon scenario. Repeaters used to extend coverage along
a road may use directional antennas
Feeder loss Depends upon scenario
Fast fading margin Repeater requires increased margin, especially if it does not
benefit from receive diversity
a corresponding loss of channelisation code orthogonality. This will also tend to
increase downlink cell load and decrease system capacity. However, users linked to
the donor cell via the repeater require a relatively low share of BS power as a result
of the favourable link budget provided by the repeater gain and the directional radio
link between donor cell and repeater.
6.14.2 Practical Considerations
Repeaters are often chosen for their low cost and ease of installation, requiring a
minimum of configuration. They don’t require any additional transmission links
towards the controlling RNC. Their only requirement is a power supply. Repeaters
are most applicable in scenarios where there is sufficient power to amplify and where
there is relatively clear cell dominance.
6.15 Micro-cell Deployment
The coverage and capacity requirements within urban and dense urban environments
lead directly to high site densities. Micro-cells become an attractive solution in terms of
relative ease of site acquisition, increased air interface capacity and more efficient
indoor penetration. Micro-cells may be realised by one of two generic BS solutions –
either a dedicated micro-cell product or a macro-cell product with micro-cellular
antenna placement. The dedicated micro-cell product provides the benefits of relative
ease of installation and low cost. The macro-cell product provides the benefits of
increased transmit power and baseband processing capability. Both solutions can
support multiple carriers and multiple cells, although micro-cellular sectorisation is
significantly more difficult than that for macro-cells. Both solutions are generally
able to support dual-branch uplink receive diversity. Table 6.34 provides a
comparison of the two solut ions.
Coverage and Capacity Enhancement Methods 383
Table 6.33 Impact upon uplink capacity in terms of speech users when a repeater is added to a
cell planned for 30% uplink loading.
Service E
b
=N
0
requirement E
b
=N
0
requirement Uplink
for users connected for users connected capacity per
to donor cell via the repeater cell
a
[dB] [dB] [users]
Three-sector site without repeater 4 — 30
Three-sector site with repeater
benefiting from receive diversity 4 5 28
Three-sector site with repeater not
benefiting from receive diversity 4 6 24
a
Assuming an equal share of traffic between repeater and donor cell and no change in inter-cell interference
when a repeater is included.
Table 6.34 A comparison of micro-cell solutions.
Dedicated micro-cell product Macro-cell product with below
rooftop antennas
Cabinet Compact, wall-mounted cabinet Full-sized base station cabinet
Transmit power Typically 8 W Typically 10 W, 20 W or 40 W
Hardware limitations Moderate processing capability High processing capability
Cost Low cost Relatively high cost
6.15.1 Impact of Micro-cells
The propagation channel associated with a micro-cellular radio environment has a
significant impact upon the air interface performance of a micro-cell solution. Micro-
cellular propagation usually has a strong line-of-sight component with relatively weak
multi-path, leading to high downlink orthogonality and correspondingly reduced intra-
cell interference. The low intra-cell interference means that loading is more sensitive to
inter-cell interference. However, the typical below-rooftop positioning of micro -cells
leads to good inter-site isolation, and inter-cell interference is generally less than that
for macro-cells. Good inter-site isolation also helps to manage the soft handover
overhead. Table 6.35 presents the main differences between macro-cell and micro-cell
capacity-related parameters.
Both the uplink and downlink micro-cell E
b
=N
0
requirements are greater than those
for a macro-cell. This tends to decrease uplink and downlink air interface capacities.
The increased E
b
=N
0
requirement is primarily a result of increased fading across the
radio channel. This also impacts upon the coverage-related fast fading margin on the
uplink. The increase in E
b
=N
0
requirement is relatively large on the downlink as a result
of the downlink figure including a contribution from the fast fading margin. The uplink
increase in inter-cell interference is also greater for micro-cells. This figure combines
with the inter-cell interference ratio in the uplink load equation to increase the level of
inter-cell interference. For a macro-cell the resultant inter-cell interference is
0.65 þ1dB¼0.82 and for a micro-cell is 0.25 þ2dB¼0.40. The micro-cell’s resultant
uplink inter-cell interference remai ns significantly lower. The decrease in inter-cell
384 Radio Network Planning and Optimisation for UMTS
Table 6.35 Comparison of macro-cell and micro-cell capacity-related parameters.
Macro-cell Micro-cell
Uplink E
b
=N
0
(12.2 kbps speech)
a
4 dB 4.5 dB
Increase in inter-cell interference 1 dB 2 dB
Downlink E
b
=N
0
(12.2 kbps speech) 6.5 dB 9.5 dB
Downlink orthogonality 0.5 0.9
Inter-cell interference ratio 0.65 0.25
Soft handover overhead 40% 20%
a
Assumes dual-branch receive diversity for both macro-cell and micro-cell.
interference combined with the increase in downlink channelisation code orthogonality
and decrease in soft handover overhead leads to a net increase in system capacity.
Table 6.36 provides a comparison of macro-cell and micro-cell capacity, assuming
both are equipped with 20 W power amplifier modules. The speech service scenario is
uplink capacity limited and the difference between the macro- and micro-cell capacities
is relatively small – approximatel y 10%. The 64/64 kbps data service is downlink
capacity limited for the macro-cell and uplink capacity limited for the micro-cell.
This results in an intermediate capacity gain of approximately 55%. The remaining
data services are downlink capacity limited for both the macro-cell and micro-cell
scenarios and the capacity gain is 100%. Including downlink transmit diversity as
part of the micro-cell solution further increases system capacity for the downlink
capacity limited scenarios. The capacity increase is in the order of 70% beyond that
of the micro-cell without transmit diversity and in the order of 350% beyond that of the
macro-cell.
In practice it is common for micro-cells to have a lower transmit power. Table
6.37 presents the corresponding micro-cell capacities for a transmit power capability
of 8 W.
Reducing the micro-cell transmit power to 8 W results in a loss in capacity. The loss is
greatest for the downlink capacity limited scenarios.
Tables 6.36 and 6.37 present air interface capacities but take no account of the
limitations of the downlink channelisation code tree. Table 6.38 presents these limita-
tions for a micro-cellular environment.
Coverage and Capacity Enhancement Methods 385
Table 6.36 A comparison of macro-cell and micro-cell capacities, based upon a macro-cell
allowed propagation loss of 152.2 dB and a micro-cell allowed propagation loss of 144.7 dB
(64 kbps uplink link budget with 70% loading) and 20 W assigned to both macro-cells and
micro-cells.
Service Capacity Uplink Base station
per cell load transmit power
requirement
[users] [%] [dBm]
Macro-cell without 12.2 kbps speech 72 70.0 40.4
transmit diversity 64/64 kbps data 11 52.8 42.1
64/128 kbps data
a
6 2.9 41.6
64/384 kbps data
a
2 1.0 40.4
Micro-cell without 12.2 kbps speech 79 69.9 39.8
transmit diversity 64/64 kbps data 17 66.3 40.7
64/128 kbps data
a
12 4.7 42.4
64/384 kbps data
a
4 1.6 41.4
Micro-cell with 12.2 kbps speech 79 69.9 37.2
transmit diversity 64/64 kbps data 17 66.3 38.7
64/128 kbps data
a
18 7.0 42.7
64/384 kbps data
a
7 2.7 42.0
a
Includes an activity factor ratio of 1 : 10 for uplink-to-downlink traffic channel activity.
Comparing these figures with those presented in Tables 6.36 and 6.37 indicates that
the availa bility of downlink channelisation codes may become a limitation for the
128 kbps and 384 kbps data services when the micro-cell is equipped with 20 W of
transmit power and downlink transmit diversity. In these cases a second scrambling
code may be introduced to provide a second channelisation code tree. However, this
code tree will not be orthogonal to the first and its users will generate relatively large
increments in downlink cell loading.
Micro-cell capacity can be increased by adding carriers or sectors in a similar fashion
to macro-cells. The performance of sectorisation is, however, significantly more
sensitive than that for macro-cells. If the sectors are not well-planned they are not
likely to have clearly defined dominance areas and will incur high levels of inter-cell
interference.
In terms of service coverage performance, micro-cells provide an effective solution for
achieving a high degree of indoor penetration. Cell ranges tend to be smaller as a result
of the below-rooftop antenna location and the relatively high gradient of the associated
path loss characteristic. Table 6.39 presents the main differences between macro-cell
and micro-cell coverage-related link- and system-level parameters.
386 Radio Network Planning and Optimisation for UMTS
Table 6.37 Micro-cell capacities when assigned 8 W of transmit power capability, based upon an
allowed propagation loss of 144.7 dB (64 kbps uplink link budget with 70% loading).
Service Capacity Uplink Base station
per cell load transmit power
requirement
[users] [%] [dBm]
Micro-cell without 12.2 kbps speech 79 69.9 38.8
transmit diversity 64/64 kbps data 15 58.5 39.0
64/128 kbps data
a
8 3.1 38.7
64/384 kbps data
a
3 1.2 38.7
Micro-cell with 12.2 kbps speech 79 69.9 35.1
transmit diversity 64/64 kbps data 17 66.3 37.3
64/128 kbps data
a
13 6.4 38.7
64/384 kbps data
a
5 1.9 38.9
a
Includes an activity factor ratio of 1 : 10 for uplink-to-downlink traffic channel activity.
Table 6.38 Micro-cell traffic channel limitations of a single channelisation code tree.
a
Downlink bit rate Air interface bit rate Spreading factor Number of possible TCHs
[kbps] [kbps]
12.2 60 128 104
64 240 32 25
128 480 16 12
384 960 8 5
a
C
ch;256;0
used for the CPICH; C
ch;256;1
used for the P-CCPCH; C
ch;64;1
used for the S-CCPCH; C
ch;256;2
used
for the AICH; and C
ch;256;3
used for the PICH. Based upon a soft handover overhead of 20%.
The uplink link budget of a micro-cell is characterised by an increased E
b
=N
0
requirement and an increased fast fading margin. This results in a lower maximum
allowed propagation loss. The downlink link budget is characterised by an increased
E
b
=N
0
requirement. Micro-cells configured with 8 W of transmit power capability and
supporting asymmetric data services are likely to be downlink coverage limited.
Adjacent channel performance must also be considered when planning the
deployment of micro-cells. The possibility of a low minimum coupling loss between
the micro-cell antenna and users on the adjacent channel results in potentially harsh
near–far effects. When the adjacent channel is being used by a second operator, near–
far effects are significantly reduced if the second operator also uses that channel to
deploy micro-cells.
6.16 Capacity Upgrade Process
There is a requirement for operators to have a process which allows them to identify
when a capacity upgrade is necessary. This process should ensure that upgrades are
completed prior to the network experiencing increased levels of connection blocking.
However, the process should not be triggered too early otherwise it will result in
operators increa sing their capital expenditure sooner than necessary. Capacity
upgrades, which involve changes to the network hardware are generally relative ly
expensive and should only be completed when necessary. It may be possible to
increase system capacity and avoid a capacity upgrade by completing optimisation of
the existing resources. Optimisation should always be completed prior to completing a
capacity upgrade. Figure 6.20 illustrates an example capacity upgrade process.
RNC counters and Key Performance Indicators (KPIs) are typically used to trigger
the capacity upgrade process. Operators should collect and monitor these data on a
regular basis. For example, the data could be studied at the end of every week. The data
should be recorded with a relatively high time resolution to avoid averaging peaks in
traffic demand. If the time resolution becomes too high then the quantity of data
becomes unmanageable. It is typical to use a time resolution of either 15 minut es or
1 hour. This time resolution may be greater than that used for other counters and KPIs
recorded from the network. The KPIs should allow operators to evaluate whether or
not system capacity limits are being approached. KPIs should be defined to quantify all
aspects of system capacity. Example aspects of system capacity are uplink DPCH
Coverage and Capacity Enhancement Methods 387
Table 6.39 Comparison of macro-cell and micro-cell coverage-
related parameters.
Macro-cell Micro-cell
[dB] [dB]
Uplink E
b
=N
0
(12.2 kbps speech) 4 4.5
Uplink fast fading margin 3 5
Downlink E
b
=N
0
(12.2 kbps speech) 6.5 9.5