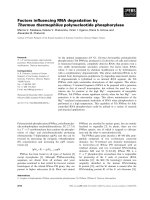
Báo cáo sinh học: " Factors influencing the efficiency of a marker-assisted introgression programme in Merino sheep" ppt
Bạn đang xem bản rút gọn của tài liệu. Xem và tải ngay bản đầy đủ của tài liệu tại đây (269.25 KB, 17 trang )
Genet. Sel. Evol. 39 (2007) 495–511 Available online at:
c
INRA, EDP Sciences, 2007 www.gse-journal.org
DOI: 10.1051/gse:2007017
Original article
Factors influencing the efficiency
of a marker-assisted introgression
programme in Merino sheep
Sonja D
a,c∗
, John H
a,c
, Julian O’G
a,c
,
Karen M
b,c
a
CSIRO Livestock Industries, Armidale, Australia
b
Department of Animal Science, University of New England, Armidale, Australia
c
Australian Sheep Industry CRC, Armidale, Australia
(Received 1st September 2006; accepted 12 March 2007)
Abstract – This study investigated a marker-assisted introgression programme in Australian
Merino sheep. The goal was to introgress an allele with a large negative effect on fibre di-
ameter into a Merino flock possessing medium average fibre diameter. The influence of two
factors was explored: the strategy used to select animals from the purebred and backcross line
for backcrossing purposes and the use of selection on background markers to accelerate the
return to the purebred line’s genome. The results were compared to introgression based on
EBVs only. Introgression using EBVs only produced almost the same response in the dollar
index as marker-based introgression methods. However, this study did not account for some
of the costs associated with implementing the programmes, including the costs of phenotyping
and genotyping. Given that the cost of measuring fibre diameter is low, it was concluded that
introgression on EBVs only would be the preferred method since the marginal profit of marker-
assisted introgression would not be large enough to cover the additional cost of genotyping.
In marker-assisted introgression, reciprocal crossing of male and female selection candidates
from the backcross and the purebred line was the most advantageous strategy from a practical
and profit point of view. Selection for background markers was less profitable in this study than
recovering the donor genome by selection on phenotype.
marker-assisted introgression / Merino sheep / sheep breeding
1. INTRODUCTION
The process of introgression in the field of animal breeding describes the
transfer of a favourable allele of a gene from a donor line of animals into a
purebred line that does not carry this allele. The first step of an introgression
∗
Corresponding author:
Article published by EDP Sciences and available at
or />496 S. Dominik et al.
programme is to cross a purebred line with a donor line. In the following gen-
erations, the crossbred animals that are heterozygous for the favourable allele
are backcrossed to the purebred line to increase the proportion of the genome
of the purebred line. Marker-assisted introgression (MAI) is applied with the
same intent. However, through the use of molecular markers that are linked
to the favourable allele, carriers can be identified and the accuracy of selec-
tion of the appropriate breeding animals is increased compared to phenotypic
selection.
To date, marker-assisted introgression has not been widely commercially
applied in the sheep industry. Genetic markers are available for major genes
that influence fertility and carcass characteristics in sheep (e.g. the Booroola
gene [13] and Callipyge gene [5]), but because of their extreme phenotypic
expression, they are not widely applied in breeding programmes. In general,
there is a paucity of highly accurate genetic markers linked to genes that influ-
ence economically important characteristics in sheep. Currently, there is only a
small number of published QTL for fibre diameter and other wool production
and quality characteristics [1, 2, 8–10, 12].
Factors influencing the efficiency of MAI programmes in livestock have
been discussed by a number of authors. In the case of a situation concerning
pig breeding, Visscher and Haley [15] concluded that a genetic lag between the
purebred line and the introgression line occurs during the backcrossing pro-
cess. As method to reduce the genetic lag, they proposed selection on markers
that cover the purebred line’s genome. This strategy was found to accelerate
the recovery of the purebred line’s background genes and reduce the required
number of years of backcrossing.
A study by van der Waaij and van Arendonk [14] focused on an MAI pro-
gramme in cattle. In agreement with Visscher and Haley [15], they found that
the number of backcross generations impacts on the genetic difference be-
tween the introgressed and purebred line. Visscher et al. [16] further concluded
that the use of reproductive technologies has an effect on the number of back-
cross generations, as does the initial difference in trait expression between the
donor and recipient line. They concluded that the maximum genetic advantage
of the introgressed line differs from the maximum economic advantage [16].
The degree of divergence is likely to differ between species due to variation
in constraints (such as fecundity) and to variation in economic factors. This
highlights the importance of assessing introgression programmes in species-
specific breeding programmes that include the relevant economic background
in the evaluation.
Marker assisted introgression in Merino sheep 497
MAI could provide a useful breeding strategy for the Australian Merino
industry. The production aims of the Australian Merino industry are geograph-
ically differentiated due to differences in production environments and to in-
dustry beliefs regarding sheep survival, wool production and quality. In recent
years, research has shown that moving to fine wool production in areas, which
have previously produced medium wool has positive effects on wool enter-
prise returns with no major adverse effects on wool quality [7]. This is due to
the higher average premium paid for fine wool. If Merino producers in tradi-
tional medium to strong wool production areas decide to produce sheep with
finer wool, MAI could be considered as a potential breeding tool to reduce
the mean average diameter without compromising clean fleece production, if
genetic markers were available.
The aim of this study was to explore factors influencing genetic and eco-
nomic gain in MAI programmes using stochastic computer simulation based
on a realistic Australian wool sheep industry scenario. Two aspects concerning
the backcross generation were investigated: first, the effect of different back-
crossing strategies on the economic gain in MAI programmes and second,
the effect of selection on background markers to recover the purebred line’s
genome as quickly as possible. The results were compared with introgression
based on EBVs only.
2. MATERIALS AND METHODS
2.1. Simulation study
2.1.1. General background
The scenario that serves as background for this study assumed that an allele
with a large negative effect on fibre diameter is introduced from a fine wool
Merino donor line into a medium wool Merino purebred line. This allele can be
identified through genetic markers that are closely linked. Different breeding
and selection strategies were individually evaluated for their results in the last
year (year 20) of an introgression programme. The comparison of the results
was based on the difference in profit between the introgression product and the
initial purebred line due to the difference in performance in fibre diameter (FD)
and fleece weight (CFW). Technological costs for genotyping and advanced
reproduction were not accounted for.
Fifty repetitions of the computer simulation were run for each of the breed-
ing strategies. Each repetition comprised 20 years of flock breeding. In our
study, the allele effect size of the QTL equals one micron and the QTL does
498 S. Dominik et al.
Purebred
MW
Donor
F
W
F1
Backcross
Fixed
On
g
oin
g
within flock selection
Purebred
MW
Intercross
Part 1
Purebred and
donor line
(5 years)
Part 2
Backcross
line
(8 years)
Part 3
Fixed
line
(7 years)
Figure 1. Breeding structure for the simulation study – introgression by using a
donor/fine wool line (donor
FW
) and a purebred recipient line/medium wool line
(purebred
MW
).
not have any effect on other traits. The QTL effect with 67.7% of a phenotypic
standard deviation was large in comparison to published effect sizes [1,8,10]. It
was assumed that no recombination occurred between the marker and the QTL.
Breeding values were estimated with ASREML [6] applying an animal
model that fitted birth year and line (e.g. purebred, backcross) as fixed effects.
Full pedigree information was used.
2.1.2. Breeding structure
The initial generations in the simulation were aimed at the production of a
flock with overlapping generations, a range of age classes and realistic within
flock variance structures. Each of the initial two lines (fine and medium wool)
started with a population of 500 animals and was randomly bred for 10 years.
Each year, five rams were randomly selected and mated to all available ewes.
The rams were culled after two years and ewes after five years. This process
provided a starting population of around 1250 animals.
Figure 1 schematically outlines the general breeding structure that was ap-
plied in this study, broken down into three parts. The numbers of male and
female selection candidates in the different parts and lines of the breeding
structure are summarised in Table I.
In Part 1, the breeding structure comprised two lines of sheep: a fine
wool Merino donor line, which is homozygous for the favourable allele with
Marker assisted introgression in Merino sheep 499
Tabl e I. Number of males and females selected each year in the purebred
MW
, back-
cross and fixed line in the breeding structure of the introgression program.
Line Sire line Dam line Backcross Nb of Nb of
strategy males females
Purebred
MW
Purebred
MW
Purebred
MW
5 250
F1 Donor
FW
Purebred
MW
155
Backcross Backcross Purebred
MW
Strategy 1 1 70
Purebred
MW
Backcross (reciprocal) 1 50
Backcross Purebred
MW
Strategy 2 1 120
Purebred
MW
Backcross Strategy 3 1 120
Intercross Backcross Backcross 1 55
Fixed Fixed Fixed 2
a
50
a
a
These numbers increase with increasing number of selection candidates.
anegativeeffect on fibre diameter, and a medium wool Merino purebred
line (purebred
MW
), which is homozygous for the unfavourable allele. In the
purebred
MW
line, the breeding programme was based on within flock selection
on EBVs for fleece weight and fibre diameter. Rams and ewes were culled at
four and seven years of age, which resulted in a larger proportion of females.
Each year, five rams and 250 ewes were selected. In the next step, a first cross
(F1 generation) between the two lines was produced, which was 100% het-
erozygous for the favourable allele.
In Part 2, the breeding structure contrasts the purebred
MW
line with the
“backcross line”. The establishment of the backcross line involved eight years
of backcrossing animals to the purebred
MW
line. This process aimed at recov-
ering the purebred line’s genome.
In Part 3, a so-called “fixed line” was produced. The fixed line is the out-
come of an intercross between backcross animals that results in a proportion
of progeny that are homozygous for the favourable allele. These enter the fixed
line, and the success of the programme can be evaluated by comparing these
to the purebred
MW
line. Selection on production traits was conducted by using
the same index in all lines (details are described in Sect. 2.4).
2.1.3. Genetic and phenotypic parameters
The stochastic computer simulation was based on literature estimates [3,11]
of genetic and phenotypic parameters for fibre diameter (FD) and clean fleece
weight (CFW) in the fine wool (donor
FW
) and medium wool (purebred
MW
)
500 S. Dominik et al.
Table II. Means, phenotypic and genetic variances (V
p
and V
a
) for fine and medium
wool Merino sheep for clean fleece weight (CFW) and fibre diameter (FD) [3, 10].
Fine wool Merino sheep Medium wool Merino sheep
CFW FD CFW FD
Mean 2.5 kg 17 µm 4 kg 22 µm
V
a
0.02 0.77 0.16 1.55
V
p
0.06 1.13 0.37 2.18
Table III. Genetic and phenotypic parameters for fine and medium wool Merino sheep
for clean fleece weight (CFW) and fibre diameter (FD) – heritabilities in bold, phe-
notype correlations (r
p
) above the diagonal and genetic correlations (r
g
)belowthe
diagonal [3, 11].
Fine wool Merino sheep Medium wool Merino sheep
CFW FD CFW FD
CFW 0.29* 0.20* 0.42 ± 0.02 0.25 ± 0.03
FD 0.14* 0.68* 0.31 ± 0.03 0.71 ± 0.02
* No standard errors available.
Merino flocks. The estimates and industry representative means and variances
are summarised in Tables II and III.
Genetic and phenotypic variances for CFW and FD differ between medium
and fine wool sheep populations. A polygenic component of the genetic vari-
ances for all lines was simulated using variance component estimates from
fine wool sheep. The higher means and genetic variances in medium wool
sheep were assumed to be due to the action of a finite number of genes, each
with two alleles and with additive gene action (i.e. no dominance effect was
simulated).
For each gene, base animals in the fine wool population were simulated as
homozygous for the allele of negative effect, so these genes did not contribute
to the genetic variance in that line. In the base animals for the medium wool
population, the alleles were simulated at a frequency of 0.5, resulting in both
higher means and higher genetic variances in this line. Two classes of allelic
substitution effects are required to account for the correlation structures. The
number of genes required and allele substitution effects were derived using
formulae for allele effects [4]. These are summarised in Table IV.
Marker assisted introgression in Merino sheep 501
Tabl e IV. Allelic substitution effect (α) on FD and CFW for a specified number of
genes (n).
α
class1
α
class2
n9 9
CFW −0.00898 0.176096
FD 0.368099 0.192687
The following equations describe the components of the phenotypic vari-
ances of the base animals of the fine and medium wool line:
V
p
= V
aFW
+ V
Genes
+ V
e
(1)
V
Genes
=
n1
i=1
2pqα
2
1
+
n2
i=1
2pqα
2
2
, (2)
where V
p
is the phenotypic variances for the fine or medium wool line and
V
aFW
is the gene variance of the fine wool line (Tab. II), V
Genes
is the variance
due to allele substitution effects (α
1
and α
2
) of a specified number of genes
(n1 and n2) (Tab. IV) at frequency p (p = 0 for fine wool, p = 0.5 for medium
wool and q = 1 − p), V
e
is the error variance for the fine or medium wool
line (Tab. II).
The error variances for crossbred animals were assigned using a linear in-
terpolation, with the variance dependent on the proportion of medium wool
ancestry, as outlined below:
V
eBC
= V
eFW
+ π × (V
eMW
− V
eFW
), (3)
where V
eBC
is the error variance in the backcross line, V
eFW
and V
eMW
are
the error variances for the fine wool and medium wool line (Tab. II), π is the
proportion of medium wool ancestry.
2.1.4. Economic parameters
Historical data on the sale price of wool from 1992 to 2003 were used to
estimate revenue as a function of fleece weight and fibre diameter. Expenses
were assumed to increase linearly with decreasing fleece weight. Under the
assumption that the index used in industry (80% emphasis on fleece weight,
20% on fibre diameter) is optimal, an equation for profit in dollars per sheep
as a function of fibre diameter was derived:
Profit = CFW × (2123.446 − 90 × FD). (4)
502 S. Dominik et al.
Although the profit function is non-linear and the variance components differ
between the fine and medium wool lines and are not constant in the backcross
line, a constant 80:20 ratio for selection emphasis on fleece weight and fibre
diameter was used to select parents in the simulation studies.
2.2. Breeding strategies
Within the general breeding structure described in Section 2.1.1., different
crossing strategies were applied in the backcross line (Part 2, Fig. 1). Figure 2
summarises the different strategies.
Three different backcross strategies were considered where males and fe-
males are sourced from either of the lines. In general, selection of animals
from purebred
MW
for within-flock breeding takes priority over selection for
backcrossing. Strategy 1 was a reciprocal cross between males and females
from the purebred line with males and females from the backcross line. In
Strategy 2 all males were selected from the backcross line and all females from
the purebred
MW
line. Selection of females from the purebred
MW
was restricted
to the genetically second best animals because the best were used for flock re-
placement of the purebred
MW
line. Strategy 3 reversed the concept and males
were selected from the purebred line and mated to backcross line females. The
genetically best males from purebred
MW
can be used through artificial insemi-
nation. However, Strategy 3 can only be applied in combination with multiple
ovulation embryo transfer (MOET) because of the low number of females with
the appropriate genotype available for selection.
2.3. Methods of selection
2.3.1. Selection on BLUP breeding values
Selection on BLUP breeding values is a means of introgressing the
favourable allele without the use of genetic markers, by assuming that the
breeding values account for the QTL effect. The aim is to investigate the ef-
ficiency with which selection on EBVs alone increases the frequency of the
favourable allele. The scenario where selection is based on EBVs alone is sub-
sequently referred to as “BLUPonly”.
2.3.2. Marker assisted introgression
In making selection decisions in MAI, phenotype and pedigree data are aug-
mented by the information on the genotype that an animal carries at marker loci
Marker assisted introgression in Merino sheep 503
Figure 2. Schematic representation of the components of the simulation strategies: selection of males (|)andfemales(~) from
backcross (BC) and purebred
MW
(PB
MW
) (Strategy 1–3), selection on markers linked to the QTL, selection on background markers and
selection indices.
504 S. Dominik et al.
that are linked to the QTL. The MAI scenario in this study describes a special
case of marker and QTL relationship, where there is no recombination be-
tween the marker and the QTL. Selection candidates that are heterozygous for
the favourable genotype at the marker loci are selected as parents of the next
generation. Therefore truncation selection was the first selection step based
on the zygosity status for the QTL, followed by selection decisions based on
performance in the 80:20 trait index.
2.3.3. Marker assisted introgression plus background marker selection
Selection on markers that are linked to genes from the medium wool line can
have a favourable effect on the speed with which medium wool background
genes accumulate and can reduce the number of required backcrosses [15]. In
order to simulate the effect of background marker selection it is necessary to
make some assumptions regarding the distribution of genes affecting the traits
of interest over the genome. For this study, the following simple approach was
taken i.e. simulating 18 line specific markers at recombination rates of 5% from
the 18 finite locus genes described in Section 2.1.3. Each of the strategies of
backcrossing was simulated with and without selection on background mark-
ers. In the selection process, first truncation selection was performed based
on the zygosity status for the QTL, with only heterozygous animals being se-
lected. For the background marker, the second selection step was to select the
animals with the largest proportion of markers of medium wool ancestry. Trait
index performance, which is based on phenotype and pedigree, was only con-
sidered when animals were equal for a proportion of background markers.
3. RESULTS
3.1. Base scenario – Purebred medium wool line
The purebred medium wool line serves as a base line comparison for the
outcome of the MAI process in the fixed line. Figure 3 shows the progress
in FD, CFW and profit over the 15 years, starting in year 6 of the breeding
programme. Year 6 of the breeding programme is the first dot on the right. At
the beginning of the breeding programme (result not shown), the purebred
MW
line had wool with a FD of 22 µm and 4 kg CFW, which returned $5.72 per
sheep. Selection caused an almost linear increase in CFW and profit and a
linear decrease in FD. By year 14 of the breeding programme, which is the
first year in which a comparison with the fixed line becomes possible, CFW
Marker assisted introgression in Merino sheep 505
6
7
20
18
19
17
16
15
14
13
12
8
9
10
11
18.0 18.5 19.0 19.5 20.0 20.5 21.0
Fibre diameter (µm)
Greasy fleece weight (kg)
4.0 4.5 5.0 5.5 6.0
$12
$14
$16
$18
$20
$24
Figure 3. Progress of within flock selection in the purebred
MW
line in FD and CFW
over 15 years, starting at the production of the F1 cross (year 6), plotted across curves
of the same profit (iso-economic curves).
had increased to 5.14 kg and FD reduced to 19.3 µm. These changes increased
profit by $13.87 per sheep compared to the first year. In the last year of the
purebred breeding programme CFW reached 5.48 kg, FD 18.11 µm and profit
increased by a further $7.43 per sheep to $27.02.
3.2. Comparison of MAI to BLUPonly
Selection in the backcross generation based on EBVs alone was tested for
its impact on profit. All MAI breeding strategies of backcrossing were ex-
plored without background marker selection. Figure 4 shows the results from
“BLUPonly” across backcross Strategy 1 to 3 in comparison to the backcross
strategies evaluated with MAI. The results are presented as difference in profit
in dollar between the purebred medium wool line and the evaluated introgres-
sion strategy. Overall BLUPonly performed worse than the MAI scenarios.
506 S. Dominik et al.
0
1
2
3
4
5
6
7
8
9
10
11
12
1234567
Year
Difference in profit ($ per sheep)
MAI
BLUP
Figure 4. Comparison of the best of the three backcross strategies (Strategy 1 /,Strategy2/,Strategy3/) with MAI (contin-
uous line) and of selection on BLUP breeding values only (BLUPonly) (broken line).
Marker assisted introgression in Merino sheep 507
The best BLUPonly scenario yielded $2.50 less than the least profitable MAI
scenario in the final year of the breeding programme. The best MAI strat-
egy was $5.26 better than the best BLUPonly, however that result was found
for Strategy 3, which would involve MOET. For the second best MAI, which
was Strategy 1, the difference with BLUPonly was $3.02. The most profitable
BLUPonly scenario, which was based on backcross Strategy 1, resulted in
$4.57 more profit per sheep than within flock selection in the purebred
MW
line.
The least profitable scenario for BLUPonly with backcrossing Strategy 2 had
only an advantage of $1.16 over the purebred
MW
line. Backcross Strategies 1
and 3 performed similar in BLUPonly.
3.3. Impact of different strategies in the backcross generation
The impact of three different backcrossing strategies on the profitability of
the MAI process was investigated. Strategy 1 selected males and females from
both the medium wool line and the backcross line for reciprocal crosses, Strat-
egy 2 sourced females from the medium wool line and males from the back-
cross line and Strategy 3 did the reverse. Figure 5 shows the difference between
the medium purebred and fixed line across all the different backcross strategies.
All MAI scenarios yielded more profit than within flock selection in the
purebred
MW
line; therefore all profit curves have positive values. Across all
backcrossing strategies, with or without background marker selection, Strat-
egy 3 was on average the most profitable option followed by Strategy 1, with
Strategy 2 being the least profitable. Strategy 3 consistently yielded more profit
per sheep in the last year of the breeding programme than the other strategies
and Strategy 1 was more profitable than Strategy 2.
3.4. Background marker selection
The scenarios with and without background marker selection are shown in
Figure 5. In general, the inclusion of background markers has a negative effect
on the profit per sheep compared to scenarios without background marker se-
lection. On average, scenarios without background marker selection produced
$5.62 more profit than scenarios with background selection the last year of
the breeding programme. Strategies 1 and 2 did not perform very differently
with background marker selection. Furthermore, Figure 5 shows that the three
strategies performed similarly in the beginning with background marker selec-
tion, whereas without, the effect of the backcrossing strategy caused a marked
difference.
508 S. Dominik et al.
0
1
2
3
4
5
6
7
8
9
10
11
12
1234567
Year
Difference in profit ($ per sheep
)
No B
G
BG selection
Figure 5. Mean difference in profit as fixed line – purebred
MW
line expressed as cents per sheep across three backcross strategies
(Strategy 1 /,Strategy2/,Strategy3/) with background marker selection (broken line and empty markers – BG selection)
and without (continuous line and filled markers – no BG).
Marker assisted introgression in Merino sheep 509
4. DISCUSSION
MAI will become an important breeding tool in the sheep industry when
genetic marker technology reaches the commercial level. Currently, there are
no studies available that examine factors affecting performance of MAI pro-
grammes in the case of a situation concerning sheep breeding. This study in-
vestigated two factors and their interactions that influence the backcross gen-
eration of an MAI breeding programme and therefore the overall success: first
the selection strategy in the purebred and the backcross line and second the op-
tion of selecting on background markers covering the purebred line’s genome.
Finally, the results were compared to the genetic and economic progress of
an introgression programme that bases selection decisions solely on estimated
breeding values.
For the situation modelled in this study, selection on BLUP breeding values
without using QTL information was competitive with a marker assisted intro-
gression programme. Cost for genotyping and reproductive technologies were
not taken into account in this study, but the margin gained through introgres-
sion based on markers and MOET was low compared to the cost that would
have to be spent on the technologies involved. Overall, introgression based on
the use of estimated breeding values yielded less profit than MAI, however,
the difference between the approaches indicated a maximum allowable cost
for genotyping and reproductive technologies. Current commercially available
gene tests for cattle are approximately $85 per animal and an estimate for sin-
gle nucleotide polymorphism (SNP) or microsatellite marker genotyping is at
around $1 per marker. Compared to this, the margin in profit of MAI over
BLUPonly of $3.02 to $5.27 is comparably small.
In this study, it was assumed that trait records for fibre diameter were avail-
able for all animals. Since the cost of measuring fibre diameter is small com-
pared to the cost of genotyping, BLUPonly is probably the preferred strategy.
This may be reversed for traits that are more expensive to measure.
The factor causing the most influence on the different backcrossing strate-
gies in the MAI breeding programme was the availability of genetically su-
perior animals for the backcrossing process. The availability of females for
backcrossing from the purebred line was restricted because the use of females
for production of replacement animals within the flock was given priority. The
number of females in the backcross line was limited since only half were het-
erozygous for the QTL. Selection of males is unrestricted in either of the lines
because the required numbers are low and artificial insemination allows the
parallel use of sires for within flock breeding and backcrossing. The strat-
egy that uses males from the purebred line through artificial insemination and
510 S. Dominik et al.
females from the backcross line is the most profitable strategy, but practically
expensive because advanced reproductive technologies are required. There-
fore, a reciprocal cross of the backcross and the purebred line, would offer the
highest overall return.
Several authors [15, 16] have investigated the effect of background marker
selection to return to the purebred line’s genome. In contrast with the con-
clusions in these studies, where background selection is advantageous, in our
study, response was worse with background marker selection. There are a num-
ber of possible explanations for this. In our study, the QTL explained only a
proportion of the differences between the lines for fibre diameter, with the re-
mainder due to loci at which the favourable allele is at a higher frequency in
the donor population. Background selection discriminates against these alle-
les, while BLUP EBV, as a secondary selection criterion after QTL genotypes,
exploit this variance. This is particularly the case for class 1 alleles where there
is no increase in fleece weight when selecting for the medium wool alleles but
an increase in fibre diameter (Tab. IV). Consequently, selection on background
markers was associated with unfavourable polygenic trait responses and the
scenario as considered in this simulation study did not benefit from selection
on background markers. It might be possible to improve this by reducing the
emphasis on background selection, possibly estimating the appropriate weight
from the observed regression of phenotype on proportion of medium wool al-
leles.
In conclusion, this study evaluated strategies of marker assisted introgres-
sion, and showed that selection on BLUP breeding values can be almost as
effective for introgression of a favourable allele of a gene in a sheep breed-
ing system. However, a well-implemented marker assisted introgression pro-
gramme can provide greater control and accuracy of selection and may offer
other logistical advantages to a breeding programme. It may also offer consid-
erable advantages where the trait affected by the QTL is difficult or expensive
to measure.
ACKNOWLEDGEMENTS
The work reported here was financially supported by the Australian Sheep
Industry CRC.
REFERENCES
[1] Allain D., Schibler L., Mura L., Barillet F., Sechi T., Rupp R., Casu S., Cribiu E.,
Carta A., QTL detection with DNA markers for wool traits in a sheep backcross
Marker assisted introgression in Merino sheep 511
Sarda × Lacaune resource population, Proc. 8th World Congr. Genet. Appl.
Livest. Prod., 13–18 August 2006, Belo Horizonte, Brazil.
[2] Bidinost F., Roldan D.L., Dodero A.M., Cano E.M., Taddeo H.R., Mueller J.P.,
Poli M.A., Quantitative trait loci related to Merino sheep quality, Proc. 8th World
Congr. Genet. Appl. Livest. Prod., 13–18 August 2006, Belo Horizonte, Brazil.
[3] Cloete S.W.P., Greeff J.C., Lewer R., Direct and maternal genetic (co)variances
for hogget live weight and fleece traits in Western Australian Merino sheep,
Aust. J. Agric. Res. 53 (2002) 271–279.
[4] Falconer D.S., Mackay T.F.C., Introduction to quantitative genetics, Longman
Group Ltd., England (1996).
[5] Gilmour A.R., Thompson R., Cullis B.R., ASREML, Biometrics Bulletin No. 3
(1998).
[6] Gootwine E., Zenou A., Bor A., Yossafi S., Rosov A., Pollott G.E., Introgression
of the callipyge mutation into the Assaf fat tail breed, Options Méditerranéennes
Série A, Séminaires Méditerranée 55 (2002) 125–131.
[7] Hatcher S., Atkins K., Swan A.A., Purvis I.W., Does translocating sheep between
environments affect wool production and wool quality of Merino wethers? Aust.
Assoc. Anim. Breed. Genet. 13 (1999) 106–109.
[8] Henry H.M., Dodds K.G., Wuliji T., Jenkins Z.A., Beattie A.E., Montgomery
G.W., A genome screen for QTL for wool traits in a Merino × Romney backcross
flock, Wool Tech. Sheep Breed. 46 (1998) 213–217.
[9] Parson Y.M, Cooper D.W., Piper L.R., Evidence of linkage between high-
glycine-tyrosine keratin gene loci and wool fibre diameter in a Merino half-sib
family, Anim. Genet. 25 (1994) 105–108.
[10] Ponz R., Moreno C., Allain D., Elsen J.M., Lantier F., Lantier I., Brunel J.C.,
Perez-Enciso M., Assessment of genetic variation explained by markers for wool
traits in sheep via a segment mapping approach, Mamm. Genome 12 (2001)
569–572.
[11] Purvis I.W., Franklin I.R., Major genes and QTL influencing wool production
and quality: a review, Genet. Sel. Evol. 37 Suppl. 1 (2005) 97–101.
[12] Purvis I.W., Swan A.A., Can follicle density be used to enhance the rate of
genetic improvement in Merino flocks? Aust. Assoc. Anim. Breed. Genet. 12
(1997) 512–515.
[13] Southey B.R., Thomas D.L., Gottfredson R.G., Zelinsky R.D., Ewe productivity
of Booroola Merino-Rambouillet crossbred sheep during early stages of intro-
gression of the Fec(B) allele into a Rambouillet population, Livest. Prod. Sci. 75
(2002) 33–44.
[14] van der Waaij E.H, van Arendonk J.A.M., Introgression of genes responsible
for disease resistance in a cattle population selected for production: genetic and
economic consequences, Anim. Sci. 70 (1999) 207–220.
[15] Visscher P.M., Haley C.S., On the efficiency of marker-assisted introgression,
Anim. Sci. 68 (1999) 59–68.
[16] Visscher P., Pong-Wong R., Whittemore C., Haley C., Impact of biotechnology
on (cross)breeding programmes in pigs, Livest. Prod. Sci. 65 (2000) 57–70.