Báo cáo y học: "Genome-scale evidence of the nematode-arthropod clade" pps
Bạn đang xem bản rút gọn của tài liệu. Xem và tải ngay bản đầy đủ của tài liệu tại đây (705.25 KB, 10 trang )
Genome Biology 2005, 6:R41
comment reviews reports deposited research refereed research interactions information
Open Access
2005Dopazo and DopazoVolume 6, Issue 5, Article R41
Research
Genome-scale evidence of the nematode-arthropod clade
Hernán Dopazo
*
and Joaquín Dopazo
†‡
Addresses:
*
Pharmacogenomics and Comparative Genomics Unit, Bioinformatics Department, Centro de Investigación Príncipe Felipe,
Autopista del Saler 16, 46013 Valencia, Spain.
†
Functional Genomics Unit, Bioinformatics Department, Centro de Investigación Príncipe Felipe,
Autopista del Saler 16, 46013 Valencia, Spain.
‡
Functional Genomics Node, INB, Centro de Investigación Príncipe Felipe, Autopista del Saler
16, 46013 Valencia, Spain.
Correspondence: Joaquín Dopazo. E-mail:
© 2005 Dopazo and Dopazo; licensee BioMed Central Ltd.
This is an Open Access article distributed under the terms of the Creative Commons Attribution License (
which permits unrestricted use, distribution, and reproduction in any medium, provided the original work is properly cited.
Genome-scale evidence for the nematodes-arthropods clade<p>The most extensive phylogenetic analysis carried out to date, including 11 complete genomes, is shown to support the Ecdysozoa hypothesis in the open-ended debate of the Coelomata-Ecdysozoa evolutionary problem.</p>
Abstract
Background: The issue of whether coelomates form a single clade, the Coelomata, or whether
all animals that moult an exoskeleton (such as the coelomate arthropods and the pseudocoelomate
nematodes) form a distinct clade, the Ecdysozoa, is the most puzzling issue in animal systematics
and a major open-ended subject in evolutionary biology. Previous single-gene and genome-scale
analyses designed to resolve the issue have produced contradictory results. Here we present the
first genome-scale phylogenetic evidence that strongly supports the Ecdysozoa hypothesis.
Results: Through the most extensive phylogenetic analysis carried out to date, the complete
genomes of 11 eukaryotic species have been analyzed in order to find homologous sequences
derived from 18 human chromosomes. Phylogenetic analysis of datasets showing an increased
adjustment to equal evolutionary rates between nematode and arthropod sequences produced a
gradual change from support for Coelomata to support for Ecdysozoa. Transition between
topologies occurred when fast-evolving sequences of Caenorhabditis elegans were removed. When
chordate, nematode and arthropod sequences were constrained to fit equal evolutionary rates, the
Ecdysozoa topology was statistically accepted whereas Coelomata was rejected.
Conclusions: The reliability of a monophyletic group clustering arthropods and nematodes was
unequivocally accepted in datasets where traces of the long-branch attraction effect were removed.
This is the first phylogenomic evidence to strongly support the 'moulting clade' hypothesis.
Background
Understanding the evolution of the great diversity of life is a
major goal in biology. Despite decades of effort by systema-
tists, evolutionary relationships between major groups of ani-
mals still remain unresolved. The inability to cluster taxa in
monophyletic groups was originally due to the lack of mor-
phological synapomorphies among phyla. An alternative
solution came from embryology, and animal systematics
relied on criteria based on increasing complexity of body plan
[1]. Thus, the traditional metazoan phylogeny clusters ani-
mals from the simplest basal forms with loose tissue organi-
zation (for example, sponges) to those having two germ layers
(dipoblastic animals, for example cnidarians), and those
developing from three germ layers (triploblastic animals,
such as the Bilateria - animals with bilateral symmetry). Bilat-
eral animals were ordered into those lacking a coelom (the
Published: 28 April 2005
Genome Biology 2005, 6:R41 (doi:10.1186/gb-2005-6-5-r41)
Received: 7 March 2005
Accepted: 6 April 2005
The electronic version of this article is the complete one and can be
found online at />R41.2 Genome Biology 2005, Volume 6, Issue 5, Article R41 Dopazo and Dopazo />Genome Biology 2005, 6:R41
acoelomates, such as platyhelminths), those with a false coe-
lom (the pseudocoelomates, such as nematodes), and, finally,
those animals with a true coelom (the Coelomata, such as the
arthropods and chordates). This comparative developmental
theory of animal evolution dominated animal systematics for
more than 50 years [2].
Subsequently, molecular systematic studies based on small
subunit ribosomal RNA (18S rRNA) sequences began to
undermine this scenario [1]. Put briefly, the new animal phy-
logeny suggested that clades such as acoelomates and pseu-
docoelomates are artificial systematic groups. Moreover,
although the coelomate designation still remains, this clade
now contains two new lineages: the lophotrochozoa and the
Ecdysozoa [3]. The 'Ecdysozoa hypothesis' postulated that all
phyla composed of animals that grow by moulting a cuticular
exoskeleton (such as arthropods and nematodes) originate
from a common ancestor, thus forming a distinct clade. Thus,
under the Ecdysozoa hypothesis arthropods are genetically
more closely related to nematodes than to chordates. Under
the 'Coelomata hypothesis' of animal evolution, however,
arthropods are more closely related to chordates than to
nematodes.
At the heart of this systematic debate, a technical discussion
emerged surrounding the long-branch attraction effect
(LBAE), taxon sampling, and the number of characters used.
Subsequent molecular and morphological studies have been
carried out, but the controversy remains unresolved and is
presented as a multifurcation [4]. Although the use of differ-
ent single-gene sequences supported the Ecdysozoa hypothe-
sis [5-11], the analysis of dozens to hundreds of concatenated
sequences supported the Coelomata clade [12-15]. Indeed,
with an element of caution, we favored the Coelomata
hypothesis in a previous whole-genome study designed to
determine the number of characters needed to obtain a relia-
ble topology [16]. The gene-based Ecdysozoa versus genome-
scale Coelomata alternative hypotheses were recently chal-
lenged by two phylogenomics studies that partly supported
the Ecdysozoa clade [17] and a paraphyletic Coelomata group
[18]. Although it is generally accepted that phylogenetic anal-
ysis of whole genomes has begun to supplement (and in some
cases improve on) phylogenetic studies previously carried out
with one or a few genes [19], all genome-wide phylogenetic
studies have failed to support the proposed new animal
phylogeny.
Here we present the first phylogenomic evidence that
strongly supports the Ecdysozoa hypothesis and at the same
time demonstrates that the LBAE biases the position of
Caenorhabditis elegans in the phylogenetic tree. We show
that by using a large number of characters and choosing a
phylogenetic weighted scheme of outgroups to test the con-
stancy of evolutionary rates, the new animal phylogeny can be
statistically supported. Moreover, we show that both the Coe-
lomata and the Ecdysozoa hypotheses can be supported with
the highest statistical confidence when genomic datasets are
ordered according to a gradually increased adjustment to
equal evolutionary rates between C. elegans and Drosophila
melanogaster sequences. In between, neither Ecdysozoa nor
Coelomata were sufficiently supported. To our knowledge,
this is the most extensive phylogenomic analysis carried out
to date in the number of characters and the number of
eukaryotic species involved.
Results
Dataset properties
Sequences homologous to human exon sequences were
derived from filtering tblastn search results on 11 complete
eukaryotic genomes. Because the most-criticized issue in
resolving the Ecdysozoa-Coelomata problem seems to be the
LBAE produced by the nematode species, we decided to
rearrange homologous sequences in a series of nested data-
sets that gradually reduced LBAE. Aligned homologous
sequences were arranged in eight datasets (D
i
) and concate-
nated in their corresponding matrices (M
i
) (see Materials and
methods), such that as suffix i increases, datasets and matri-
ces comprise a smaller number of homologous sequences
showing more similar relative branch lengths (RBL) between
C. elegans (L
Ce
) and D. melanogaster (L
Dm
) (Figure 1). RBL
are relative human distances.
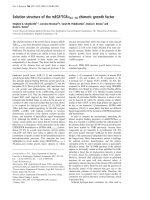
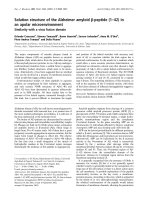
To quantify the effect on the RBL of C. elegans of concatenat-
ing alternative homologous sequences, maximum likelihood
(ML) estimates of branch length were obtained using the star-
like unrooted tree transformation for each dataset (see Mate-
rials and methods). Figure 2a shows that the RBL of C. ele-
gans over D. melanogaster decreased by approximately 30%
continuously from dataset D
1
to D
8
. To test whether the grad-
ual decrease in C. elegans branch length was enough to pro-
duce statistical confidence on equal evolutionary rates
between the nematode and the arthropod sequences, relative
rate tests using two outgroup schemes were assayed on con-
catenated sequences (see Materials and methods). Figure 2b
shows that using Saccharomyces cerevisae as the unique out-
group species (OUG1), all the individual tests on the eight
matrices failed to detect statistical deviations (at the 5% level
family-wise) between sequences. Only when the phylogeneti-
cally weighted scheme of outgroup species (OUG2) was used
did the relative rate test detect significant deviation of clock
behavior from D
1
to D
5
datasets. We are therefore confident
that the arthropod and nematode concatenated sequences of
the M
6
, M
7
, and M
8
matrices meet the desired clock-like con-
ditions to test the Coelomata and Ecdysozoa hypotheses and
exclude any artifacts derived from a possible LBAE. This
result supports previous work suggesting that the genetic dis-
tance between ingroup and outgroup modifies the power of
the relative rate test [20].
To test whether concatenated matrices carry sufficient phylo-
genetic signal, the ML mapping method was used. The
Genome Biology 2005, Volume 6, Issue 5, Article R41 Dopazo and Dopazo R41.3
comment reviews reports refereed researchdeposited research interactions information
Genome Biology 2005, 6:R41
compound posterior probability point (P) for all the possible
quartets of each M
i
matrix could be placed, with almost equiv-
alent values (approximately 33%), inside the corner areas of
the equilateral triangle probability surface (see Additional
data file 1). Thus, concatenated matrices derived from select-
ing a different number of homologous sequences contained
sufficient phylogenetic signal to represent topologies as
strictly bifurcating trees. Finally, using the Akaike informa-
tion criterion (AIC) [21], the statistical test of the best-fit
model of sequence evolution for each dataset was selected
from six different alternatives (see Materials and methods).
As all the models are not nested and share the same number
of parameters, the best one was that with the greatest log like-
lihood result. The WAG amino-acid replacement matrix [22]
adjusted for frequencies (+F), rate heterogeneity (+Γ) and
invariable sites (+I) was the best evolutionary model chosen
for all the datasets. Moreover, model-fit-data values followed
the same inequality independently of the dataset (WAG [22]
> VT [23] > BLOSUM62 [24] > JTT [25] > PAM [26] >
mtREV24 [27]), suggesting that the best models were those
that consider more distantly related amino-acid sequences.
The clade Coelomata disappears under clock
conditions
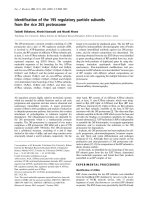
Distance and ML phylogenetic methods were used on all the
datasets (see Materials and methods). Figure 3 shows phylo-
genetic reconstructions and statistical support for the two
extreme conditions of the nested datasets. Whereas the M
1
matrix supported the Coelomata tree with the highest statis-
tical confidence, M
8
showed the same result for the Ecdysozoa
tree. Thus, by decreasing the RBL of C. elegans, the statistical
support switched from the Coelomata to the Ecdysozoa
hypothesis. Figure 4 shows that, whichever phylogenetic
method was used, C. elegans bootstrap support between
datasets and topologies changed in agreement with the grad-
ual RBL decrement. Specifically, using M
1
and M
8
(the matri-
ces showing the most extreme evolutionary rate conditions
for C. elegans and D. melanogaster sequences - from a clock-
absent to the most adjusted behavior), the statistical support
moved from Coelomata to Ecdysozoa. The same occurred
with M
2
and M
7
. Alternatively, using M
3
and M
6
, only one of
the two distance and ML methods (Figure 4a,b) provided suf-
ficient support (90% or more) to the hypothesis. Finally,
using M
4
and M
5
, only one distance method supported Coelo-
mata and Ecdysozoa with confidence. Given that datasets dif-
fered principally in the RBL of C. elegans over D.
melanogaster, the gradual change in topology strongly favors
an LBAE between C. elegans and the more basal species. To
test whether a paired-sites test [28] supports the bootstrap
conclusions, Shimodaira-Hasegawa (SH) and expected-likeli-
hood weight (ELW) tests were evaluated on the datasets (see
Materials and methods).
Figure 5 shows the assessment of paired-sites tests for the two
competing trees on all the datasets. Paired-sites tests sup-
porting topologies (p > 0.05) changed almost gradually on
datasets. Figure 5a and 5b show that the SH test is more con-
servative than the ELW [29]. Using matrices M
1
and M
2
, both
tests strongly rejected the Ecdysozoa hypothesis, whereas M
6
,
M
7
, and M
8
rejected the Coelomata tree. Interestingly, data-
sets between them did not reject any topology with sufficient
statistical evidence. We can conclude that by decreasing the
RBL of C. elegans over D. melanogaster by around 13% (Fig-
ure 2a) the LBAE favoring the Coelomata hypothesis disap-
pears and we can confirm that under strict conditions of
clock-like behavior, the Coelomata hypothesis was strongly
rejected by paired-sites tests and bootstrap support.
To test if the shortness of the evolutionary distances between
C. elegans and D. melanogaster resulting from the above fil-
tering method biased topology over the common ancestry of
arthropods and nematodes, we searched for chordate, arthro-
pod, and nematode sequences showing clock-like behavior
between them. To increase the probability of finding
sequences to fit the criteria, we focused on sequences from
the most closely related chordate to the molting species, that
is, the ascidian Ciona intestinalis. Only 14 exon sequences
met the above criteria. A relative rate test showed that the
probability of a perfect clock-like behavior was p = 0.515 for
C. elegans and D. melanogaster, p = 0.308 for C. intestinalis
and D. melanogaster and p = 0.712 for C. intestinalis and C.
elegans. The ML mapping method showed that the concate-
nation of all the 810 characters carried sufficient phylogenetic
signal in the matrix to represent a strictly bifurcating tree (see
Additional data file 2). Despite the reduced number of char-
acters, phylogenetic analysis showed significant support for
the Ecdysozoa hypothesis. Using distance and ML methods,
bootstrap values reached 97%. Moreover, the Ecdysozoa
hypothesis was accepted with a probability of p = 1.00 and p
= 0.997 when SH and ELW paired-sites tests, respectively,
were performed. Conversely, the Coelomata hypothesis was
rejected at p = 0.006 and p = 0.0023, respectively.
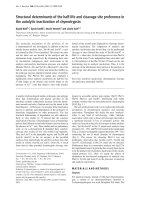
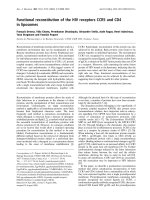
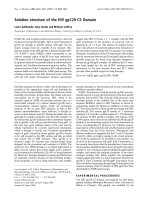
Description of the datasetFigure 1 (see following page)
Description of the dataset. D
i
datasets are arranged according to a gradual decrease in the parameter δ. δ controls the inclusion of each homologous exon
sequence in the dataset by defining margins above and below (y = x ± δ) a diagonal line (y = x) that constrains clock-like behavior in the evolution of C.
elegans and D. melanogaster sequences. L
Ce
and L
Dm
are the respective relative branch lengths of C. elegans and D. melanogaster using H. sapiens as reference.
Comma-separated values represent the number of homologous sequences and characters aligned in the M
i
concatenated matrix. D
i
contains all the
sequences without any constraint of evolutionary rates. Dotted black and red lines represent mean , and median values, respectively.
L
Ce
−
L
Dm
−
R41.4 Genome Biology 2005, Volume 6, Issue 5, Article R41 Dopazo and Dopazo />Genome Biology 2005, 6:R41
Figure 1 (see legend on previous page)
D
1
D
2
D
3
D
4
D
5
D
6
D
7
D
8
δ = 5
δ = 2.5
δ = 1.5
δ = 0.5
δ = 3
δ = 3.5
δ = 1
M
3
: 914, 43890
M
4
: 888, 42745
10
8
6
4
L
Ce
L
Dm
2
0
0246810
10
8
6
4
L
Ce
L
Dm
2
0
0246810
10
8
6
4
L
Ce
L
Dm
2
0
0246810
10
8
6
4
L
Ce
L
Dm
2
0
0246810
10
8
6
4
L
Ce
L
Dm
2
0
0246810
10
8
6
4
L
Ce
L
Dm
2
0
0246810
10
8
6
4
L
Ce
L
Dm
2
0
0246810
10
8
6
4
L
Ce
L
Dm
2
0
0246810
M
1
: 1061, 50462 M
2
: 970, 46498
M
5
: 845, 40686 M
6
: 776, 37535
M
7
: 646, 31396 M
8
: 422,20689
Genome Biology 2005, Volume 6, Issue 5, Article R41 Dopazo and Dopazo R41.5
comment reviews reports refereed researchdeposited research interactions information
Genome Biology 2005, 6:R41
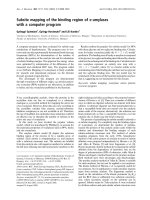
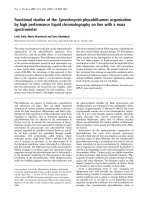
The clade Coelomata disappears by removing fast-
evolving sequences of C. elegans
In order to discard a probable biased selection of exon
sequences favoring the Ecdysozoa hypothesis, two additional
matrices were built by removing from the original dataset
(D
1
) the exons in which the C. elegans sequences evolved at a
faster rate. Figure 6 shows that by removing the fastest 15% of
total exon sequences the reliability of the Coelomata hypoth-
esis is reduced from 100% to 78%. Moreover, when the fastest
30% of all exons were removed, the topology changes to
Ecdysozoa with 90% confidence level. The change in topology
in parallel with the reduction of the C. elegans branch length
points to the LBAE as the main obstacle to obtaining the true
phylogenetic relationship between chordates, arthropods and
nematodes. We conclude that the Ecdysozoa hypothesis does
not depend on adjusting a particular set of homologous exon
sequences to clock-like behavior.
Discussion
There are many reasons why the Coelomata-Ecdysozoa prob-
lem should be considered the most puzzling problem in ani-
mal systematics and a major open-ended subject in
evolutionary biology. The monophyly of the Ecdysozoa group,
strongly championed by the evo-devo community [30], was
originally deduced, and continually recovered, through the
analysis of different single-gene sequences [3,5,6,8-11],
sometimes in combination with morphological characters [7].
There is need for caution, however, as previous studies had
shown that individual genes are not sufficient to estimate the
correct genome phylogeny [19,31]. Furthermore, the reliabil-
ity of some of the phylogenetic markers used to derive Ecdys-
ozoa has been seriously questioned [32,33]. Those that
consider the Ecdysozoa hypothesis as more plausible insist
that the Coelomata topology is an artifact of LBAE, derived
from the fact that nematode genomes, particularly that of C.
elegans, evolve at higher rates [3], and are consequently dis-
placed to a more basal position.
On the other hand, as phylogenetic reconstruction assumes
that sampled data are representative of the whole genome
from which they are drawn [34], there is increasing agree-
ment to consider genome-scale analysis more accurate than
single-gene analysis when deciding between conflicting
topologies [19,31]. Conflict derives from the fact that all pre-
vious genome-wide phylogenetic attempts to test the hypoth-
esis have failed to confirm the 'moulting group' - the
Ecdysozoa - as a clade. All phylogenomic analyses carried out
to date favor the Coelomata hypothesis with the highest sta-
tistical support [12-16]. Furthermore, the Coelomata tree has
shown to be robust to criticism deriving from LBAE [12,14-16]
and nematode species inclusion [14]. Those that consider the
Coelomata hypothesis to be more appropriate insist that
longer sequences, rather than extensive taxon sampling [35],
will more effectively improve the accuracy of phylogenetic
inference [14,15,36,37], and emphasize that an inevitable
trade-off exists between the number of characters and the
number of species used in the study [15].
We show here that by using the fast-evolving nematode C. ele-
gans the Ecdysozoa can be recovered using genome-scale
phylogenetic analysis. Our analysis has been performed over
the largest number of eukaryotic genomes and over the larg-
est number of amino-acid residues ever used to test the
hypothesis. The major differences from previous genomic
approaches are threefold. First, we used a large number of
short conserved sequences (around 50 amino acids long)
derived from human homologous exon sequences. Only exon
sequences derived from eight genes, out of a total of around
100 analyzed by Blair et al. [14], were used in our analysis.
The remaining genes contained in the 18 human chromo-
somes did not pass the BLAST filters applied in the analysis.
Second, we arranged the dataset such that the sequences,
including those evolving faster or slower, were included if
they met the condition of equal rate of change between two
Relative rate testFigure 2
Relative rate test. (a) Relative C. elegans branch lengths derived from each
one of the eight M
i
matrices. Maximum likelihood estimates are expressed
as relative distance units of D. melanogaster. (b) Relative rate test
probability values evaluated at the 5% level family-wise (red line 1.7%).
OUG1, S. cerevisae; OUG2, phylogenetic weighted scheme using S.
cerevisae, A. thaliana, O. sativa and P. falciparum as outgroup species.
L
Ce
L
Dm
OUG1
OUG2
p-values
1.4
1.3
1.2
1.1
1.0
0.0
0.1
0.2
0.3
0.4
0.5
0.6
0.7
0.8
12345678
12345678
(a)
(b)
R41.6 Genome Biology 2005, Volume 6, Issue 5, Article R41 Dopazo and Dopazo />Genome Biology 2005, 6:R41
(C. elegans and D. melanogaster) or three species (C. intesti-
nalis, D. melanogaster and C. elegans). Third, we used a
large number of characters (amino-acid residues) and a
weighted distant outgroup species to enhance the power of
the relative rate test [20].
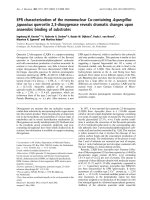
Phylogenetic treesFigure 3
Phylogenetic trees. Trees derived from M
1
and M
8
datasets, respectively support (a) the Coelomata and (b) the Ecdysozoa hypothesis. From left to right or
top to bottom, values besides nodes show the maximum likelihood reliability values of the quartet-puzzling tree and bootstrap values using maximum
likelihood, least squares, and neighbor-joining methods, respectively. Values in red show the support for (a) Coelomata and (b) Ecdysozoa nodes. Red
branches display distances between C. elegans and D. melanogaster. Smaller trees are minimal representations of both hypothesis.
S. cerevisae
C. elegans
A. gambiae
D. melanogaster
C. intestinalis
F. rubripes
H. sapiens
M. musculus
P. falciparum
O. sativa
A. thaliana
S. cerevisae
C. elegans
A. gambiae
D. melanogaster
C. intestinalis
F. rubripes
H. sapiens
M. musculus
P. falciparum
O. sativa
A. thaliana
ScHs
CeDm
ScHs
0.1
CeDm
100
100
100
100
100/100/100/100
100/100/100/100
100/100/100/100
100/100/100/100
100/100/100/100
100/100/100/100
100/100/100/100
100/100/100/100
100/100/100/100
100/100/100/100
100
100
100
100
100
100
100
100
100
100
100
100
70
84
88
78
83
99
98
98
(a)
(b)
Genome Biology 2005, Volume 6, Issue 5, Article R41 Dopazo and Dopazo R41.7
comment reviews reports refereed researchdeposited research interactions information
Genome Biology 2005, 6:R41
As discussed in our previous paper [16], by including or
excluding certain human homologous exon sequences, we
reduced the problem of LBAE and added a probable bias
favoring Coelomata. The present work confirms that this bias
exists. The concatenation and the posterior phylogenetic
analysis of the sequences shared by the eukaryotes used in
this analysis provide a viable solution to the ancestor-
descendant relationships of animal species once the LBAE is
removed.
Conclusions
Acceptance of the new animal phylogeny and the Ecdysozoa
hypothesis would provide a new scheme to understand the
Cambrian explosion [38,39] and the origin of metazoan body
plans [9,30] and consequently would set a new phylogenetic
framework for comparative genomics [40]. We have shown
how phylogenetic reconstruction based on whole-genome
sequences has the potential to solve one of the most
controversial hypotheses in animal evolution: the reliability
of the Ecdysozoa clade.
Materials and methods
Dataset collection
Complete genome sequences from Plasmodium falciparum
[41], Arabidopsis thaliana [42], Oryza sativa [43], Saccha-
romyces cerevisae [44], Caenorhabditis elegans [45],
Anopheles gambiae [46], Drosophila melanogaster [47],
Ciona intestinalis [48], Fugu rubripes [49], Mus musculus
[50] and Homo sapiens [51] were downloaded and formatted
to run local BLAST [52]. Amino-acid sequences correspond-
ing to all the gene exons in a sample of 18 human chromo-
some including 6-18, 20-22, X and Y (approximately 14,000
genes and 140,000 exons), were obtained from the Ensembl
database project [53]. Human paralogous exons were
excluded by running local blastp [52] on a human exon data-
base built ad hoc. Only the best of those sequences, with more
than a single hit with a fraction of aligned and conserved
Bootstrap and reliability support for alternative topologiesFigure 4
Bootstrap and reliability support for alternative topologies. Bootstrap and
reliability support (50% majority consensus rule) for Coelomata (C) and
Ecdysozoa (E) hypotheses derived from each one of the eight M
i
matrices.
(a) Distance methods. LS, least squares; NJ, neighbor joining. (b)
Maximum likelihood, using PHYLIP (ph) and PUZZLE (pz). Highly
supported trees were considered those with values above 90% (dotted
red line).
Clade support values
(C) NJ
(C) LS
(E) NJ
(E) LS
(C) MLph
(C) MLpz
(E) MLph
(E) MLpz
100
12345678
12345678
90
80
70
60
50
Clade support values
100
90
80
70
60
50
(a)
(b)
Paired-sites testsFigure 5
Paired-sites tests. p-values inferred from paired-sites tests considering
Coelomata (C) and Ecdysozoa (E) hypotheses at the 5% level (red line) for
all the datasets. (a) Shimodaira-Hasegawa test (SH); (b) expected-
likelihood weight method (ELW).
1.00
0.75
p-value
0.50
0.25
0.00
1.00
0.75
p-value
0.50
0.25
0.00
12345678
12345678
SH
ELW
CE
CE
(a)
(b)
R41.8 Genome Biology 2005, Volume 6, Issue 5, Article R41 Dopazo and Dopazo />Genome Biology 2005, 6:R41
amino-acid sequence ≥ 95% and ≥ 90% respectively, were
retained to find homologous sequences in the other eukaryo-
tic species (threshold values based on a previous human par-
alogous study [54]). We used tblastn [52] that searches a
query amino-acid sequence on the six translation frames of
the target sequence to search for homology in the complete
genome databases of the species mentioned above. Exons less
than 22 amino acids were removed from the analysis. Each
best hit of tblastn was filtered by means of a threshold e-value
(≤ 1e-03) and a threshold proportion of the query over the
subject sequence length (≥ 75%). Only those exons that pass
through all the species filter conditions were selected as the
final dataset of human exon homologous sequences. All the
exon homologous sequences were aligned using Clustal W
[55] with default parameters. The total number of homolo-
gous sequences, derived from 18 human chromosomes, cor-
responds to 1,192 exons selected from 610 known genes,
adding up to more than 55,500 amino-acid characters.
To arrange homologous sequences in different datasets, pair-
wise distances between sequences were extracted using the
PROTDIST program (Kimura option) of the PHYLIP package
[56]. Distances between C. elegans, D. melanogaster and H.
sapiens were transformed into branch lengths in a star-like
unrooted tree (l
a
= (d
ab
+ d
ac
- d
bc
)/2, where l
a
is the length of
the branch leading to a and d
ab
, d
ac
, d
bc
are the distances
between a and b, a and c, and b and c, respectively). It is
important to emphasize that we are not considering that the
phylogenetic relationships of C. elegans, D. melanogaster
and H. sapiens is a star topology. We used this exact equation
for determining the branch lengths of the three species,
because the unique way to arrange three species in a phyloge-
netic tree is a star topology. We consider C. elegans, D. mela-
nogaster and H. sapiens to be members of the ingroup and P.
falciparum, A. thaliana, O. sativa and S. cerevisae as the out-
group species at the moment to root the phylogenetic tree.
Homologous exon sequences were arranged in eight datasets
according to their pertinence to more inclusive areas sur-
rounding the straight line representing identical relative
branch lengths (RBLs) of C. elegans (L
Ce
= l
Ce
/l
Hs
) and D. mel-
anogaster (L
Dm
= l
Dm
/l
Hs
). The D
i
dataset clusters all the
homologous exon alignments where L
Dm
- δ
i
≤ L
Ce
≤ L
Dm
+ δ
i
,
where i is an integer ranging from 2 to 7 and δ
i
= 5.0,
3.0,2.5,2.0,15,1.0,0.5. The D
1
dataset contains all the exon
homologous sequences without the constraints of evolution-
ary rates. Exons with negative or undefined normalized dis-
tances (l
Hs
= 0) were excluded from the analysis. All the
aligned homologous exon sequences of the D
i
dataset were
concatenated in the M
i
matrix. Three additional matrices
were derived from D
1
: two by removing exons containing L
Ce
≥ and L
Ce
≥ , and the last one by adjusting the
sequences of C. intestinalis, D. melanogaster and C. elegans
to clock-like behavior.
Phylogenetic methods
The relative rate test was performed at the 5% statistical level
by means of the RRTree program [57] using outgroups with
one (S. cerevisae; OUG1) or more species (S. cerevisae, A.
thaliana, O. sativa and P. falciparum; OUG2). In the latter
case, an explicit weighted phylogenetic scheme was chosen
(1/2 S. cerevisae, ((1/8 A. thaliana, 1/8 O. sativa), 1/4 P. fal-
ciparum)). Given that three ingroups were set for all analyses
(the chordates H. sapiens, M. musculus, F. rubripes, and C.
intestinalis; the arthropods Anopheles gambiae and Dro-
sophila melanogaster; and the nematode C. elegans), the
threshold value was corrected for multiple testing to 5/3 =
1.7%. TREE-PUZZLE [58] was used to evaluate six alternative
evolutionary models adjusted for frequencies (+F), site rate
variation (+Γ distribution with two rates) and a proportion of
invariable sites (+I), to estimate the amount of evolutionary
information of datasets by the likelihood-mapping method
[59], to derive the maximum likelihood (ML) trees using the
quartet-puzzling algorithm, to set the ML pairwise sequence
distances, and to test alternative topologies using SH [60]
and ELW [29] tests. The PROML (JTT+f) program of the
PHYLIP package [56] was used to estimate ML trees derived
from the stepwise addition algorithm. Distance methods of
phylogenetic reconstruction were performed using PROT-
Removing fast-evolving sequencesFigure 6
Removing fast-evolving sequences. Exon sequences of C. elegans showing
L
Ce
≥ = 4.06 represent 15% of the total exon. When these faster
exons were removed (above blue line), support for the Coelomata
topology was reduced from the original 100% to 85%. Furthermore, when
28% of the faster exons were deleted (red line), Ecdysozoa is recovered
with 90% statistical support. This suggests that LBAE is the main problem
in obtaining the Ecdysozoa tree. Blue line, = 4.06; red line, =
2.66.
L
Dm
L
Ce
Coelomata = 78%
Ecdysozoa > 90%
D
1
δ=1.5
Ecdysozoa > 90%
10
8
6
4
2
0
0246810
L
Ce
−
L
Ce
−
L
Dm
−
L
Ce
−
L
Dm
−
Genome Biology 2005, Volume 6, Issue 5, Article R41 Dopazo and Dopazo R41.9
comment reviews reports refereed researchdeposited research interactions information
Genome Biology 2005, 6:R41
DIST (JTT, Kimura options), NEIGHBOR (neighbor-joining
(NJ) [61]) and least squares (LS) [62] algorithms, and CON-
SENSE (50% majority-consensus rule option) programs on
100 bootstrap replications using PHYLIP.
Additional data files
The following additional data files are available with the
online version of this paper. Additional data file 1 contains a
figure showing ML puzzle mapping of the M
i
matrices. Addi-
tional data file 2 contains a figure showing ML puzzle map-
ping of the matrix derived from chordate, arthropod and
nematode sequences showing clock-like behavior. Additional
data file 3 contains the matrices.
Additional File 1ML puzzle mapping of the M
i
matrices.ML puzzle mapping of the M
i
matrices. Maximum likelihood mapping results for each one of the M
i
concatenated matrices. From the first row and from left to right, M1 to M2 until the fourth row, M7 to M8.Click here for fileAdditional File 2ML puzzle mapping of the matrix derived from chordate, arthropod and nematode sequences showing clock-like behavior.ML puzzle mapping of the matrix derived from chordate, arthropod and nematode sequences showing clock-like behavior. ML mapping of the concatenated matrix derived from constraining sequences to 3 clocks-like behavior.Click here for fileAdditional File 3MatricesMatrices. The full set of matrices (phylip format) used in the phy-logenetic analyzes.Click here for file
Acknowledgements
We thank especially Javier Santoyo and the Bioinformatics department
members at the Centro de Investigación Príncipe Felipe. We thank J. Cast-
resana, D. Posada and R. Zardoya for comments and suggestions, and M.
Robinson-Rechavi for updating the code of the RRTree software. Special
thanks goes to Amanda Wren for her revision of the English. H.D. acknowl-
edges the support of Fundación Carolina and Fundación la Caixa.
References
1. Adoutte A, Balavoine G, Lartillot N, de Rosa R: Animal evolution.
The end of the intermediate taxa? Trends Genet 1999,
15:104-108.
2. Raff RR: The Shape of Life. Genes, Development and the Evolution of
Animal Form Chicago: The University of Chicago Press; 1996.
3. Aguinaldo AM, Turbeville JM, Linford LS, Rivera MC, Garey JR, Raff
RA, Lake JA: Evidence for a clade of nematodes, arthropods
and other moulting animals. Nature 1997, 387:489-493.
4. Hedges SB: The origin and evolution of model organisms. Nat
Rev Genet 2002, 3:838-849.
5. Mallatt J, Winchell CJ: Testing the new animal phylogeny: first
use of combined large-subunit and small-subunit rRNA gene
sequences to classify the protostomes. Mol Biol Evol 2002,
19:289-301.
6. Ruiz-Trillo I, Paps J, Loukota M, Ribera C, Jondelius U, Baguna J, Riu-
tort M: A phylogenetic analysis of myosin heavy chain type II
sequences corroborates that Acoela and Nemertodermat-
ida are basal bilaterians. Proc Natl Acad Sci USA 2002,
99:11246-11251.
7. Peterson KJ, Eernisse DJ: Animal phylogeny and the ancestry of
bilaterians: inferences from morphology and 18S rDNA gene
sequences. Evol Dev 2001, 3:170-205.
8. Manuel M, Kruse M, Muller WE, Le Parco Y: The comparison of
beta-thymosin homologues among metazoa supports an
arthropod-nematode clade. J Mol Evol 2000, 51:378-381.
9. de Rosa R, Grenier JK, Andreeva T, Cook CE, Adoutte A, Akam M,
Carrol SB, Balavoine G: Hox genes in brachiopods and pri-
apulids and protostome evolution. Nature 1999, 399:772-776.
10. Mallatt JM, Garey JR, Shultz JW: Ecdysozoan phylogeny and
Bayesian inference: first use of nearly complete 28S and 18S
rRNA gene sequences to classify the arthropods and their
kin. Mol Phylogenet Evol 2004, 31:178-191.
11. Anderson FE, Cordoba AJ, Thollesson M: Bilaterian phylogeny
based on analyzes of a region of the sodium-potassium
ATPase beta-subunit gene. J Mol Evol 2004, 58:252-268.
12. Mushegian AR, Garey JR, Martin J, Liu LX: Large-scale taxonomic
profiling of eukaryotic model organisms: a comparison of
orthologous proteins encoded by the human, fly, nematode,
and yeast genomes. Genome Res 1998, 8:590-598.
13. Hausdorf B: Early evolution of the bilateria. Syst Biol 2000,
49:130-142.
14. Blair JE, Ikeo K, Gojobori T, Hedges SB: The evolutionary position
of nematodes. BMC Evol Biol 2002, 2:7.
15. Wolf YI, Rogozin IB, Koonin EV: Coelomata and not Ecdysozoa:
evidence from genome-wide phylogenetic analysis. Genome
Res 2004, 14:29-36.
16. Dopazo H, Santoyo J, Dopazo J: Phylogenomics and the number
of characters required for obtaining an accurate phylogeny
of eukaryote model species. Bioinformatics 2004, 20(Suppl
1):I116-I121.
17. Copley RR, Aloy P, Russell RB, Telford MJ: Systematic searches
for molecular synapomorphies in model metazoan genomes
give some support for Ecdysozoa after accounting for the idi-
osyncrasies of Caenorhabditis elegans. Evol Dev 2004, 6:164-169.
18. Philippe H, Snell EA, Bapteste E, Lopez P, Holland PW, Casane D:
Phylogenomics of eukaryotes: the impact of missing data on
large alignments. Mol Biol Evol 2004, 21:1740-1752.
19. Rokas A, Williams BL, King N, Carroll SB: Genome-scale
approaches to resolving incongruence in molecular
phylogenies. Nature 2003, 425:798-804.
20. Bromham L, Penny D, Rambaut A, Hendy MD: The power of rela-
tive rates tests depends on the data. J Mol Evol 2000, 50:296-301.
21. Kullback S, Leibler RA: On information and sufficiency. Annls
Math Stat 1951, 22:79-86.
22. Whelan S, Goldman N: A general empirical model of protein
evolution derived from multiple protein families using a
maximum-likelihood approach. Mol Biol Evol 2001, 18:691-699.
23. Muller T, Vingron M: Modeling amino acid replacement. J Com-
put Biol 2000, 7:761-776.
24. Henikoff S, Henikoff JG: Amino acid substitution matrices from
protein blocks. Proc Natl Acad Sci USA 1992, 89:10915-10919.
25. Jones DT, Taylor WR, Thornton JM: The rapid generation of
mutation data matrices from protein sequences. Comput Appl
Biosci 1992, 8:275-282.
26. Dayhoff MO, Schwartz RM, Orcutt BC: A model of evolutionary
change in proteins. In Atlas of Protein Sequence and Structure Volume
5. Edited by: Dayhoff MO. Washington DC: National Biomedical
Research Foundation; 1978:345-358.
27. Adachi J, Hasegawa M: Model of amino acid substitution in pro-
teins encoded by mitochondrial DNA. J Mol Evol 1996,
42:459-468.
28. Felsenstein J: Inferring Phylogenies Sunderland, MA: Sinauer; 2004.
29. Strimmer K, Rambaut A: Inferring confidence sets of possibly
misspecified gene trees. Proc Biol Sci 2002, 269:137-142.
30. Carrol SB, Grenier JK, Weatherbee SD: From DNA to Diversity. Molec-
ular Genetics and the Evolution of Animal Design Malden, MA: Blackwell
Science; 2001.
31. Cummings MP, Otto SP, Wakeley J: Sampling properties of DNA
sequence data in phylogenetic analysis. Mol Biol Evol 1995,
12:814-822.
32. Hasegawa M, Hashimoto T: Ribosomal RNA trees misleading?
Nature 1993, 361:23.
33. Abouheif E, Zardoya R, Meyer A: Limitations of metazoan 18S
rRNA sequence data: implications for reconstructing a phyl-
ogeny of the animal kingdom and inferring the reality of the
Cambrian explosion. J Mol Evol 1998, 47:394-405.
34. Martin MJ, Gonzalez-Candelas F, Sobrino F, Dopazo J: A method for
determining the position and size of optimal sequence
regions for phylogenetic analysis. J Mol Evol 1995, 41:1128-1138.
35. Hillis DM, Pollock DD, McGuire JA, Zwickl DJ: Is sparse taxon
sampling a problem for phylogenetic inference? Syst Biol 2003,
52:124-126.
36. Rosenberg MS, Kumar S: Incomplete taxon sampling is not a
problem for phylogenetic inference. Proc Natl Acad Sci USA 2001,
98:10751-10756.
37. Rosenberg MS, Kumar S: Taxon sampling, bioinformatics, and
phylogenomics. Syst Biol 2003, 52:119-124.
38. Balavoine G, Adoutte A: One or three Cambrian radiations? Sci-
ence 1998, 4280:397-398.
39. Conway Morris S: The Cambrian "explosion": slow-fuse or
megatonnage. Proc Natl Acad Sci USA 2000, 97:4426-4429.
40. Eisen JA, Fraser CM: Phylogenomics: intersection of evolution
and genomics. Science 2003, 300:1706-1707.
41. Gardner MJ, Hall N, Fung E, White O, Berriman M, Hyman RW, Carl-
ton JM, Pain A, Nelson KE, Bowman S, et al.: Genome sequence of
the human malaria parasite Plasmodium falciparum. Nature
2002, 419:498-511.
42. Arabidopsis Genome Initiative: Analysis of the genome sequence
of the flowering plant Arabidopsis thaliana. Nature 2000,
408:796-815.
43. Yu J, Hu S, Wang J, Wong GK, Li S, Liu B, Deng Y, Dai L, Zhou Y,
Zhang X, et al.: A draft sequence of the rice genome (Oryza
R41.10 Genome Biology 2005, Volume 6, Issue 5, Article R41 Dopazo and Dopazo />Genome Biology 2005, 6:R41
sativa L. ssp. indica). Science 2002, 296:79-92.
44. Goffeau A: The yeast genome directory. Nature 1997,
387(Suppl 5):.
45. C. elegans Sequencing Consortium: Genome sequence of the
nematode C. elegans: a platform for investigating biology. Sci-
ence 1998, 282:2012-2018.
46. Holt RA, Subramanian GM, Halpern A, Sutton GG, Charlab R, Nussk-
ern DR, Wincker P, Clark AG, Ribeiro JM, Wides R, et al.: The
genome sequence of the malaria mosquito Anopheles
gambiae. Science 2002, 298:129-149.
47. Adams MD, Celniker SE, Holt RA, Evans CA, Gocayne JD, Amanati-
des PG, Scherer SE, Li PW, Hoskins RA, Galle RF, et al.: The
genome sequence of Drosophila melanogaster. Science 2000,
287:2185-2195.
48. Dehal P, Satou Y, Campbell RK, Chapman J, Degnan B, De Tomaso A,
Davidson B, Di Gregorio A, Gelpke M, Goodstein DM, et al.: The
draft genome of Ciona intestinalis : insights into chordate and
vertebrate origins. Science 2002, 298:2157-2167.
49. Aparicio S, Chapman J, Stupka E, Putnam N, Chia JM, Dehal P, Christ-
offels A, Rash S, Hoon S, Smit A, et al.: Whole-genome shotgun
assembly and analysis of the genome of Fugu rubripes. Science
2002, 297:1301-1310.
50. Waterston RH, Lindblad-Toh K, Birney E, Rogers J, Abril JF, Agarwal
P, Agarwala R, Ainscough R, Alexandersson M, An P, et al.: Initial
sequencing and comparative analysis of the mouse genome.
Nature 2002, 420:520-562.
51. Lander ES, Linton LM, Birren B, Nusbaum C, Zody MC, Baldwin J,
Devon K, Dewar K, Doyle M, FitzHugh W, et al.: Initial sequencing
and analysis of the human genome. Nature 2001, 409:860-921.
52. Altschul SF, Madden TL, Schaffer AA, Zhang J, Zhang Z, Miller W, Lip-
man DJ: Gapped BLAST and PSI-BLAST: a new generation of
protein database search programs. Nucleic Acids Res 1997,
25:3389-3402.
53. Birney E, Andrews D, Bevan P, Caccamo M, Cameron G, Chen Y,
Clarke L, Coates G, Cox T, Cuff J, et al.: Ensembl 2004. Nucleic Acids
Res 2004, 32(Database issue):D468-D470.
54. Bailey JA, Gu Z, Clark RA, Reinert K, Samonte RV, Schwartz S, Adams
MD, Myers EW, Li PW, Eichler EE: Recent segmental
duplications in the human genome. Science 2002,
297:1003-1007.
55. Thompson JD, Higgins DG, Gibson TJ: CLUSTAL W: improving
the sensitivity of progressive multiple sequence alignment
through sequence weighting, position-specific gap penalties
and weight matrix choice. Nucleic Acids Res 1994, 22:4673-4680.
56. Felsenstein J: PHYLIP (Phylogeny Inference Package) version 3.6a3 Seattle,
WA: Department of Genome Sciences, University of Washington;
2002.
57. Robinson-Rechavi M, Huchon D: RRTree: relative-rate tests
between groups of sequences on a phylogenetic tree. Bioinfor-
matics 2000, 16:296-297.
58. Schmidt HA, Strimmer K, Vingron M, von Haeseler A: TREE-PUZ-
ZLE: maximum likelihood phylogenetic analysis using quar-
tets and parallel computing. Bioinformatics 2002, 18:502-504.
59. Strimmer K, von Haeseler A: Likelihood-mapping: a simple
method to visualize phylogenetic content of a sequence
alignment. Proc Natl Acad Sci USA 1997, 94:6815-6819.
60. Shimodaira H, Hasegawa M: Multiple comparisons of log-likeli-
hoods with applications to phylogenetic inference. Mol Biol
Evol 1999, 16:1114-1116.
61. Saitou N, Nei M: The neighbor-joining method: a new method
for reconstructing phylogenetic trees. Mol Biol Evol 1987,
4:406-425.
62. Fitch WM, Margoliash E: Construction of phylogenetic trees: a
method based on mutation distances as estimated from
cytochrome c sequences is of general applicability. Science
1967, 155:279-284.