Báo cáo y học: "Growth-rate regulated genes have profound impact on interpretation of transcriptome profiling in Saccharomyces cerevisiae" pptx
Bạn đang xem bản rút gọn của tài liệu. Xem và tải ngay bản đầy đủ của tài liệu tại đây (874.03 KB, 13 trang )
Genome Biology 2006, 7:R107
comment reviews reports deposited research refereed research interactions information
Open Access
2006Regenberget al.Volume 7, Issue 11, Article R107
Research
Growth-rate regulated genes have profound impact on
interpretation of transcriptome profiling in Saccharomyces cerevisiae
Birgitte Regenberg
¤
*
, Thomas Grotkjær
¤
†
, Ole Winther
‡
, Anders Fausbøll
§
,
Mats Åkesson
†
, Christoffer Bro
†
, Lars Kai Hansen
‡
, Søren Brunak
§
and
Jens Nielsen
†
Addresses:
*
Institut für Molekulare Biowissenschaften, Johann Wolfgang Goethe-Universität, Max-von-Laue-Str. 9, 60438 Frankfurt am Main,
Germany.
†
Center for Microbial Biotechnology, BioCentrum-DTU, Building 223, Technical University of Denmark, DK-2800 Kgs. Lyngby,
Denmark.
‡
Informatics and Mathematical Modelling, Building 321, Technical University of Denmark, DK-2800 Kgs. Lyngby, Denmark.
§
Center
for Biological Sequence Analysis, BioCentrum-DTU, Building 208, Technical University of Denmark, DK-2800 Kgs. Lyngby, Denmark.
¤ These authors contributed equally to this work.
Correspondence: Jens Nielsen. Email:
© 2006 Regenberg et al.; licensee BioMed Central Ltd.
This is an open access article distributed under the terms of the Creative Commons Attribution License ( which
permits unrestricted use, distribution, and reproduction in any medium, provided the original work is properly cited.
Yeast growth rate-regulated transcription<p>Analysis of <it>S. cerevisiae </it>cultures with generation times varying between 2 and 35 hours shows that the expression of half of all yeast genes is affected by the specific growth rate.</p>
Abstract
Background: Growth rate is central to the development of cells in all organisms. However, little
is known about the impact of changing growth rates. We used continuous cultures to control
growth rate and studied the transcriptional program of the model eukaryote Saccharomyces
cerevisiae, with generation times varying between 2 and 35 hours.
Results: A total of 5930 transcripts were identified at the different growth rates studied.
Consensus clustering of these revealed that half of all yeast genes are affected by the specific growth
rate, and that the changes are similar to those found when cells are exposed to different types of
stress (>80% overlap). Genes with decreased transcript levels in response to faster growth are
largely of unknown function (>50%) whereas genes with increased transcript levels are involved in
macromolecular biosynthesis such as those that encode ribosomal proteins. This group also covers
most targets of the transcriptional activator RAP1, which is also known to be involved in
replication. A positive correlation between the location of replication origins and the location of
growth-regulated genes suggests a role for replication in growth rate regulation.
Conclusion: Our data show that the cellular growth rate has great influence on transcriptional
regulation. This, in turn, implies that one should be cautious when comparing mutants with different
growth rates. Our findings also indicate that much of the regulation is coordinated via the
chromosomal location of the affected genes, which may be valuable information for the control of
heterologous gene expression in metabolic engineering.
Published: 14 November 2006
Genome Biology 2006, 7:R107 (doi:10.1186/gb-2006-7-11-r107)
Received: 22 May 2006
Revised: 4 September 2006
Accepted: 14 November 2006
The electronic version of this article is the complete one and can be
found online at />R107.2 Genome Biology 2006, Volume 7, Issue 11, Article R107 Regenberg et al. />Genome Biology 2006, 7:R107
Background
Growth is fundamental to proliferation of all living cells, from
the most primitive prokaryote to human cells, and regulation
of growth rate is essential if proper development of an organ-
ism is to take place. Despite progress in whole-genome tran-
scription analysis [1,2], little is known about the
transcriptional effects of differences in the growth rate, and
most of this knowledge comes from indirect observations [3-
5]. In many studies, cells treated with a metabolic inhibitor
have a longer generation time [6,7]. This affects the expres-
sion of genes that encode ribosomal proteins (RPs) and
enzymes involved in the central metabolism [7], but it is cur-
rently not possible, based on expression data alone, to distin-
guish between the primary effects caused by the addition of
the metabolic inhibitor and the secondary effects arising from
growth arrest. Likewise, transcription data from healthy
mammalian tissue versus malignant tissue may be affected
not only by the occurrence of specific mutations in the cancer
cells but also by the difference in growth rate between the two
types of tissue [8,9]. This hypothesis is substantiated by the
finding that several hundred genes change expression level
when comparing the slow-growing Saccharomyces cerevi-
siae mutant mcm1 with the corresponding wild-type strain,
whereas very few genes change expression when the two
strains are forced to grow with the same doubling time [10].
Here, we describe the transcriptional program over a wide
range of doubling times in the yeast S. cerevisiae and discuss
the implications for whole-genome transcriptome profiling.
The growth rate of this lower eukaryote can be controlled in
submerged, continuous culture by the feeding rate of nutri-
ents. Cells grown in continuous culture at steady state have a
specific growth rate, μ, that is equal to the dilution rate,
defined as the ratio between the feeding rate and the volume
of medium in the bioreactor. Because the specific growth rate
is inversely proportional to the doubling time of the cells T
2
(specifically, T
2
= ln(2)/μ), it is possible to change the dou-
bling times of cells in a controlled manner in continuous cul-
tures. Although the environmental factors that control the
specific growth rate in higher and lower eukaryotes are phys-
iologically different, changes in the specific growth rate are
expected to rely on the same basic biochemical changes. Com-
parative analysis of Caenorhabditis elegans and S. cerevisiae
has also shown that most of the core biological functions are
carried out by orthologous proteins [11], and the present
study is therefore likely to reveal fundamental principles of
growth control in eukaryotes.
Results
Consensus clustering reveals growth rate regulated
genes
The haploid laboratory strain S. cerevisiae CEN.PK113-7D
was grown at steady state in aerobic chemostat cultures on a
synthetic minimal medium with glucose as the limiting nutri-
ent. Cells were cultured at six different specific growth rates,
namely μ = 0.02, 0.05, 0.10, 0.20, 0.25, and 0.33 per hour,
corresponding to doubling times between 2 and 35 hours
(Figure 1a). To assess the transcriptional program underlying
growth, we analyzed the whole-genome transcription profiles
from all cultures and thereby identified a signal from 5,930
out of 6,091 annotated open reading frames (ORFs; Addi-
tional data file 1). The detectable transcripts were then
grouped using a robust and signal insensitive algorithm for
clustering of coexpressed genes, whereas genes with noisy
expression profiles were discarded (Figure 1b-d) [12]. Con-
sensus clustering algorithms [13-15] take advantage of the
randomness in K means or Gaussian clustering solutions to
produce a robust clustering. By averaging over multiple runs
with different number of clusters K, common patterns in each
clustering run are amplified whereas nonreproducible fea-
tures of individual runs are suppressed. Consequently, it is
possible to cluster large expression datasets without conserv-
ative fold change exclusion [12].
In the present case we extracted the consensus clusters from
50 scans with Gaussian mixtures in the interval K = 10 40,
leading to a total of 31 × 50 = 1,550 clustering runs. The
results from the multiple runs were used to calculate a cooc-
currence matrix C. This matrix describes the empirical prob-
ability of observing each pair of transcripts (n,n') in the same
cluster throughout the 1,550 clustering runs (Figure 1). The
probability of transcript co-occurrence was then used to gen-
erate the consensus clusters (Additional data file 2). The co-
occurrence matrix was converted into a transcript-transcript
distance matrix as D
nn'
= 1 - C
nn'
; that is, a high probability of
co-occurrence is equal to a short distance between the expres-
sion profiles of a pair of transcripts. The number of clusters in
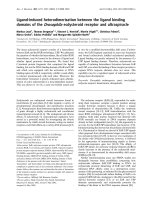
Experimental set-upFigure 1 (see following page)
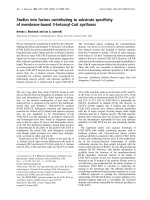
Experimental set-up. (a) Cells were grown at steady state in continuous chemostat cultures, with the specific growth rate controlled by the flow rate and
the volume of medium in the reactor. Cells were harvested and used for transcription analysis and subsequent clustering of the transcription data. A
simulated dataset was generated to illustrate the principles of consensus clustering. The dataset contained 80 members derived from four clusters (*, x, +
and · in blue) in two experiments. The consensus clustering method consisted of three steps (panels b-d). (b) An ensemble of clusterings was obtained by
multiple runs of mixture of Gaussians [59]. Each run gave very different results (red ellipses), depending upon the initialization. (c) The results from
multiple runs was used to form the transcript co-occurrence matrix (C), which was calculated as the empirical probability (over all runs) of observing each
pair of transcripts (n,n') in the same cluster. (d) Based on the co-occurrence of transcripts a consensus clustering was generated. The co-occurrence
matrix was also converted into a transcript-transcript distance matrix as D
nn'
= 1 - C
nn'
, which was used as input to a hierarchical clustering. The resulting
consensus dendrogram showed the relationship between the clusters and was thereby a valuable tool in the biologic validation of the data.
Genome Biology 2006, Volume 7, Issue 11, Article R107 Regenberg et al. R107.3
comment reviews reports refereed researchdeposited research interactions information
Genome Biology 2006, 7:R107
Figure 1 (see legend on previous page)
3
1
4
2
(a)
(d)
(b)
(c)
Glucose
Microarray analysisContinuous cultivation
Co-occurrence matrix
Glucose
High growth rate Low growth rate
Air Air
R107.4 Genome Biology 2006, Volume 7, Issue 11, Article R107 Regenberg et al. />Genome Biology 2006, 7:R107
the dendrogram was finally determined as the average over
the 50 repetitions of the Gaussian mixtures with the greatest
likelihood. This criterion was found to be a pragmatic, con-
servative starting point for biologic validation. We reduced
the 27 clusters to 13 by merging biologically similar clusters
adjacent in the consensus dendrogram. Transcripts that
could not be assigned to a cluster with at least 80% probabil-
ity (P
a
< 0.20) were discarded and collected in a 'trash' cluster
(Figure 2a, cluster 14; Additional data file 2).
Transcript levels of genes involved in biogenesis
increase with the specific growth rate
Among the 1753 ORFs (Figure 2a, clusters 1-4) with increas-
ing transcript level as a function of the specific growth rate
were mainly genes involved in RNA metabolism and in the
biosynthesis of novel cell material. More specifically, these
genes are involved in the synthesis of RPs, respiration, amino
acid biosynthesis and lipid biosynthesis, as well as in nucleo-
base, nucleoside, nucleotide, and nucleic acid metabolism
(Table 1). Ribosome-related genes were found to be over-rep-
resented in clusters 1, 3 and 7, and were almost absent in clus-
ters with decreased or complex transcript patterns (Figure
2b). This observation was in good agreement with the over-
representation of the regulatory ribosomal protein elements
(RRPEs) GAAAA(A/T)TT in clusters 1 and 2 (Table 1). Com-
paring the genes of clusters 1-7 with a transcription factor
binding study [16] showed that 70% of the RAP1 targets were
found in these clusters, in particular clusters 2, 4, and 6 (P <
10
-2
). RAP1 is a highly abundant transcription factor [17] that
is involved in transcriptional activation of the highly
expressed genes, including genes encoding RPs and glycolytic
enzymes [18]. The over-representation of RAP1 targets in
clusters 2, 4, and 6 therefore suggests that this factor may be
an important determinant of positive growth rate regulation.
A higher specific growth rate may be obtained by shortening
steps in the cell cycle, and we therefore expected to identify
cell cycle regulated genes among the growth rate affected
genes [19]. Comparing a list of 430 cell cycle regulated genes
[20-22] with genes regulated by the specific growth rate
showed that this also was the case. Both clusters 1 and 2
exhibited significant over-representation of genes expressed
in the G
1
(P < 10
-2
) of the cell cycle. This observation, together
with the finding of the M-G
1
regulated RRPEs in genes of clus-
ters 1 and 2, suggests that a change in the specific growth rate
affected the length of G
1
rather than other steps in the cell
cycle.
The transcript level of stress response genes decrease
with the specific growth rate
Many genes involved in stress response had decreased mRNA
level as a function of the specific growth rate (Figure 2a, clus-
ters 12 and 13). A signal that could be mediated by the TOR
(target of rapamycin) pathway [23,24] via the corresponding
stress response element, namely AGGGG, found to be over-
represented among members of clusters 12 and 13 (Table 1).
Genes in clusters 11 and 12 were mostly involved in chromo-
some organization and RNA processing, whereas cluster 13
typically contained stress response genes, for instance genes
encoding heat shock proteins and genes involved in
autophagy. To investigate the overlap between cluster 13 and
genes found in stress response studies, we compared the
present data with a core of 1,000 stress response genes that
have been denoted the environmental stress response (ESR)
genes [7]. Transcript data from cells going into lag phase [5],
growing under postdiauxic conditions [5], or exposed to 12
stress conditions revealed a strong correlation with transcript
profiles from cells at different specific growth rates (Figure 3).
Eighty percent of the transcripts that decreased upon stress
showed the same response to slower growth, whereas 89% of
the transcripts that increased upon stress also increased upon
slower growth (Figure 3). This overlap between growth rate
regulated genes and genes responding to stress indicates that
the stress response shares a component with the response to
changes in the specific growth rate.
The analysis also revealed that the responses to stress and
growth rate are independent of carbon source. Cells grown on
galactose are inhibited when exposed to 10 mmol/l LiCl [25].
Besides a specific inhibition of phosphoglucomutase [25],
lithium also inhibits the specific growth rate from 0.15 to
0.025 per hour over 140 minutes while the transcript level of
1,390 genes changed more than twofold [6]. The transcript
profiles of these genes have a considerable overlap with those
of glucose grown cells (Figure 3), and suggest that they relate
to the growth rate rather than the choice and amount of car-
bon source.
Almost 50% of the members of cluster 13 (Figure 2) belonged
to the group of ORFs with unknown process (Table 1). Over-
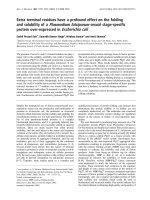
Clusters of genes that are coexpressed at specific growth rates from 0.33 per hourFigure 2 (see following page)
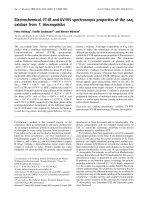
Clusters of genes that are coexpressed at specific growth rates from 0.02 to 0.33 per hour. (a) The transcript levels of differentially regulated genes are
shown as transformed values between -1 and 1, where 0 indicates the average expression level over all six specific growth rates (μ = 0.02, 0.05, 0.1, 0.2,
0.25, and 0.33 per hour). The average transcript level within a cluster is indicated by the curve and the error bars give the standard deviation on the
transcription profiles (clusters can be found in Additional data file 3). The 13 clusters originate from 27 clusters that were reduced manually (Additional
data file 2). This was done by merging very similar clusters (clusters close in the dendrogram and discarding clusters that appeared to arise from
experimental variation). Finally, ORFs that could not be assigned to a cluster with at least 80% probability (P
a
< 0.20) were discarded and collected into a
'trash' cluster 14 together with the discarded clusters. (b) shows the expected distribution of ribosome related genes (black bars) and the actual
distribution of ribosome related genes (white bars) in the 13 clusters.
Genome Biology 2006, Volume 7, Issue 11, Article R107 Regenberg et al. R107.5
comment reviews reports refereed researchdeposited research interactions information
Genome Biology 2006, 7:R107
Figure 2 (see legend on previous page)
1 2 3 4 5 6 7 8 9 10 11 12 13
0
20
40
60
80
100
Cluster
Ribosome−related genes
Expected
Observed
−1
−0.5
0
0.5
1 Clstr. 1: 571 Clstr. 2: 413 Clstr. 3: 372 Clstr. 4: 397 Clstr. 5: 367
−1
−0.5
0
0.5
1 Clstr. 6: 88 Clstr. 7: 287 Clstr. 8: 221 Clstr. 9: 86
0.1 0.2 0.3
Clstr. 10: 72
0.1 0.2 0.3
−1
−0.5
0
0.5
1 Clstr. 11: 250
0.1 0.2 0.3
Clstr. 12: 185
0.1 0.2 0.3
Clstr. 13: 237
0.1 0.2 0.3
Clstr. 14: 2384
(b)
(a)
Specific growth rate (μ)
Transcript expression level
R107.6 Genome Biology 2006, Volume 7, Issue 11, Article R107 Regenberg et al. />Genome Biology 2006, 7:R107
Table 1
Over-represented GO groups and promoter consensus
sequences
Cluster GO group
Cluster 1 Metabolism
Biosynthesis
Cell organization and biogenesis
Amino acid metabolism
Nucleotide metabolism
Protein metabolism
Nucleotide biosynthesis
Carboxylic acid metabolism
tRNA modification
Ribosome biogenesis and assembly
Nucleobase, nucleoside, nucleotide, and nucleic acid
metabolism
Glutamate biosynthesis
TGAAAA/TTTTCA
GAAAAA/TTTTTC
Cluster 2 Cell growth and/or maintenance
Mitotic cell cycle
Physiologic process
Nuclear organization and biogenesis
Organelle organization and biogenesis
Cytoplasm organization and biogenesis
Cytoskeleton organization and biogenesis
Morphogenesis
Reproduction
AAATTT/AAATTT
GAAAAA/TTTTTC
Cluster 3 Ribosome biogenesis
Cytoplasm organization and biogenesis
RNA metabolism
Aerobic respiration
Nucleobase, nucleoside, nucleotide, and nucleic acid
metabolism
Cell growth and/or maintenance
AATTCA/TGAATT
Cluster 4 Lipid metabolism
Steroid metabolism
Amino acid biosynthesis
Glutamine family amino acid biosynthesis
Cell growth and/or maintenance
Arginine biosynthesis
ATAACA/TGTTAT
Cluster 5 Cell growth and/or maintenance
Protein modification
Protein amino acid phosphorylation
Organelle organisation and biogenesis
Cell wall organization and biogenesis
Cell organization and biogenesis
Signal transduction
Cytokinesis
Amino acid biosynthesis
Cluster 6 DNA replication and chromosome cycle
Cluster 7 -
Cluster 8 Transport
GAAAAA/TTTTTC
Cluster 9 Steroid metabolism
Alcohol metabolism
Ergosterol biosynthesis
Ammonium transport
Biological process unknown
Cluster 10 Carboxylic acid metabolism
Sporulation
Nitrogen utilization
Carnitine metabolism
Main pathways of carbohydrate metabolism
Energy pathways
Sporulation
Cluster 11 RNA splicing
mRNA metabolism
Regulation of transcription
Cluster 12 Meiosis
Meiotic prophase I
Nuclear division
Response to stimulus
AAGGGG/CCCCTT
Cluster 13 Autophagy
Vitamin metabolism
Fatty acid β-oxidation
Response to water
Biological process unknown
AAGGGG/CCCCTT
AGGGAG/CTCCCT
AAAAGG/CCTTTT
AAAGGG/CCCTTT
AGGGGG/CCCCCT
Shown are over-represented GO [61,62] groups and promoter
consensus sequences in the 13 clusters of growth regulated genes. GO
groups describing a cellular process with P < 10
-4
were considered
significant and included in the table. If the same set of genes was found
in two or more neighbouring GO groups, only one GO term is
included [63]. Hexamers, found in the 800 base pair upstream region of
ORFs in a cluster, were considered significantly over-represented when
E < 10
-2
[64,65]. GO, Gene Ontology; ORF, open reading frame.
Table 1 (Continued)
Over-represented GO groups and promoter consensus
sequences
Genome Biology 2006, Volume 7, Issue 11, Article R107 Regenberg et al. R107.7
comment reviews reports refereed researchdeposited research interactions information
Genome Biology 2006, 7:R107
all, only 25% of the ORFs in S. cerevisiae have not been
assigned to a biologic process, and the lack of annotation was
therefore a clear trait of ORFs in cluster 13. The strong tran-
scriptional response argued against these ORFs being dubi-
ous genes. Our results suggest that the cellular role played by
these ORFs may be unclear because they are poorly expressed
at the high specific growth rates at which phenotype and func-
tion are normally inferred.
Ethanol production at high specific growth rates
Some clusters appeared bell or valley shaped, showing that
many transcripts did not follow a simple dependence on the
specific growth rate (Figure 2a, clusters 6 and 8-11). Genes in
clusters 8 and 10 exhibited an abrupt change in transcript
level at μ = 0.33 per hour, where the specific growth rate was
above the so-called 'critical dilution rate' (μ = 0.30 per hour)
at which the Crabtree effect sets in [26]. At this high specific
growth rate the cells change from a respiratory metabolism to
a mixed respiratory-fermentative metabolism, resulting in
ethanol production (2.4 ± 0.1 g/l). The change in metabolism
also correlated with induction of genes that are involved in
vesicle transport and glucose transport (Figure 2a, cluster 8)
and repression of genes that are involved in sporulation and
carboxylic acid metabolism (Figure 2a, cluster 10). Most
notable in the latter group were ICL1 and MLS1, which encode
the key enzymes in the glyoxylate shunt; ALD4 and ADH2,
which are involved in metabolism of ethanol; and FBP1 plus
PCK1, which encode key gluconeogenic enzymes. FBP1 and
PCK1 are previously reported to be subject to transcriptional
repression at high glucose concentrations, although the mode
of regulation is unclear because repression is not dependent
on the MIG1 and Ras/cAMP pathways [27]. These observa-
tions suggested that increased glucose uptake, together with
downregulation of genes that are involved in ethanol
catabolism, gluconeogenesis, and the glyoxylate shunt, could
be involved in a shift from pure respiratory metabolism to
mixed respiratory-fermentative metabolism at high growth
rates.
Chromosomal organization of growth rate regulated
genes
The cluster analysis also revealed that gene pairs had much
greater probability of being coexpressed than would be
expected if they were randomly distributed across the genome
(Figure 4a,b). The exception to this pattern was genes in one
of the upregulated clusters and genes that changed expres-
sion abruptly around the critical dilution rate of μ = 0.30 per
hour (clusters 1, 8, and 10); otherwise, all other clusters had
an over-representation of gene pairs or genes in close vicinity
to each other on the chromosomes.
Short chromosomal domains of coexpressed genes have pre-
viously been reported for S. cerevisiae and the Drosophila
genome [28,29]. It has been suggested that gene expression
within a chromosomal domain behaves as a 'square wave' (a
discrete opening of the chromatin gives the transcriptional
machinery increased access to several neighboring promot-
ers) [29,30]. Opening of the chromatin occurs when the
nucleosomes are remodeled by factors such as RAP1 [31] and
during DNA replication. We therefore speculated that the
Comparison between conditions with changes in growth rateFigure 3
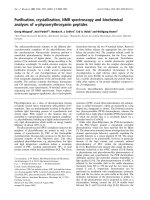
Comparison between conditions with changes in growth rate. From left to
right separated by blue, vertical lines: the fold change in transcript levels
between cells grown at lowest (average of μ = 0.02 and 0.05 per hour) and
the highest growth rate (average of 0.33 per hour); cells in lag phase (four
time points: 0, 0.01, 0.05, and 0.1 hours [5]); cells in postdiauxic phase
(eight time points: 36, 51, 62, 83, 107, 130, 178, and 212.25 hours [5]);
stress response, galactose (four time points: 20, 40, 60, and 140 min [6]);
and ESR transcript profiles (right of blue vertical line) and 13 stress
condition obtained from the work by Brown and coworkers (Figure 3 in
their report [7]). The approximately 900 ESR genes were originally
identified by hierarchical clustering of all yeast transcripts from 142
microarray experiments [7]. The transcripts formed two distinct clusters
of transcript that responded similarly to 13 stress condition, and the
corresponding genes were denoted the ESR genes [7]. Transcript levels
from all conditions are based on a global normalization of the DNA arrays,
in which it is assumed that the cellular mRNA levels remain constant in
response to stress or changes in the specific growth rate (also see
Additional data file 5). ESR, environmental stress response.
Decreasing growth rate
Post-diauxic phase
Lag phase
Stress response, galactose
Stress response
, glucose
R107.8 Genome Biology 2006, Volume 7, Issue 11, Article R107 Regenberg et al. />Genome Biology 2006, 7:R107
coexpression of growth-rate regulated genes (Figure 4a,b)
could be influenced by replication and tested if there was a
significant over-representation of these genes around the
replication origins. In S. cerevisiae, 429 replication origins
have been determined by chromosome immunoprecipitation
[32] and 332 origins have been found by replication timing
experiments [33]. Between these two sets, 294 replication ori-
gins were overlapping within 10 kilobases (kb) [34].
Comparing the chromosomal position of the growth-related
genes in clusters 1-13 (Figure 2) with the 294 replication ori-
gins revealed a positive correlation (P < 10
-3
) between the
genes and distance to the nearest replication origins. The
average distance for a gene in these clusters to the nearest
replication origins was 16.41 kb, whereas the average distance
expected by chance was 16.81 ± 0.15 kb (average/standard
deviation). Within the group of growth-regulated genes it was
observed that genes in downregulated cluster 13 were found
to be positioned closer to the replication origins than would
be expected by chance (Figure 5). The average distance for a
gene in cluster 13 to the nearest replication origins was 13.57
kb, whereas the average distance expected by chance was
16.43 ± 0.88 kb (average/standard deviation; P < 10
-3
). One
explanation for this phenomenon could be that some of the
genes in cluster 13 are direct neighbors to the replication ori-
gins, whereas the remaining ones are distributed on the chro-
mosomes as would be expected based on chance. Because of
the correlation between transcript profiles from different
growth rates and stress conditions (Figure 3), we speculated
that genes responding to stress, postdiauxic shift, and
stationary phase would also be closer to origins than expected
by chance (see Table S5 in the report by Radonjic and cowork-
ers [5], published elsewhere). Interestingly, this appeared to
be the case for genes with altered expression in response to
the stationary phase after diauxic shift (see Table S5 in the
report by Radonjic and coworkers [5], published elsewhere).
The average distance of the upregulated genes was 15.27 kb
whereas the average distance expected by chance was 16.81 ±
0.65 kb (P < 10
-2
). If growth-regulated genes are closer to the
replication origins, then it would be expected that non-
growth regulated genes are further away from the replication
origins. This indeed was also the case when comparing the
genes with marginal changes in expression under different
growth conditions (see cluster F in Figure 3 in the report by
Radonjic and coworkers [5], published elsewhere) to the posi-
tion of the replication origins (P < 10
-3
).
We also included a sensitivity analysis to evaluate the influ-
ence of the number of replication origins used in the analysis.
The sensitivity analysis showed that the P values decreased
with increasing number of replication origins (Additional
data file 4). The number of replication origins is based on two
datasets including 429 and 332 origins. Thus, the true
number of replication origins is expected to be higher than
294. If the true number of replication origins is higher then
the P values in the analysis are very conservative, and this
would add further confirmation of our conclusions.
Discussion
The present study shows that changes in specific growth rate
have profound and complex effects on gene expression in S.
cerevisiae. One of the clearest traits in the dataset is the grad-
ual upregulation of RP genes in response to higher specific
growth rates (Figure 2a and Table 1), and downregulation of
genes with the stress response element in their promoter. The
opposite effect is often found in transcription studies, where
the effects of stress are investigated. Exposure of yeast cells to
Chromosomal position of the genes in cluster 1Figure 4
Chromosomal position of the genes in cluster 1. Shown are genes at (a)
the chromosomal level and (b) at the local level between ORFs. The 16
chromosomes in panel (a) are shown in white and cluster members as
vertical black bars on the chromosomes. The length of the chromosomes
are scaled according to the number of ORFs on a given chromosome. (b)
The distance between ORFs from cluster 1 (x-axis) measured in number
of ORFs. The expected distance is shown with a red curve while the actual
distance between ORFs is shown with black bars. ORF, open reading
frame.
Number of ORFs
Chromosome
200 400 600
I
IV
VIII
XII
XVI
0 20 40
0
20
40
60
80
Distance between ORFs
Frequency
(b)
(a)
Observed
Expected
Genome Biology 2006, Volume 7, Issue 11, Article R107 Regenberg et al. R107.9
comment reviews reports refereed researchdeposited research interactions information
Genome Biology 2006, 7:R107
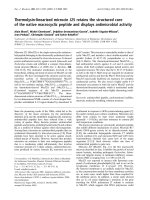
Chromosomal location of replication origins (blue replication origins) and ORFs from cluster 13 (red dots)Figure 5
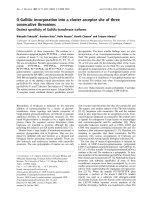
Chromosomal location of replication origins (blue replication origins) and ORFs from cluster 13 (red dots). A randomization test revealed that the average
ORFs are much closer to the replication origins than would be expected by chance. (a) The actual and expected average distance between ORFs and
replication origins are shown with red lines to the left and right, respectively. The variation of the expected distance is indicated with a black histogram.
(b) The genomic position of genes in cluster 13 (red dots) and replication origins (blue stars).
0 500 1000 1500
XVI
XV
XIV
XIII
XII
XI
X
IX
VIII
VII
VI
V
IV
III
II
I
Length of chromosome [kb]
emosomorhC
Cluster 13
Distance [kb]
Pr bobailityf uncti no
(a)
(b)
Distance [kb]
Replication origin
R107.10 Genome Biology 2006, Volume 7, Issue 11, Article R107 Regenberg et al. />Genome Biology 2006, 7:R107
seven types of stress [35], 11 environmental changes [7], lith-
ium [6], rapamycin [36], or the GCN pathway inducer 3-ami-
notriazole [37] led to reduced expression of RP genes and
induction of STRE genes covering a core of 1,000 ESR genes
[7]. The data presented here reveal that almost all ESR genes
respond similarly to stress and decreased growth rate.
Because conditions known to induce ESR genes often inhibit
growth [6,7,35], it is tempting to speculate that the growth
rate response and the stress response are regulated by a com-
mon component. A similar phenomenon has been reported
for Escherichia coli, for which the specific growth rate is
known to control the general stress response via the concen-
tration of the general stress response sigma factor RpoS [38].
In addition to the ESR genes, we found that another 2,000
genes were affected by changes in the specific growth rate.
These transcripts may witness a second slow response to
changes in the specific growth rate. Our experiments were
conducted in cells that had reached a physiologic steady state,
which was defined as five generations of growth without
changes in the measured biomass concentration, pH, carbon
dioxide, and oxygen values. The cells may thereby both go
through a rapid response to changes in the specific growth
rate, which simulates the stress response, and a slow response
that enables prolonged survival at a given specific growth
rate.
Besides specific transcription factors, chromosome organiza-
tion may also contribute to the regulation of the growth rate
regulated genes. This includes a location adjacent to the rep-
lication origins, as well as over-representation of coexpressed
gene pairs. These modes of regulation have until recently
been given little attention, because the gene order in the
eukaryotic cell has mostly appeared random compared with
the highly organized, polycistronic structures in bacteria [39].
This view has changed as whole-genome studies have shown
that some coregulated genes are colocated in the chromatin,
such as the yeast cell cycle regulated genes, in which genes in
the same phase are found to colocate in the chromatin
[20,28]. In yeast coregulated genes tend to be spaced in a
periodic pattern along the chromosome arms [40], support-
ing the view that higher order chromatin structures could
play a role in gene expression. Coexpression of gene pairs can
to some extent be explained by bidirectional promoters
[20,28]. However, convergent gene pairs, tandem pairs, and
longer stretches cannot be regulated by this mechanism
[20,28,41] but must be controlled at a higher level such as by
histone modifications. Candidates are histone acetylation
patterns that are known to correlate with blocks of coex-
pressed genes [42].
Histone modifications may also explain the co-occurrence of
replication origins and growth rate regulated genes. Histones
are removed from the chromatin by chromatin remodeling
factors (for example, RAP1 [31]), which open the chromatin
for transcription [43] as well as replication [44]. We found
that most RAP1 targets are positively regulated by growth
rate. In accordance with this observation and the role of RAP1
in replication, we also found growth rate regulated genes to be
located closer to the replication origins than would be
expected by chance (Figure 5). A signal for chromatin remod-
eling could be mediated by histone acetylation. Deletion of
the histone deacetylase gene, RPD3, has a positive effect on
both replication and transcription [45,46]. Acetylation of his-
tones around the replication origins leads to early replication
in the S phase [46]. Early replication [47] as well as RPD3
location are again known to correlate with high gene expres-
sion [48,49]. We therefore propose a model in which the his-
tone modifications around the replication origins change as a
function of the specific growth rate and thereby confer tran-
scriptional changes to the adjacent genes.
A caveat of our analysis is the fact that by using glucose limit-
ing cultures to control the specific growth rate, we also
slightly vary the glucose concentration in the medium. Part of
our findings may therefore be explained by the change in glu-
cose concentration. However, as most of our experiments
were carried out below the critical dilution rate (μ = 0.30 per
hour), at which the glucose concentration is too low to cause
repression (< 0.02 g/l), we are confident that the majority of
the observed effects are caused by the variation in the specific
growth rate. Four facts support our contention that the major
variant in the experiments is the growth rate. First, we identi-
fied RP genes, which are known to be induced under growth
via the growth-regulating TOR pathway [50]. Second, none of
the known consensus elements for glucose repression/induc-
tion were over-represented among genes with a positive
transcript profile, as would be expected if glucose should
affect expression below the critical dilution rate. This pertains
to MIG1 and RGT1, as well as to the HAP2/3/4/5 binding
sites. Third, only 117 genes exhibited a significant change in
transcript level when sugars (glucose and maltose) where
compared with C2 compounds (acetate and ethanol) in aero-
bic continuous cultivations at one specific growth rate [51].
Finally, we found almost complete overlap in affected genes
between the current data and data from cells changing growth
rate on the nonrepressive carbon source galactose (Figure 3).
Conclusion
We found that changing specific growth rates has a substan-
tial impact on transcript levels in the eukaryotic model S. cer-
evisiae. Varying the doubling time between 2 and 35 hours
affects the expression of half of the genes in the genome,
including most of the genes affected by stress. This finding
suggests that the growth rate may play a role in stress
response and that caution should be exercised when tran-
script data from cells under stress or mutants with different
growth rates are compared. Much of the transcriptional regu-
lation may be mediated via RAP1, the RRPE, and the stress
response element in promoters of the affected genes. Moreo-
ver, other effects such as coexpression of neighbouring genes
Genome Biology 2006, Volume 7, Issue 11, Article R107 Regenberg et al. R107.11
comment reviews reports refereed researchdeposited research interactions information
Genome Biology 2006, 7:R107
and the location of many genes adjacent to replication origins
also appear to play a role in regulation.
Materials and methods
Strain and continuous cultivations of S. cerevisiae
CEN.PK113-7D MATa was grown at dilution rates of 0.02,
0.05, 0.10 (in triplicate), 0.20 (in triplicate), 0.25, and 0.33
(in triplicate) per hour. The strain background and the aero-
bic continuous cultivations were described previously
[52,53].
DNA microarray analysis and data acquisition
The cRNA synthesis, hybridization to Affymetrix S98 arrays,
and scanning were performed as described previously [54]
with the only exception that the hybridization signal was not
amplified, because we found that this step conferred substan-
tial noise on the expression data. Affymetrix Microarray Suite
v5.0 (Affymetrix Inc., Santa Clara, CA, USA) was used to gen-
erate CEL files of the scanned DNA microarrays. The normal-
ized expression levels of the 9335 probe sets were
subsequently calculated using the Perfect Match model in
dChip v1.2 [55], and this dataset was used to extract the
expression level of 6091 annotated unique ORFs (updated
March, 2004) [56]. The data have been deposited at ArrayEx-
press [57] with the accession number E-MEXP-593.
Normalization
To compensate for a drop in the mRNA level at different
growth rates [58], we identified 42 ORFs that decreased line-
arly with specific growth rate (P < 0.05) with an average ratio
of 1.8, and we used this information to scale the dataset such
that the 42 selected ORFs had constant expression for all spe-
cific growth rates (Additional data files 1 and 5).
Consensus cluster analysis
For all experiments done in triplicates, the geometric average
was calculated as follows:
The transformed expression level (n = 1 N transcript index,
and m = 1 M chip index) was used for visualization:
Here is the average expression level for the nth transcript
and the denominator is the Euclidean norm over the M exper-
iments. Hence, the transformed transcript level Xnm is
confined to the interval [-1,1]. A value of 0 corresponds to the
mean average level over all six specific growth rates. The data-
set was clustered R = 31 × 50 = 1,550 times, K = 10 40 clus-
ters and 50 repetitions for each size, with the variational
Bayes mixture of Gaussians [59]. For each run r this gave a
cluster label matrix label(n,r), along with a likelihood, which
was used to calculate the co-occurrence matrix C
nn'
(i.e. the
empirical probability that two transcripts n and n' were in the
same cluster).
where δ (l,l') = 1 if l = l', and δ (l,l') = 0 otherwise [13-15]. Con-
trary to a distance matrix calculated directly in 'expression
level space', the 'consensus distance' D
nn'
= 1 - C
nn'
was not suf-
fering from outlier effects. Thus, based on the consensus dis-
tance, data could be clustered reliably with hierarchical
clustering using the Ward algorithm (Additional data files 2
and 3). Second, the likelihood was used to estimate the initial
number of clusters to 27 (number of leaves in the hierarchical
clustering). A thorough description of the cluster algorithm
and the biological validation for reducing the number of clus-
ters to 13 can be found in Additional data file 2 and in the
report by Grotkjær and coworkers [12].
Statistical tests
The expected distance between two coexpressed genes was
calculated by assuming that a given gene belongs to a given
cluster with probability P = Z/N. Here, Z is the number of
transcripts in the analyzed cluster, and N denotes the total
number of transcripts in the DNA microarray analysis found
in the systematic sequence of S288C (6081). The distance
between two genes belonging to the same cluster follows the
negative binomial distribution (r = 1, P = Z/N). Z genes
distributed on 16 chromosomes give rise to (Z - 16) intervals
between genes. Hence, the expected number of times, Z
D
, the
distance D between two co-expressed genes is encountered is
as follows:
The statistical significance between the position of replication
origins and ORFs in each cluster was determined by randomi-
zation tests. For all genes in a particular cluster, the average
distance between the start codon in base pairs to the nearest
of the 294 replication origins [34] was calculated. The average
distance for clusters with genes evenly distributed over all
chromosomes was repeatedly determined, and a P value (the
probability for observing the average distance in the cluster
by chance) was calculated. The number of replication origins
used in this study is less than the 429 replication origins
determined by chromosome immunoprecipitation [32] and
332 found by replication timing experiment [33]. A sensitivity
analysis revealed that the P value increased for less than 294
replication origins and so the calculated P values should be
considered conservative estimates.
YY
m
m
=
⎡
⎣
⎢
⎢
⎤
⎦
⎥
⎥
=
∏
1
3
13/
XYY YY
nm nm n nm n
m
M
=− −
=
∑
()/()
2
1
Y
n
C
R
label n r label n r
nn
r
R
′
=
=
′
()
∑
1
1
δ
( , ), ( , )
ZZ
Z
N
Z
N
D
D
=− −
⎛
⎝
⎜
⎞
⎠
⎟
()16 1
R107.12 Genome Biology 2006, Volume 7, Issue 11, Article R107 Regenberg et al. />Genome Biology 2006, 7:R107
The cumulated hypergeometric distribution was used to test
for over-representation of cluster members among both cell
cycle regulated genes and the transcription factor RAP1.
Here, X is the number of transcripts in each phase of the cell
cycle found by the cluster analysis and K is the total number
of analyzed ORFs in each phase of the cell cycle. N and Z are
defined as above. We tested over-representation and under-
representation of all 14 clusters in each phase of the cell cycle,
and corrected the P value for multiple testing [60], leading to
a cut-off of P < 0.01. Cell cycle regulated genes were compiled
by selecting genes appearing in at least two of four lists, one
containing genes known to be involved in the cell cycle based
on literature studies and three lists arising from independent,
numerical analyses [20-22]. A list of 5,421 overlapping genes
was compiled by comparing the current dataset with that
reported in the transcription factor binding study conducted
by Lee and coworkers [16]. The transcription factor RAP1 was
found to affect 288 genes (P < 0.01). The genes were distrib-
uted in the clusters as follows: clusters 1-7 contained 132
genes, the 'trash' cluster 101 genes, and other clusters 55
genes.
Additional data files
The following additional data are available with the online
version of this paper. Additional data file 1 is a table showing
the expression profiles (all specific growth rates) of the 6,091
annotated unique ORFs (including 'not physically mapped'
and 'not in systematic sequence of S288C' ORFs) from the
Saccharomyces Genome Database [56] (updated March
2004). Additional data file 2 is a document describing the
principles of the robust clustering method based on a Baye-
sian consensus mechanism. Additional data file 3 is a docu-
ment including results of the cluster analysis. Additional data
file 4 is a document showing the influence of the number of
replication origins on the P values when testing for correla-
tion between genes and their location with respect to the rep-
lication origins. Additional data file 5 is a document
describing the normalization with dChip and the subsequent
comparison with a whole genome study with external RNA
control as normalization reference.
Additional data file 1Table showing the expression profiles (all specific growth rates) of the 6,091 annotated unique ORFs (including 'not physically mapped' and 'not in systematic sequence of S288C' ORFs) from the Saccharomyces Genome Database [56] (updated March 2004)The expression profiles (all specific growth rates) of the 6,091 annotated unique open reading frames (ORFs; including 'not phys-ically mapped' and 'not in systematic sequence of S288C' ORFs) from the Saccharomyces Genome Database [56] (updated March 2004) can be viewed. Each gene can be selected by its name or, in case the gene has not been named, by its corresponding ORF name.Click here for fileAdditional data file 2Document describing the principles of the robust clustering method based on a Bayesian consensus mechanismDocument describing the principles of the robust clustering method based on a Bayesian consensus mechanism.Click here for fileAdditional data file 3Document including results of the cluster analysisDocument including results of the cluster analysis.Click here for fileAdditional data file 4Document showing the influence of the number of replication ori-gins on the P values when testing for correlation between genes and their location with respect to the replication originsDocument showing the influence of the number of replication ori-gins on the P values when testing for correlation between genes and their location with respect to the replication origins.Click here for fileAdditional data file 5Document describing the normalization with dChip and the subse-quent comparison with a whole genome study with external RNA control as normalization referenceDocument describing the normalization with dChip and the subse-quent comparison with a whole genome study with external RNA control as normalization reference.Click here for file
Acknowledgements
The authors would like to thank Eckhard Boles, Uffe H Mortensen, and
Kiran Patil for their useful comments on the manuscript. Lene Christiansen
and Jan von Köller are acknowledged for their contribution to the experi-
mental work. BR and TG would like to thank The Carlsberg Foundation,
The Danish Technical Research Council and Novozymes Bioprocess Acad-
emy for financial support. Part of this work has been financed by the Danish
Biotechnological Instrument Center.
References
1. Velculescu VE, Zhang L, Zhou W, Vogelstein J, Basrai MA, Bassett DE
Jr, Hieter P, Vogelstein B, Kinzler KW: Characterization of the
yeast transcriptome. Cell 1997, 88:243-251.
2. DeRisi JL, Iyer VR, Brown PO: Exploring the metabolic and
genetic control of gene expression on a genomic scale. Sci-
ence 1997, 278:680-686.
3. Martinez MJ, Roy S, Archuletta AB, Wentzell PD, Anna-Arriola SS,
Rodriguez AL, Aragon AD, Quinones GA, Allen C, Werner-Wash-
burne M: Genomic analysis of stationary-phase and exit in
Saccharomyces cerevisiae : gene expression and identification
of novel essential genes. Mol Biol Cell 2004, 15:5295-5305.
4. Wu J, Zhang N, Hayes A, Panoutsopoulou K, Oliver SG: Global
analysis of nutrient control of gene expression in Saccharo-
myces cerevisiae during growth and starvation. Proc Natl Acad
Sci USA 2004, 101:3148.
5. Radonjic M, Andrau JC, Lijnzaad P, Kemmeren P, Kockelkorn TT, van
Leenen D, van Berkum NL, Holstege FC: Genome-wide analyses
reveal RNA polymerase II located upstream of genes poised
for rapid responseupon S. cerevisiae stationary phase exit.
Mol Cell 2005, 18:171-183.
6. Bro C, Regenberg B, Lagniel G, Labarre J, Montero-Lomeli M, Nielsen
J: Transcriptional, proteomic, and metabolic responses to
lithium in galactose-grown yeast cells. J Biol Chem 2003,
278:32141-32149.
7. Gasch AP, Spellman PT, Kao CM, Carmel-Harel O, Eisen MB, Storz
G, Botstein D, Brown PO: Genomic expression programs in the
response of yeast cells to environmental changes. Mol Biol Cell
2000, 11:4241-4257.
8. Zhang L, Zhou W, Velculescu VE, Kern SE, Hruban RH, Hamilton SR,
Vogelstein B, Kinzler KW: Gene expression profiles in normal
and cancer cells. Science 1997, 276:1268-1272.
9. Rajasekhar VK, Holland EC: Postgenomic global analysis of
translational control induced by oncogenic signaling. Onco-
gene 2004, 23:3248-3264.
10. Hayes A, Zhang N, Wu J, Butler PR, Hauser NC, Hoheisel JD, Lim FL,
Sharrocks AD, Oliver SG: Hybridization array technology cou-
pled with chemostat culture: Tools to interrogate gene
expression in Saccharomyces cerevisiae. Methods 2002,
26:281-290.
11. Chervitz SA, Aravind L, Sherlock G, Ball CA, Koonin EV, Dwight SS,
Harris MA, Dolinski K, Mohr S, Smith T, et al.: Comparison of the
complete protein sets of worm and yeast: orthology and
divergence. Science 1998, 282:2022-2028.
12. Grotkjaer T, Winther O, Regenberg B, Nielsen J, Hansen LK: Robust
multi-scale clustering of large DNA microarray datasets
with the consensus algorithm. Bioinformatics 2006, 22:58-67.
13. Fred A, Jain AK: Data clustering using evidence accumulation.
In Proceedings of the 16th International Conference on Pattern Recognition:
11-15 August 2002; Quebec IEEE Computer Society; 2002:276-280.
14. Monti S, Tamayo P, Mesirov J, Golub T: Consensus clustering: a
resampling-based method for class discovery and visualiza-
tion of gene expression microarray data. Mach Learn 2003,
52:91-118.
15. Strehl A, Ghosh J: Cluster ensembles: a knowledge reuse
framework for combining multiple partitions. J Mach Learn Res
2003, 3:583-617.
16. Lee TI, Rinaldi NJ, Robert F, Odom DT, Bar-Joseph Z, Gerber GK,
Hannett NM, Harbison CT, Thompson CM, Simon I, et al.: Tran-
scriptional regulatory networks in Saccharomyces cerevisiae.
Science 2002, 298:799-804.
17. Lieb JD, Liu X, Botstein D, Brown PO: Promoter-specific binding
of Rap1 revealed by genome-wide maps of protein-DNA
association. Nat Genet 2001, 28:327-334.
18. Morse RH: RAP, RAP, open up! New wrinkles for RAP1 in
yeast. Trends Genet 2000, 16:51-53.
19. Guo J, Bryan BA, Polymenis M: Nutrient-specific effects in the
coordination of cell growth with cell division in continuous
cultures of Saccharomyces cerevisiae.
Arch Microbiol 2004,
182:326-330.
20. Cho RJ, Campbell MJ, Winzeler EA, Steinmetz L, Conway A, Wodicka
L, Wolfsberg TG, Gabrielian AE, Landsman D, Lockhart DJ, et al.: A
genome-wide transcriptional analysis of the mitotic cell
cycle. Mol Cell 1998, 2:65-73.
21. Zhao LP, Prentice R, Breeden L: Statistical modeling of large
microarray data sets to identify stimulus-response profiles.
Proc Natl Acad Sci USA 2001, 98:5631-5636.
P
K
i
NK
Zi
N
Z
i
X
=−
⎛
⎝
⎜
⎞
⎠
⎟
−
−
⎛
⎝
⎜
⎞
⎠
⎟
⎛
⎝
⎜
⎞
⎠
⎟
=
−
∑
1
0
1
Genome Biology 2006, Volume 7, Issue 11, Article R107 Regenberg et al. R107.13
comment reviews reports refereed researchdeposited research interactions information
Genome Biology 2006, 7:R107
22. Johansson D, Lindgren P, Berglund A: A multivariate approach
applied to microarray data for identification of genes with
cell cycle-coupled transcription. Bioinformatics 2003,
19:467-473.
23. Schmitt AP, McEntee K: Msn2p, a zinc finger DNA-binding pro-
tein, is the transcriptional activator of the multistress
response in Saccharomyces cerevisiae. Proc Natl Acad Sci USA
1996, 93:5777-5782.
24. Beck T, Hall MN: The TOR signalling pathway controls nuclear
localization of nutrient-regulated transcription factors.
Nature 1999, 402:689-692.
25. Masuda CA, Xavier MA, Mattos KA, Galina A, Montero-Lomeli M:
Phosphoglucomutase is an in vivo lithium target in yeast. J
Biol Chem 2001, 276:37794-37801.
26. Crabtree HG: Observations on the carbohydrate metabolism
in tumours. Biochem J 1929, 23:536-545.
27. Yin Z, Smith RJ, Brown AJ: Multiple signalling pathways trigger
the exquisite sensitivity of yeast gluconeogenic mRNAs to
glucose. Mol Microbiol 1996, 20:751-764.
28. Cohen BA, Mitra RD, Hughes JD, Church GM: A computational
analysis of whole-genome expression data reveals chromo-
somal domains of gene expression. Nat Genet 2000, 26:183-186.
29. Spellman PT, Rubin GM: Evidence for large domains of similarly
expressed genes in the Drosophila genome. J Biol 2002, 1:5.
30. Pokholok DK, Harbison CT, Levine S, Cole M, Hannett NM, Lee TI,
Bell GW, Walker K, Rolfe PA, Herbolsheimer E, et al.: Genome-
wide map of nucleosome acetylation and methylation in
yeast. Cell 2005, 122:517-527.
31. Yarragudi A, Miyake T, Li R, Morse RH: Comparison of ABF1 and
RAP1 in chromatin opening and transactivator potentiation
in the budding yeast
Saccharomyces cerevisiae. Mol Cell Biol
2004, 24:9152-9164.
32. Wyrick JJ, Aparicio JG, Chen T, Barnett JD, Jennings EG, Young RA,
Bell SP, Aparicio OM: Genome-wide distribution of ORC and
MCMproteins in S. cerevisiae : high-resolution mapping of
replication origins. Science 2001, 294:2357-2360.
33. Raghuraman MK, Winzeler EA, Collingwood D, Hunt S, Wodicka L,
Conway A, Lockhart DJ, Davis RW, Brewer BJ, Fangman WL: Repli-
cation dynamics of the yeast genome. Science 2001,
294:115-121.
34. Newlon CS, Theis JF: DNA replication joins the revolution:
whole-genome views of DNA replication in budding yeast.
Bioessays 2002, 24:300-304.
35. Causton HC, Ren B, Koh SS, Harbison CT, Kanin E, Jennings EG, Lee
TI, True HL, Lander ES, Young RA: Remodeling of yeast genome
expression in response to environmental changes. Mol Biol Cell
2001, 12:323-337.
36. Hardwick JS, Kuruvilla FG, Tong JK, Shamji AF, Schreiber SL:
Rapamycin-modulated transcription defines the subset of
nutrient-sensitive signaling pathways directly controlled by
the TOR proteins. Proc Natl Acad Sci USA 1999, 96:14866-14870.
37. Natarajan K, Meyer MR, Jackson BM, Slade D, Roberts C, Hinnebusch
AG, Marton MJ: Transcriptional profiling shows that Gcn4p is
a master regulator of gene expression during amino acid
starvation in yeast. Mol Cell Biol 2001, 21:4347-4368.
38. Ihssen J, Egli T: Specific growth rate and not cell density con-
trols the general stress response in Escherichia coli. Microbiol-
ogy 2004, 150:1637-1648.
39. Hurst LD, Pal C, Lercher MJ: The evolutionary dynamics of
eukaryotic gene order. Nat Rev Genet 2004, 5:299-310.
40. Kepes F: Periodic epi-organization of the yeast genome
revealed by the distribution of promoter sites. J Mol Biol 2003,
329:859-865.
41. Kruglyak S, Tang H: Regulation of adjacent yeast genes.
Trends
Genet 2000, 16:109-111.
42. Robyr D, Suka Y, Xenarios I, Kurdistani SK, Wang A, Suka N,
Grunstein M: Microarray deacetylation maps determine
genome-wide functions for yeast histone deacetylases. Cell
2002, 109:437-446.
43. Shore D, Nasmyth K: Purification and cloning of a DNA binding
protein from yeast that binds to both silencer and activator
elements. Cell 1987, 51:721-732.
44. Marahrens Y, Stillman B: A yeast chromosomal origin of DNA
replication defined by multiple functional elements. Science
1992, 255:817-823.
45. Hughes TR, Marton MJ, Jones AR, Roberts CJ, Stoughton R, Armour
CD, Bennett HA, Coffey E, Dai H, He YD, et al.: Functional discov-
ery via a compendium of expression profiles. Cell 2000,
102:109-126.
46. Vogelauer M, Rubbi L, Lucas I, Brewer BJ, Grunstein M: Histone
acetylation regulates the time of replication origin firing. Mol
Cell 2002, 10:1223-1233.
47. Hatton KS, Dhar V, Brown EH, Iqbal MA, Stuart S, Didamo VT, Schild-
kraut CL: Replication program of active and inactive multi-
gene families in mammalian cells. Mol Cell Biol 1988,
8:2149-2158.
48. Kurdistani SK, Grunstein M: Histone acetylation and deacetyla-
tion in yeast. Nat Rev Mol Cell Biol 2003, 4:276-284.
49. Kurdistani SK, Robyr D, Tavazoie S, Grunstein M: Genome-wide
binding map of the histone deacetylase Rpd3 in yeast. Nat
Genet 2002, 31:248-254.
50. Martin DE, Soulard A, Hall MN: TOR regulates ribosomal pro-
tein gene expression via PKA and the Forkhead transcrip-
tion factor FHL1. Cell 2004, 119:969-979.
51. Daran-Lapujade P, Jansen ML, Daran JM, Gulik WV, Winde JHD,
Pronk JT: Role of transcriptional regulation in controlling
fluxes in central carbon metabolism of Saccharomyces
cerevisiae, a chemostat culture study. J Biol Chem 2003,
279:9125.
52. van Dijken JP, Bauer J, Brambilla L, Duboc P, Francois JM, Gancedo C,
Giuseppin MLF, Heijnen JJ, Hoare M, Lange HC, et al.: An interlab-
oratory comparison of physiological and genetic properties
of four Saccharomyces cerevisiae strains. Enzyme Microb Technol
2000, 26:706-714.
53. Piper MD, Daran-Lapujade P, Bro C, Regenberg B, Knudsen S, Nielsen
J, Pronk JT: Reproducibility of oligonucleotide microarray
transcriptome analyses. An interlaboratory comparison
using chemostat cultures of Saccharomyces cerevisiae. J Biol
Chem 2002, 277:37001-37008.
54. Wodicka L, Dong H, Mittmann M, Ho MH, Lockhart DJ: Genome-
wide expression monitoring in Saccharomyces cerevisiae. Nat
Biotechnol 1997, 15:1359-1367.
55. Li C, Wong WH: Model-based analysis of oligonucleotide
arrays: Expression index computation and outlier detection.
Proc Natl Acad Sci USA 2001, 98:31-36.
56. Saccharomyces Genome Database [stge
nome.org]
57. ArrayExpress [ />58. van de Peppel J, Kemmeren P, van Bakel H, Radonjic M, van Leenen
D, Holstege FC: Monitoring global messenger RNA changes in
externally controlled microarray experiments. EMBO Rep
2003, 4:387-393.
59. Attias H: A variational Bayesian framework for graphical
models. In Adv Neur Info Proc Sys 12, Cambridge, MA MIT Press; 2000.
60. Hochberg Y, Benjamini Y: More powerful procedures for multi-
ple significance testing. Stat Med 1990, 9:811-818.
61. Dwight SS, Harris MA, Dolinski K, Ball CA, Binkley G, Christie KR,
Fisk DG, Issel-Tarver L, Schroeder M, Sherlock G, et al.: Saccharo-
myces
Genome Database (SGD) provides secondary gene
annotation using the Gene Ontology (GO). Nucleic Acids Res
2002, 30:69-72.
62. The Gene Ontology []
63. SGD Gene Ontology Term Finder [ />cgi-bin/SGD/GO/goTermFinder]
64. van Helden J, Andre B, Collado-Vides J: A web site for the compu-
tational analysis of yeast regulatory sequences. Yeast 2000,
16:177-187.
65. Regulatory Sequence Analysis Tools [ />