Báo cáo y học: "Reduced efficacy of selection in regions of the Drosophila genome that lack crossing over" doc
Bạn đang xem bản rút gọn của tài liệu. Xem và tải ngay bản đầy đủ của tài liệu tại đây (291.41 KB, 9 trang )
Genome Biology 2007, 8:R18
comment reviews reports deposited research refereed research interactions information
Open Access
2007Haddrillet al.Volume 8, Issue 2, Article R18
Research
Reduced efficacy of selection in regions of the Drosophila genome
that lack crossing over
Penelope R Haddrill
*
, Daniel L Halligan
*
, Dimitris Tomaras
*†
and
Brian Charlesworth
*
Addresses:
*
Institute of Evolutionary Biology, School of Biological Sciences, University of Edinburgh, Edinburgh, EH9 3JT, UK.
†
15 Smirnis St,
15669, Papagou, Athens, Greece.
Correspondence: Penelope R Haddrill. Email:
© 2007 Haddrill et al.; licensee BioMed Central Ltd.
This is an open access article distributed under the terms of the Creative Commons Attribution License ( which
permits unrestricted use, distribution, and reproduction in any medium, provided the original work is properly cited.
Less effective selection in the absence of crossing over<p>Observations from a genome-wide comparison of <it>Drosophila melanogaster </it>and <it>Drosophila yakuba </it>are consistent with a severe reduction in the efficacy of selection in the absence of crossing over, resulting in the accumulation of deleterious mutations in these regions.</p>
Abstract
Background: The recombinational environment is predicted to influence patterns of protein
sequence evolution through the effects of Hill-Robertson interference among linked sites subject
to selection. In freely recombining regions of the genome, selection should more effectively
incorporate new beneficial mutations, and eliminate deleterious ones, than in regions with low
rates of genetic recombination.
Results: We examined the effects of recombinational environment on patterns of evolution using
a genome-wide comparison of Drosophila melanogaster and D. yakuba. In regions of the genome with
no crossing over, we find elevated divergence at nonsynonymous sites and in long introns, a virtual
absence of codon usage bias, and an increase in gene length. However, we find little evidence for
differences in patterns of evolution between regions with high, intermediate, and low crossover
frequencies. In addition, genes on the fourth chromosome exhibit more extreme deviations from
regions with crossing over than do other, no crossover genes outside the fourth chromosome.
Conclusion: All of the patterns observed are consistent with a severe reduction in the efficacy of
selection in the absence of crossing over, resulting in the accumulation of deleterious mutations in
these regions. Our results also suggest that even a very low frequency of crossing over may be
enough to maintain the efficacy of selection.
Background
Patterns of molecular evolution can be profoundly different
between loci that differ in their recombinational environ-
ment. This is due to Hill-Robertson interference [1], whereby
any locus linked to another that is under directional selection
experiences a reduction in effective population size (N
e
).
Because the efficacy of selection on a mutation is a function of
the product of N
e
and the selection coefficient on a mutation
(s), this linkage affects the probability of fixation of a new
mutation [2]; favourable mutations are less likely to reach fix-
ation, whereas the opposite is true for deleterious mutations.
In other words, selection at one locus has the effect of increas-
ing the effects of genetic drift at another, linked locus. Recom-
bination reduces the effect of this interference, increasing N
e
and hence the efficacy of selection. We would therefore expect
higher levels of adaptation, and lower rates of fixation of
Published: 6 February 2007
Genome Biology 2007, 8:R18 (doi:10.1186/gb-2007-8-2-r18)
Received: 24 October 2006
Revised: 18 December 2006
Accepted: 6 February 2007
The electronic version of this article is the complete one and can be
found online at />R18.2 Genome Biology 2007, Volume 8, Issue 2, Article R18 Haddrill et al. />Genome Biology 2007, 8:R18
deleterious mutations, in genomic regions with high levels of
genetic recombination, as compared with regions with little
or no recombination [3,4].
Various studies have found evidence for such effects, prima-
rily in nonrecombining genomes or chromosomes. For exam-
ple, endosymbiotic bacteria experience small population sizes
and minimal rates of recombination, resulting in accumula-
tion of mildly deleterious mutations and possibly also
reduced rates of adaptation [5-7]. The neo-sex chromosomes
of Drosophila miranda have also provided compelling evi-
dence for the effects of Hill-Robertson interference, showing
elevated rates of fixation of deleterious mutations, and a
reduced rate of adaptive evolution on the nonrecombining
neo-Y chromosome, compared with the neo-X chromosome
[8-11]. In addition to studies examining rates of evolution in
nonrecombining chromosomes and genomes, investigation
of different recombinational environments within the same
genome or chromosome have proved fruitful. For example, in
two studies of different recombination regions in Drosophila,
Betancourt and Presgraves [12] and Presgraves [13] con-
cluded that recombination affects the efficiency of selection
on amino acid sequences, with reduced rates of adaptive evo-
lution in regions of low recombination; these also experience
higher frequencies of mildly deleterious segregating muta-
tions [13].
However, these two studies used samples that represent only
a small fraction of genes found in the Drosophila genome,
which may also be biased toward genes that are known to be
rapidly evolving, so that the results may not be entirely repre-
sentative of the genome as a whole. In addition, it is currently
unclear what proportion of amino acid differences between
species is the result of positive selection. Some studies have
found evidence that much protein evolution in Drosophila is
the result of positive selection [14-16], but the generality of
this result is still uncertain. The relative proportions of muta-
tions that are advantageous as opposed to deleterious will be
important in determining the influence of recombinational
environment on patterns of evolution. The genomes of a
number of Drosophila species have recently been sequenced,
or are in the process of being sequenced, so that genome-wide
comparisons are now possible. We use a dataset of more than
7,500 genes from D. melanogaster and the closely related
species D. yakuba to examine the effects of recombinational
environment on rates and patterns of evolution in coding and
noncoding sequences, and on measures of adaptation at the
molecular level.
Results
The final dataset consisted of 7,612 genes, divided into recom-
bination regions as follows: high crossover frequency (n =
3,859), intermediate crossover frequency (n = 2,555), low
crossover frequency (n = 1,111), and no crossing over (n = 87).
We also divided the no crossover category into fourth chro-
mosome (n = 67) and non-fourth chromosome genes (n =
20), in order to examine whether there are any differences
between no crossover genes on chromosomes with crossing
over, and genes on a chromosome that is entirely crossover
free. Sample sizes for the intron analyses were as follows:
10,407 in genes with high crossover frequency (6,474 short
[≤80 base pairs (bp)] and 3,933 long [>80 bp]); 6,965 in
genes with intermediate crossover frequency (4,445 short
and 2,520 long); 2,898 in genes with low crossover frequency
(1,800 short and 1,098 long); 218 in genes with no crossover
(120 short and 97 long); 181 in fourth chromosome genes (96
short and 85 long); and 37 in non-fourth chromosome, no
crossover genes (24 short and 13 long). We refer to crossing
over rather than recombination, because there is evidence
that gene conversion occurs in regions of the D. melanogaster
genome with very low or zero frequencies of crossing over
[17,18].
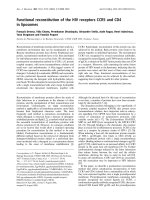
We found a highly significant effect of recombinational envi-
ronment on levels of the codon-based PAML measures of
sequence divergence (see Materials and methods, below) d
N
,
d
S
, and d
N
/d
S
(Kruskal-Wallis test: d
N
, H = 36.84, degrees of
freedom [df] = 3, P < 10
-4
; d
S
, H = 40.03, df = 3, P < 10
-4
; and
d
N
/d
S
, H = 38.16, df = 3, P < 10
-4
; Figure 1). The no crossover
region exhibits elevated levels of d
N
and d
N
/d
S
, with median
values being approximately double those found in other
recombination regions, and, surprisingly, a somewhat
reduced value for d
S
. To further investigate this, we used Ges-
timator (see Materials and methods, below) to calculate val-
ues of the nucleotide site based measures of divergence K
A
and K
S
. Although these results exhibit qualitatively the same
patterns as the d
N
and d
S
values, recombinational environ-
ment exhibited a significant effect only on K
A
values and not
on K
S
values (K
A
, H = 38.21, df = 3, P < 10
-4
; K
S
, H = 1.15, df =
3, P = 0.76; Figure 1).
Although pairwise tests indicate that there are some signifi-
cant differences in divergence measures between high, inter-
mediate, and low crossover regions (data not shown), the
magnitude of these differences is extremely small compared
with the difference between the no crossover region and the
rest of the genome (Figure 1). The no crossover region is
therefore the only region to show clear evidence of a distinctly
different rate of nonsynonymous evolution, and there is an
indication that it may also have a reduced rate of synonymous
evolution.
However, when we examined differences between the two
groups of genes within no crossover regions, namely the
fourth chromosome and non-fourth chromosome genes, we
found some surprising differences. Compared with the fourth
chromosome genes, the non-fourth chromosome genes
exhibit levels of nonsynonymous and synonymous evolution
that are closer to those of the high, intermediate, and low
crossover regions (Figure 1), and they are not significantly
different from these regions (Wilcoxon rank sum test on d
N
,
Genome Biology 2007, Volume 8, Issue 2, Article R18 Haddrill et al. R18.3
comment reviews reports refereed researchdeposited research interactions information
Genome Biology 2007, 8:R18
d
S
, d
N
/d
S
, K
A
, and K
S
; non-fourth versus high, intermediate
and low combined: P > 0.34 in all cases) or the fourth chro-
mosome genes (non-fourth versus fourth: P > 0.05 in all
cases).
We also examined three measures of codon usage bias: effec-
tive number of codons (ENC), the frequency of optimal
codons (Fop), and the GC content of the third position of
codons (GC3; see Materials and methods, below, and Table 1).
As expected from previous work [19,20], the no crossover
region shows almost no evidence of codon usage bias, with
elevated ENC and reduced Fop compared with the other
recombination regions. Interestingly, the non-fourth chro-
mosome genes within the no crossover category appear to
exhibit levels of codon usage bias intermediate between the
crossing over regions and the fourth chromosome genes.
Betancourt and Presgraves [12] found that Fop was strongly
negatively correlated with d
N
in their dataset but weakly pos-
itively correlated with d
S
. We find a significantly negative cor-
relation between Fop and d
N
in all recombination regions
(Spearman rank correlation [R
s
] with 95% confidence inter-
val [CI; obtained by bootstrapping across genes]: high cross-
over R
s
= -0.436, 95% CI = -0.463 to -0.409; intermediate
crossover R
s
= -0.476, 95% CI = -0.508 to -0.444; low crosso-
ver R
s
= -0.438, 95% CI = -0.487 to -0.383; no crossover R
s
=
-0.228, 95% CI = -0.435 to -0.042), although the relationship
is much weaker in the no crossover region. When the no
crossover region is divided into fourth and non-fourth chro-
mosome genes, the correlations are both still negative
although not significantly so (fourth chromosome R
s
= -
0.078, 95% CI = -0.346 to 0.166; non-fourth chromosome R
s
= -0.135, 95% CI = -0.616 to 0.350). However, the relation-
ship with d
S
is less clear; the correlations are not significantly
different from zero in high, intermediate, and no crossover
regions (high R
s
= -0.001, 95% CI = -0.031 to 0.034; interme-
diate R
s
= 0.018, 95% CI = -0.022 to 0.059; no R
s
= -0.076,
95% CI = -0.317 to 0.169), but significantly positive in low
crossover regions (low R
s
= 0.222, 95% CI = 0.165 to 0.284).
The fourth chromosome genes show a significantly negative
correlation between Fop and d
S
(R
s
= -0.283, 95% CI = -0.502
to -0.022)), whereas for non-fourth chromosome, no crosso-
ver genes the relationship is nonsignificantly positive (R
s
=
0.480, 95% CI = -0.013 to 0.776).
Because there has been some suggestion that comparisons of
estimates of d
S
from PAML can be misleading when there are
large differences in codon usage bias among genes [21], we
also examined the relationship between Fop and the nucle-
otide site-based estimators K
A
and K
S
. Consistent with Bierne
and Eyre-Walker [21], the results for K
A
agree very closely
with those for d
N
(high R
s
= -0.416, 95% CI = -0.442 to -0.386;
intermediate R
s
= -0.456, 95% CI = -0.487 to -0.424; low R
s
=
-0.404, 95% CI = -0.456 to -0.350; no R
s
= -0.240, 95% CI =
-0.425 to -0.010; fourth R
s
= -0.089, 95% CI = -0.332 to
0.142; non-fourth, no crossover R
s
= -0.123, 95% CI = -0.592
to 0.384). The correlation between Fop and K
S
, however, is
quite different from that between Fop and d
S
, being strongly
negative in all recombination regions except the no crossover
region, where the relationship is not significantly different
from zero (high R
s
= -0.377, 95% CI = -0.405 to -0.348; inter-
mediate R
s
= -0.392, 95% CI = -0.425 to -0.359; low R
s
= -
0.289, 95% CI = -0.338 to -0.227; no R
s
= 0.194, 95% CI = -
0.059 to 0.422; fourth R
s
= 0.096, 95% CI = -0.159 to 0.359;
non-fourth, no crossover R
s
= 0.358, 95% -0.118 to 0.743).
This is consistent with findings reported by Marais and cow-
orkers [22].
The no crossover region also has a much lower GC content at
third position sites (GC3) compared with regions with cross-
ing over (Table 1), as expected from the fact that preferred
codons in D. melanogaster and its relatives mostly end in G
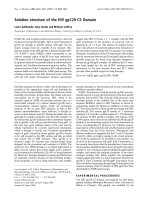
Notched box-plots of d
N
, d
S
, d
N
/d
S
, K
A
, K
S
and K
A
/K
S
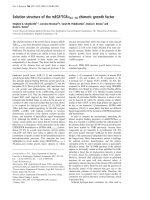
for each recombination regionFigure 1
Notched box-plots of d
N
, d
S
, d
N
/d
S
, K
A
, K
S
and K
A
/K
S
for each
recombination region. Shown are notched box-plots of d
N
, d
S
, d
N
/d
S
, K
A
,
K
S
and K
A
/K
S
for regions of high (H), intermediate (I), and low (L)
frequency of crossing over and regions of no crossing over, divided into
non-fourth chromosome genes (N
O
), fourth chromosome genes (N
4
), and
all no crossing over region genes (N
A
). The box extends from the lower
to the upper quartile, with a line in the middle at the median. The dotted
bars represent the 5th and 95th percentiles. The notches represent an
estimate of the uncertainty about the medians for box-to-box comparison;
when the notches for two samples do not overlap, the medians of the two
groups differ at the 5% significance level.
0.15
0.10
0.05
0.00
0.60
0.40
0.20
0.00
0.40
0.20
0.00
0.30
0.50
0.10
HILN
O
N
4
N
A
HI LN
O
N
4
N
A
d
N
K
A
d
S
K
S
d
N
/d
S
K
A
/K
S
R18.4 Genome Biology 2007, Volume 8, Issue 2, Article R18 Haddrill et al. />Genome Biology 2007, 8:R18
or C [23]. Again, mean GC3 for the non-fourth chromosome
genes in the no crossover category is intermediate between
the crossing over regions and the genes on the fourth chromo-
some. If selection for codon usage bias is virtually absent in
the no crossover region, then synonymous sites are likely to
be evolving close to neutrally. We might therefore expect the
GC content at third position sites in the no crossover regions
to be closer to equilibrium than in other recombination
regions (see Marais and Piganeau [19]).
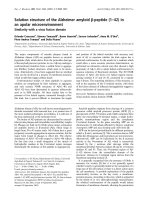
To examine this, we compared the GC3 values with the GC
content in noncoding regions. GC content was calculated for
intronic sites in all recombination regions, and the introns
were divided into short and long size classes, because these
are known to differ dramatically in their rates of evolution
[24,25]. Figure 2 and Additional data file 1 show the results of
this analysis. Interestingly, the mean GC3 value for the no
crossover region (0.39) is similar to the GC content of short
introns in other recombination regions (high 0.35, intermedi-
ate 0.35, low 0.39). Again, the GC contents of introns in the
non-fourth chromosome genes lie between those of the fourth
chromosome genes and the rest of the genome. Because short
introns represent a class of sites that are likely to be relatively
free from selective constraints [25], this suggests that the
base composition of third position sites in the no crossover
region are indeed closer to neutral equilibrium than those in
other recombination regions, as would be expected if the effi-
cacy of selection for codon usage bias were severely limited in
this region.
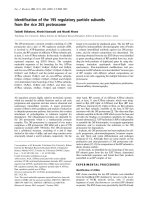
We also calculated divergence values for short and long
introns (omitting sequences that include splice sites) in the
different recombination regions, and these show some inter-
esting patterns (Figure 3 and Additional data file 1). Long
introns have much lower divergence than short introns, con-
firming the pattern previously reported between D. mela-
nogaster and D. simulans introns [24,25]. This pattern is
seen in high, intermediate, and low crossing over regions, but
not in the no crossover region, where long and short introns
exhibit almost identical levels of divergence. This is true when
we examine only the fourth chromosome genes; although the
non-fourth chromosome genes exhibit lower levels of diver-
gence in long introns than the fourth chromosome genes,
there is still a marked increase in intron divergence when
comparing regions with crossing over with non-fourth chro-
mosome, no crossover genes.
Previous work also identified a negative relationship between
intron length and divergence, and the same pattern is seen
here for high, intermediate, and low crossover regions, but
not for no crossover regions (Spearman rank correlation [R
s
]
with 95% CI [obtained by bootstrapping across introns]: high
R
s
= -0.465, 95% CI = -0.481 to -0.450; intermediate R
s
= -
0.383, 95% CI = -0.404 to -0.361; low R
s
= -0.322, 95% CI = -
Table 1
Measures of codon usage bias, GC content, and gene length in the different recombination regions
ENC Fop GC total GC3 Length
High 47.41 (47.23-47.62) 0.545 (0.542-0.547) 0.548 (0.546-0.549) 0.669 (0.666-0.672) 1517 (1477-1562)
Intermediate 48.57 (48.33-48.83) 0.532 (0.528-0.535) 0.541 (0.538-0.543) 0.655 (0.651-0.659) 1476 (1424-1520)
Low 47.86 (47.44-48.25) 0.548 (0.543-0.554) 0.549 (0.546-0.552) 0.672 (0.664-0.679) 1489 (1422-1556)
No (N
O
) 52.24 (49.69-54.42) 0.424 (0.378-0.467) 0.511 (0.466-0.547) 0.572 (0.495-0.638) 1238 (915-1590)
No (N
4
) 54.14 (53.43-54.82) 0.263 (0.251-0.276) 0.422 (0.411-0.432) 0.368 (0.354-0.383) 2692 (2053-3532)
No (N
A
) 53.70 (52.89-54.50) 0.300 (0.280-0.321) 0.432 (0.421-0.446) 0.393 (0.374-0.414) 2358 (1860-3016)
Values reported for ENC, Fop, GC total, and GC3 are means for all genes from D. melanogaster and D. yakuba combined (95% confidence interval).
Values for gene length are the mean number of base pairs in D. melanogaster for all constitutively spliced exons concatenated, for each gene (95%
confidence interval). The no crossing over region is divided as follows: N
O
, non-fourth chromosome genes; N
4
, fourth chromosome genes; and N
A
,
all no crossing over region genes. ENC, effective number of codons; Fop, frequency of optimal codons; GC3, GC content of the third position of
codons.
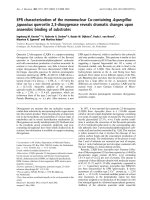
GC content of the third position of codons, short introns, and long introns for each recombination regionFigure 2
GC content of the third position of codons, short introns, and long
introns for each recombination region. GC content at the third position of
codons (GC3), short introns (≤80 base pairs [bp]) and long introns (>80
bp) for regions of high, intermediate and low frequency of crossing over
and regions of no crossing over. Values reported are means per site for all
introns from D. melanogaster and D. yakuba combined; error bars indicate
95% confidence interval (CI) obtained by bootstrapping by gene/intron.
0.00
0.10
0.20
0.30
0.40
0.50
0.60
0.70
0.80
HILN
O
N
4
N
A
Recombination category
GC3
Short
Long
GC content (+/– 95% CI)
Genome Biology 2007, Volume 8, Issue 2, Article R18 Haddrill et al. R18.5
comment reviews reports refereed researchdeposited research interactions information
Genome Biology 2007, 8:R18
0.355 to -0.287; no R
s
= 0.050, 95% CI = -0.095 to 0.188;
fourth R
s
= 0.111, 95% CI = -0.066 to 0.262; non-fourth, no
crossover R
s
= -0.209, 95% CI = -0.498 to 0.096). The corre-
lation is not significantly different from zero in no crossover
regions, and this is true even after using RepeatMasker to
mask any microsatellite and/or interspersed repeats (no R
s
=
0.018, 95% CI = -0.132 to 0.158; fourth R
s
= 0.085, 95% CI =
-0.074 to 0.251; non-fourth R
s
= -0.245, 95% CI = -0.529 to
0.080; proportion RepeatMasked, including splice sites: no =
0.254; fourth = 0.277; non-fourth, no crossover = 0.152). We
further examined this issue by estimating the linear regres-
sions of intron divergence on log intron length for each
recombinational environment, because these provide a quan-
titative estimate of the strength of the relationship; boot-
strapping was again used to assess significance. The
regression coefficients get closer to zero moving from high to
no crossover regions, and are significantly negative in high,
intermediate, and low crossover regions, but not in any of the
no crossover regions (regression coefficients: high = -0.0503,
95% CI = -0.0518 to -0.0488; intermediate = -0.0423, 95% CI
= -0.0448 to -0.0412; low = -0.0356, 95% CI = -0.0384 to -
0.0327; no = -0.0008, 95% CI -0.0089 to 0.0068; fourth =
0.0035, 95% CI = -0.0042 to 0.0123; non-fourth, no crosso-
ver = -0.0186, 95% CI = -0.0366 to 0.0001). The fact that the
regression coefficients are significantly different between
high, intermediate, low, and no crossover regions suggests
that the efficacy of selection decreases as recombination rate
decreases.
Finally, we examined gene length in all recombination
regions, because there is evidence suggesting that gene length
tends to increase when selective constraints are relaxed [26].
Consistent with this, there was a significant effect of recombi-
nation region on gene length (Kruskal-Wallis test: χ
2
= 16.71,
df = 3, P < 10
-3
; Table 1), with genes on the fourth chromo-
some being longer than those in high, intermediate, and low
crossover regions as well as non-fourth chromosome genes in
no crossover regions.
Discussion
One major conclusion from our analysis is that there is a
higher rate of nonsynonymous site evolution in the regions of
the Drosophila genome that apparently lack crossing over, as
compared with regions with low to high rates of crossing over
(Figure 1). We also found little evidence of differences in d
N
or
d
N
/d
S
between low, intermediate, and high crossover regions.
This contrasts with the results of Betancourt and Presgraves
[12] and Presgraves [13], who found higher nonsynonymous
divergence between D. melanogaster and D. simulans in
regions of high recombination when compared with the rest
of the genome. The reason for this difference is not entirely
clear, but it may reflect the fact that the previous studies were
based on relatively few genes. These might have included
some genes with unusually high rates of amino acid sequence
evolution in the high recombination regions. Consistent with
this possibility, Betancourt and Presgraves [12] and Pres-
graves [13] found a much higher mean ratio of nonsynony-
mous to synonymous divergence in high recombination
regions than in Figure 1. Marais and coworkers [22] also
failed to detect any evidence for a positive correlation
between the rate of crossing over and nonsynonymous
divergence in a comparison of D. melanogaster and a set of
cDNA sequences from D. yakuba; they used similar methods
to those of Betancourt and Presgraves [12] and Presgraves
[13] to estimate recombination rates, and so the difference in
conclusion is unlikely to reflect differences in methods
between studies. Rather, as pointed out by Marais and cow-
orkers [22], it is more likely to reflect a bias toward fast-evolv-
ing genes in these datasets.
Overall, our results fail to identify faster amino acid sequence
evolution in regions of high recombination, but rather they
suggest the opposite pattern. They are consistent with less
effective selection against weakly deleterious, nonsynony-
mous mutations when crossing over is effectively absent, as is
suggested by studies of the D. miranda neo-sex chromosome
system [10,11], and as is expected from increased Hill-Robert-
son effects when crossing over is rare or absent [3,4]. It is, of
course, conceivable that the no crossover regions experience
a faster rate of adaptive evolution of amino acid mutations,
but there is no theoretical basis for expecting this. We also
found a significant increase in divergence for long introns
(Figure 3) in the no crossover region compared with the rest
of the genome; recent studies [24,25] show that longer
introns are subject to greater selective constraints than short
ones, and so this observation is also consistent with a weak-
ening of selective constraints when recombination rates are
very low. Definitive proof of the inference of a relaxation of
purifying selection in no crossover regions would require
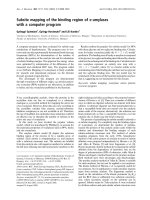
Divergence in short and long introns in each recombination regionFigure 3
Divergence in short and long introns in each recombination region.
Divergence between D. melanogaster and D. yakuba for short introns (≤80
base pairs [bp]) and long introns (>80 bp) for regions of high,
intermediate, and low frequency of crossing over, and regions of no
crossing over. Values reported are means per site, corrected for multiple
hits [50]. Error bars indicate 95% confidence interval (CI) obtained by
bootstrapping by intron.
0.00
0.05
0.10
0.15
0.20
0.25
0.30
0.35
0.40
HILN
O
N
4
N
A
Recombination category
Short
Long
Divergence (+/– 95% CI)
R18.6 Genome Biology 2007, Volume 8, Issue 2, Article R18 Haddrill et al. />Genome Biology 2007, 8:R18
comparisons of within-species polymorphism with between-
species divergence, as was done for the D. miranda neo-sex
chromosome system [11], but suitable data are not yet
available.
Another interesting aspect of the results is that the PAML
analysis suggests a lower d
S
in the no crossover region of the
genome, compared with other regions, although this is not
seen in the analysis of K
S
(Figure 1), and we also found a neg-
ative relation between Fop and K
S
, but not d
S
, in all but the no
crossover regions. This difference between the behavior of the
two estimators of synonymous divergence is similar to that
found by Bierne and Eyre-Walker [21]. If, as they suggest,
estimates of K
S
more accurately reflect divergence at synony-
mous sites when there are differences in codon usage, our
results suggest that selection for codon usage bias acts to
reduce divergence at these sites in high, intermediate, and
low recombination regions but that this effect is reduced in
the absence of crossing over. The K
S
values are thus likely to
provide a more reliable indicator of levels of divergence at
synonymous sites. For noncoding sites, only K
S
can be used;
the results show that divergence in short introns decreases
from high to no crossover regions (Figure 3), which is oppo-
site to what is seen for long introns.
There is a slight increase in GC content between high, inter-
mediate, and low crossover regions for short introns (Figure
2), so that the corresponding decrease in short intron diver-
gence might reflect differences in GC to AT mutational biases
among these regions, which can cause a negative relationship
between divergence and GC content [24]. However, there is a
large drop in GC content for short introns in no crossover
regions, coupled with a reduction in divergence, which cannot
be explained by the mutational bias hypothesis. One possibil-
ity is a weakly mutagenic effect of recombination processes,
as has been suggested for humans [27]. Ometto and cowork-
ers [28] report a similar pattern for long introns and other
noncoding sequences, for divergence between D. mela-
nogaster and D. simulans. The lack of a similar effect on K
S
for synonymous sites may reflect the fact that the efficacy of
selection on codon usage appears to be drastically reduced in
the no crossover regions; this would allow a higher rate of
synonymous substitutions [21], counter-acting any effect of
reduced recombination on mutation rates.
There has been some controversy over the negative correla-
tion between GC content/codon usage and rate of crossing
over in the D melanogaster genome, which has been reported
in previous studies. Marais and coworkers [19,29,30] argued
that this correlation mainly reflects the effect of differences in
mutational bias and/or the rate of biased gene conversion
(BGC) in favor of GC versus AT, which should affect puta-
tively neutral noncoding sequences, whereas Kliman and Hey
[20] and Hey and Kliman [31] argued for an effect of reduced
recombination on the efficacy of selection. These analyses
used longer introns to estimate the effects of mutational bias
and BGC, on the grounds that these are less likely to be
affected by selective constraints on splice sites and hence
evolve neutrally. As we have seen, this assumption is probably
incorrect. Our results for short introns outside the no crosso-
ver regions show, if anything, the opposite pattern to that
expected based on the BGC hypothesis, because for short
introns there is a slight decrease in divergence and increase in
GC content between high and low crossover regions. Long
introns exhibit almost no differences in GC content moving
from high to low crossover regions, but they show a slight
increase in divergence. Their GC content drops substantially
in the no crossover regions. This behavior of the GC content
of long introns is similar to that reported by Kliman and Hey
[20]. Long introns, but not short ones, exhibit a large increase
in divergence in the no crossover regions (Figure 3), which is
consistent with a relaxation of selective constraints. GC con-
tent at third coding positions is still higher than for introns,
even in the no crossover regions (Figure 2), suggesting that
there is still some selection in favor of preferred codons in
these regions.
Overall, these patterns suggest that selective constraints on
weakly deleterious amino acid mutations, mutations to non-
preferred codons, and weakly deleterious mutations in long
introns are reduced in genomic regions where crossing over is
virtually absent, but they are little affected by rates of crossing
over in other regions. One caveat concerning our conclusions
is that the recombinational landscape may well differ between
D. melanogaster and D. yakuba, for which there is some evi-
dence [32]. As described in Materials and methods (below),
we have attempted to eliminate genes that differ between the
species with respect to their location in telomeric and centro-
meric regions, where crossing over is absent or greatly
reduced [22]. However, we cannot exclude smaller differ-
ences between species in recombination patterns. Such dif-
ferences may be why there is little or no effect of crossing over
rate in regions of low to high recombination, despite the fact
that these are known to show clear patterns with respect to
neutral diversity in D. melanogaster [13,28]. D. mela-
nogaster might have only relatively recently evolved low
recombination over more extensive regions than in its com-
mon ancestor with D. yakuba. Because codon usage, GC
content, and divergence must change over longer time scales
than neutral diversity within species, this could account for
the discrepancy between the pattern for diversity and the
other statistics.
The other possibility is that there is a strongly nonlinear effect
of recombination on Hill-Robertson effects. This does not
seem likely for either selective sweep or background selection
processes [33,34], but it does apply to Muller's ratchet [35]
and Hill-Robertson interference among groups of weakly
selected sites [36]. However, it is unclear whether these
effects would be strong enough to explain the patterns that we
observe.
Genome Biology 2007, Volume 8, Issue 2, Article R18 Haddrill et al. R18.7
comment reviews reports refereed researchdeposited research interactions information
Genome Biology 2007, 8:R18
There is a general tendency for the effects that we detect to
involve primarily differences between chromosome four and
the rest of the genome, such that effects on genes with no
crossing over that are located on other chromosomes appear
to be weak or absent (Table 1 and Figures 1, 2, 3). This may
well reflect the fact that the fourth chromosome is a block of
more than 80 genes that fail to crossover with each other,
whereas there are much smaller numbers of genes in the no
crossover regions of the other chromosomes. There is thus
much less opportunity for enhanced Hill-Robertson effects
on the latter. It is noteworthy that this difference between the
fourth chromosome and other no crossover regions is most
marked for the rate of nonsynonymous substitution, for
which selective constraints are likely to be stronger and hence
more resistant to a moderate reduction in effective popula-
tion size [34]. Alternatively, this pattern may reflect the fact
that, although chromosome four has a stable history of no
crossing over, it is unclear whether this is true of the no cross-
over regions on other chromosomes (see above).
There is one other apparent anomaly in the results, which at
first sight is difficult to explain. This is the extreme reduction
in GC content of short introns in the no crossover regions
(Figure 2), to a mean level that is lower than that of long
introns, despite the evidence for a reduced effectiveness of
selection in these regions. This may reflect a drastic reduction
in the intensity or efficacy of BGC in favor of GC in this region,
because this would be the only deterministic force affecting
neutral sequences, whereas long introns and synonymous
sites are subject to both selection and BGC. This is seemingly
inconsistent with the similarity in divergence for long and
short introns in the no crossover regions. However, with very
weak selection there can be interactions between mutational
bias and the product of effective population size and selection
coefficient, causing substitution rates to be almost flat or even
increase with N
e
s in regions where N
e
s is very small [34,37-
39]. Thus, it is theoretically possible for long introns to be
under effectively stronger selection than short introns, but to
show the same or even higher levels of divergence in no cross-
over regions.
Conclusion
We have examined the effect of recombinational environ-
ment, in terms of the frequency of crossing over, on the rates
of nonsynonymous and synonymous evolution, codon usage
bias, and evolution of noncoding DNA. Although we find only
very small differences between regions of high, intermediate,
and low crossing over frequency, the absence of crossing over
appears to have a profound effect on patterns of molecular
evolution. The no crossover regions exhibit elevated levels of
nonsynonymous evolution, a virtual absence of codon usage
bias, and similar levels of divergence for short and long intron
size classes. These patterns are all consistent with a dramatic
reduction in the efficacy of selection in the absence of crossing
over, as a result of greatly enhanced effects of Hill-Robertson
interference.
Materials and methods
Fourth chromosome data
FlyBase [40] was used to download a list of all D. mela-
nogaster genes with cytological map locations in bands 101
and 102. The genome annotation for each of these genes was
examined, and any genes without expressed sequence tag or
cDNA hits, or without any genome annotation, were elimi-
nated. For the remaining genes, decorated fasta files contain-
ing coding regions were downloaded from FlyMine [41].
Where genes are not alternatively spliced, the entire coding
region was used in the analysis. For genes that are alterna-
tively spliced, only constitutively spliced exons were used.
Exons were also eliminated if they overlapped with coding
sequence on the opposite strand. Homologous sequences
from D. yakuba were found using BLAST searches on the
DroSpeGe website [42], and individual exons aligned by eye
using Sequencher (Gene Codes, Ann Arbor, MI, USA). Exons
were then concatenated and a fasta file containing the entire
coding region for both species was exported for each locus.
These fasta files were then aligned and analyzed as described
below for the non-fourth chromosome data.
Non-fourth chromosome data
In order to generate alignments of constitutively spliced
exons from coding sequences between D. melanogaster and
D. yakuba, we used a modified version of the methods
described by Halligan and Keightley [25]. This involved
obtaining a list of all currently annotated D. melanogaster
genes from NCBI's Entrez Gene (using release 4.1 of the D.
melanogaster genome), giving a total of 14,183 annotations.
From this list, RNA genes and poorly annotated genes were
excluded by examining the Flybase synopsis report for each
gene, and excluding genes that were based on BLASTX data
or gene prediction data only. Genbank format files were then
downloaded for the remaining genes (including all annotated
spliceforms), to give a dataset of 11,267 Genbank files. We
extracted all annotated exons for a randomly chosen splice-
form from each gene and used a reciprocal best-hits BLAST
approach to identify and extract orthologous exons from the
November 2005 freeze of the D. yakuba genome sequence
(Genome Sequencing Center, Washington University School
of Medicine, St Louis, MI, USA. Short exons (<40 bp) were
joined, where possible, to an adjacent section of noncoding
DNA (either intronic or intergenic) prior to BLASTing, to
increase the chance of a reciprocal best-hit. We used the loca-
tions of the orthologous exons in the draft D. yakuba genome
sequence to retrieve the orthologous intron sequences.
Introns were only retrieved if two adjacent D. melanogaster
exons were identified on the same strand and same contig in
the D. yakuba genome.
R18.8 Genome Biology 2007, Volume 8, Issue 2, Article R18 Haddrill et al. />Genome Biology 2007, 8:R18
Coding sequences (formed by concatenating the retrieved
exons from the chosen spliceform) from both species were
aligned using the amino acid alignment obtained from CLUS-
TALW [43]. Genes were removed from the data set if the cod-
ing sequence was invalid in either species. A coding sequence
was considered to be valid if it started with a start codon,
ended with a stop codon, was a multiple of 3 bp in length, and
contained no internal stop codons. We removed exons that
were not constitutively spliced (not present in every anno-
tated spliceform) from the coding sequences and ensured that
the remaining exons were in frame and a multiple of 3 bp in
length. Introns were initially aligned using MAVID [44] and
were subsequently realigned at a finer scale using MCALIGN2
[45] by splitting the MAVID alignments into sections of
approximately 500 bp at regions of high homology (>8 bp
runs of ungapped matches). Introns were removed from the
dataset if the sequence in either species did not start and end
with a 2 bp consensus sequence ('AT', 'GT', or 'GC' at the 5'
end and 'AG' at the 3' end). All alignments (both intronic and
coding) with fewer than 10 valid bases (A, T, G, or C) or fewer
than 20 valid/invalid bases (A, T, G, C, or N) in either species
were discarded. Any clearly nonhomologous sections were
masked from all alignments (defined as regions where diver-
gence was above 0.25 within a 40 to 60 bp sliding window).
Estimating measures of divergence and codon usage
bias
Maximum-likelihood estimates of d
N
and d
S
for each gene
were obtained using Codeml in the PAML package [46], using
runmode = -2. Because estimates of d
N
/d
S
are likely to be
unreliable for very short genes, alignments less than 150 bp
(50 codons) in length were removed. We also used Gestima-
tor [47], which implements the method of Comeron [48], to
calculate values of K
A
and K
S
. Estimates of ENC and Fop were
calculated using codonw [49]. GC content was estimated both
for the entire coding sequence and for the third positions of
codons only (GC3). We also estimated GC content and diver-
gence (corrected for multiple hits [50]) in introns, following
removal of 8 bp/30 bp at the beginning/end of the introns to
exclude any sites that may be subject to selective constraints
[25].
Recombination regions
The entire dataset was sorted according to cytologic map loca-
tion, and was divided into groups with high, intermediate,
and low frequencies of crossing over, and a group with no
crossing over, based on the regions described by Charles-
worth [51] (Additional data file 2). In addition to this, data
from a number of cytologic bands were eliminated from the
analysis, as described by Marais and coworkers [22]. This
removes genes in telomeric and centromeric polytene bands
that have shifted in position between D. melanogaster and D.
yakuba, and hence will have experienced a major change in
recombinational environment.
Additional data files
The following additional data files are available with the
online version of this article. Additional data file 1 contains
information on mean values of GC content and divergence for
short and long intron classes in the different recombination
regions. Additional data file 2 contains information on the
division of data into recombination classes based on cytologic
location.
Additional data file 1Information on mean values of GC content and divergence for short and long intron classes in the different recombination regionsInformation on mean values of GC content and divergence for short and long intron classes in the different recombination regionsClick here for fileAdditional data file 2Information on the division of data into recombination classes based on cytologic locationInformation on the division of data into recombination classes based on cytologic locationClick here for file
Acknowledgements
We gratefully acknowledge that the D. yakuba data used in this study were
produced by the Genome Sequencing Center at Washington University
School of Medicine in St. Louis. We thank Andrea Betancourt, Casey Berg-
man, Kelly Dyer, Bill Hill, John Welch, and two anonymous reviewers for
useful comments and discussions. This work was supported by a Wellcome
Trust VIP Award to PRH; DLH is supported by the Wellcome Trust and
BC by the Royal Society.
References
1. Hill WG, Robertson A: The effect of linkage on the limits of
artificial selection. Genet Res 1966, 8:269-294.
2. Kimura M: The Neutral Theory of Molecular Evolution Cambridge: Cam-
bridge University Press; 1983.
3. Gordo I, Charlesworth B: Genetic linkage and molecular
evolution. Curr Biol 2001, 11:R684-R686.
4. Marais G, Charlesworth B: Genome evolution: recombination
speeds up adaptive evolution. Curr Biol 2003, 13:R68-R70.
5. Moran NA: Accelerated evolution and Muller's ratchet in
endosymbiotic bacteria. Proc Natl Acad Sci USA 1996,
93:2873-2878.
6. Wernegreen JJ, Moran NA: Evidence for genetic drift in endo-
symbionts (Buchnera): analyses of protein-coding genes. Mol
Biol Evol 1999, 16:83-97.
7. Fry AJ, Wernegreen JJ: The roles of positive and negative
selection in the molecular evolution of insect
endosymbionts. Gene 2005, 355:1-10.
8. Bachtrog D, Charlesworth B: Reduced adaptation of a non-
recombining neo-Y chromosome. Nature 2002, 416:323-326.
9. Bachtrog D: Adaptation shapes patterns of evolution on sex-
ual and asexual chromosomes in Drosophila. Nat Genet 2003,
34:215-219.
10. Bachtrog D: Sex chromosome evolution: molecular aspects of
Y-chromosome degeneration in Drosophila. Genome Res 2005,
15:1393-1401.
11. Bartolomé C, Charlesworth B: Evolution of amino acid
sequences and codon usage on the Drosophila miranda neo-
sex chromosomes. Genetics 2006, 174:2033-2044.
12. Betancourt AJ, Presgraves DC: Linkage limits the power of nat-
ural selection in
Drosophila. Proc Natl Acad Sci USA 2002,
99:13616-13620.
13. Presgraves DC: Recombination enhances protein adaptation
in Drosophila melanogaster. Curr Biol 2005, 15:1651-1656.
14. Bierne N, Eyre-Walker A: The genomic rate of adaptive amino
acid substitution in Drosophila. Mol Biol Evol 2004, 21:1350-1360.
15. Andolfatto P: Adaptive evolution of non-coding DNA in Dro-
sophila. Nature 2005, 437:1149-1152.
16. Welch JJ: Estimating the genomewide rate of adaptive protein
evolution in Drosophila. Genetics 2006, 173:821-837.
17. Langley CH, Lazzaro BP, Phillips W, Heikkinen E, Braverman JM:
Linkage disequilibria and the site frequency spectra in the
su(s) and su(w
a
) regions of the Drosophila melanogaster X
chromosome. Genetics 2000, 156:1837-1852.
18. Jensen MA, Charlesworth B, Kreitman M: Patterns of genetic var-
iation at a chromosome 4 locus of Drosophila melanogaster
and D. simulans. Genetics 2002, 160:493-507.
19. Marais G, Piganeau G: Hill-Robertson interference is a minor
determinant of variations in codon bias across Drosophila
melanogaster and Caenorhabditis elegans genomes. Mol Biol
Evol 2002, 19:1399-1406.
20. Kliman RM, Hey J: Hill-Robertson interference in Drosophila
Genome Biology 2007, Volume 8, Issue 2, Article R18 Haddrill et al. R18.9
comment reviews reports refereed researchdeposited research interactions information
Genome Biology 2007, 8:R18
melanogaster: reply to Marais, Mouchiroud and Duret. Genet
Res 2003, 81:89-90.
21. Bierne N, Eyre-Walker A: The problem of counting sites in the
estimation of the synonymous and nonsynonymous substitu-
tion rates: implications for the correlation between the syn-
onymous substitution rate and codon usage bias. Genetics
2003, 165:1587-1597.
22. Marais G, Domazet-Losos T, Tautz D, Charlesworth B: Correlated
evolution of synonymous and nonsynonymous sites in Dro-
sophila. J Mol Evol 2004, 59:771-779.
23. Akashi H: Synonymous codon usage in Drosophila mela-
nogaster: natural selection and translational accuracy. Genet-
ics 1994, 136:927-935.
24. Haddrill PR, Charlesworth B, Halligan DL, Andolfatto P: Patterns of
intron sequence evolution in Drosophila are dependent upon
length and GC content. Genome Biology 2005, 6:R67.
25. Halligan DL, Keightley PD: Ubiquitous selective constraints in
the Drosophila genome revealed by genome-wide interspe-
cies comparison. Genome Res 2006, 16:875-884.
26. Akashi H: Molecular evolution between Drosophila mela-
nogaster and D. simulans: reduced codon bias, faster rates of
amino acid substitution, and larger proteins in D.
melanogaster. Genetics 1996, 144:1297-1307.
27. Hellmann I, Ebersberger I, Ptak SE, Paabo S, Przeworski M: A neutral
explanation for the correlation of diversity with recombina-
tion rates in humans. Am J Hum Genet 2003, 72:1527-1535.
28. Ometto L, Stephan W, De Lorenzo D: Insertion/deletion and
nucleotide polymorphism data reveal constraints in Dro-
sophila melanogaster introns and intergenic regions. Genetics
2005, 169:1521-1527.
29. Marais G, Mouchiroud D, Duret L: Does recombination improve
selection on codon usage? Lessons from nematode and fly
complete genomes. Proc Natl Acad Sci USA 2001, 98:5688-5692.
30. Marais G, Mouchiroud D, Duret L: Neutral effect of recombina-
tion on base composition in Drosophila. Genet Res 2003,
81:79-87.
31. Hey J, Kliman RM: Interactions between natural selection,
recombination and gene density in the genes of Drosophila.
Genetics 2002, 160:595-608.
32. True JR, Mercer JM, Laurie CC: Differences in crossover fre-
quency distribution among three sibling species of Dro-
sophila. Genetics 1996, 142:507-523.
33. Kim Y: Effect of strong directional selection on weakly
selected mutations at linked sites: implication for synony-
mous codon usage. Mol Biol Evol 2004, 21:286-294.
34. McVean GAT, Charlesworth B: A population genetic model for
the evolution of synonymous codon usage: patterns and
predictions. Genet Res 1999, 74:145-158.
35. Charlesworth D, Morgan MT, Charlesworth B: Mutation accumu-
lation in finite outbreeding and inbreeding populations. Genet
Res 1993, 61:39-56.
36. McVean GA, Charlesworth B: The effects of Hill-Robertson
interference between weakly selected mutations on pat-
terns of molecular evolution and variation. Genetics 2000,
155:929-944.
37. Eyre-Walker A: The effect of constraint on the rate of evolu-
tion in neutral models with biased mutation. Genetics 1992,
131:233-234.
38. Takano-Shimizu T: Local recombination and mutation effects
on molecular evolution in
Drosophila. Genetics 1999,
153:1285-1296.
39. Kondrashov FA, Ogurtsov AY, Kondrashov AS: Selection in favor
of nucleotides G and C diversifies evolution rates and levels
of polymorphism at mammalian synonymous sites. J Theor
Biol 2006, 240:616-626.
40. FlyBase: A database of the Drosophila genome [http://
www.flybase.org]. Release 4
41. FlyMine: An integrated database for Drosophila and Anophe-
les genomics []
42. DroSpeGe: Drosophila Species Genomes BLAST [http://
insects.eugenes.org/species/blast]
43. Thompson JD, Higgins DG, Gibson TJ: CLUSTAL W: improving
the sensitivity of progressive multiple sequence alignment
through sequence weighting, position-specific gap penalties
and weight matrix choice. Nucleic Acids Res 1994, 22:4673-4680.
44. Bray N, Patcher L: MAVID: constrained ancestral alignment of
multiple sequences. Genome Res 2004, 14:693-699.
45. Wang J, Keightley PD, Johnson T: MCALIGN2: faster, accurate
global pairwise alignment of non-coding DNA sequences
based on explicit models of indel evolution. BMC Bioinformatics
2006, 7:292.
46. Yang Z: PAML: a program package for phylogenetic analysis
by maximum likelihood. Comput Appl Biosci 1997, 13:555-556.
47. Gestimator [ />gestimator.1.html]
48. Comeron JM: A method for estimating the numbers of synon-
ymous and nonsynonymous substitutions per site. J Mol Evol
1995, 41:1152-1159.
49. CodonW: Correspondence analysis of codon usage [http://
codonw.sourceforge.net/]
50. Kimura M: A simple method for estimating evolutionary rates
of base substitutions through comparative studies of nucle-
otide substitutions. J Mol Evol 1980, 16:
111-120.
51. Charlesworth B: Background selection and patterns of genetic
diversity in Drosophila melanogaster. Genet Res 1996,
68:131-149.