Báo cáo y học: "Kappa-alpha plot derived structural alphabet and BLOSUM-like substitution matrix for rapid search of protein structure database" ppsx
Bạn đang xem bản rút gọn của tài liệu. Xem và tải ngay bản đầy đủ của tài liệu tại đây (1.41 MB, 16 trang )
Genome Biology 2007, 8:R31
comment reviews reports deposited research refereed research interactions information
Open Access
2007Tunget al.Volume 8, Issue 3, Article R31
Method
Kappa-alpha plot derived structural alphabet and BLOSUM-like
substitution matrix for rapid search of protein structure database
Chi-Hua Tung
¤
*
, Jhang-Wei Huang
*
and Jinn-Moon Yang
¤
*†‡
Addresses:
*
Institute of Bioinformatics, National Chiao Tung University, 75 Po-Ai Street, Hsinchu, 30050, Taiwan.
†
Department of Biological
Science and Technology, National Chiao Tung University, 75 Po-Ai Street, Hsinchu, 30050, Taiwan.
‡
Core Facility for Structural Bioinformatics,
National Chiao Tung University, 75 Po-Ai Street, Hsinchu, Taiwan.
¤ These authors contributed equally to this work.
Correspondence: Jinn-Moon Yang. Email:
© 2007 Tung et al.; licensee BioMed Central Ltd.
This is an open access article distributed under the terms of the Creative Commons Attribution License ( which
permits unrestricted use, distribution, and reproduction in any medium, provided the original work is properly cited.
BLASTing protein structure databases<p>3D BLAST, a novel protein structure database search tool, is a useful tool for analysing novel structures, capable of returning a list of aligned structures ordered according to E-values.</p>
Abstract
We present a novel protein structure database search tool, 3D-BLAST, that is useful for analyzing
novel structures and can return a ranked list of alignments. This tool has the features of BLAST (for
example, robust statistical basis, and effective and reliable search capabilities) and employs a kappa-
alpha (κ, α) plot derived structural alphabet and a new substitution matrix. 3D-BLAST searches
more than 12,000 protein structures in 1.2 s and yields good results in zones with low sequence
similarity.
Background
A major challenge facing structural biology research in the
postgenomics era is to discover the biologic functions of genes
identified by large-scale sequencing efforts. As protein struc-
tures increasingly become available and structural genomics
research provides structural models in genome-wide strate-
gies [1], proteins with unassigned functions are accumulat-
ing, and the number of protein structures in the Protein Data
Bank (PDB) is rapidly rising [2]. The current structure-func-
tion gap highlights the need for powerful bioinformatics
methods with which to elucidate the structural homology or
family of a query protein by known protein sequences and
structures.
Numerous sequence alignment methods (for instance
BLAST, SSEARCH [3], SAM [4], and PSI-BLAST [5]) and
structure alignment methods (for instance, DALI [6], CE [7],
and MAMMOTH [8]) have been demonstrated to identify
homologs of newly determined structures. Sequence align-
ment methods are rapid but frequently unreliable in detecting
the remote homologous relationships that can be suggested
by structural alignment tools; also, although the latter may be
useful, they are slow at scanning homologous structures in
large structure databases such as PDB [2]. Various tools
including ProtDex2 [9], YAKUSA [10], TOPSCAN [11], and
SA-Search [12] have recently been developed to search pro-
tein structures quickly. TOPSCAN, SA-Search, and YAKUSA
describe protein structures as one-dimensional sequences
and then use specific sequence alignment methods to replace
BLAST for aligning two structures, because BLAST needs a
specific substitution matrix for a new alphabet. Many of these
methods have been evaluated based on the performance of
two structure alignments but not on the performance of the
database search. Additionally, none of these methods pro-
vides a function analogous to the E value of BLAST (which is
probably the most adopted database search tool by biologists)
for investigating the statistical significance of an alignment
'hit'.
Published: 3 March 2007
Genome Biology 2007, 8:R31 (doi:10.1186/gb-2007-8-3-r31)
Received: 21 November 2006
Revised: 5 January 2007
Accepted: 3 March 2007
The electronic version of this article is the complete one and can be
found online at />R31.2 Genome Biology 2007, Volume 8, Issue 3, Article R31 Tung et al. />Genome Biology 2007, 8:R31
The three-state secondary elements, namely α-helix, β-sheet,
and coils, are rather crude for predicting protein structure,
and it is not possible to make use of these elements in three-
dimensional (3D) reconstruction without additional informa-
tion. Many approaches have been proposed to replace three-
state secondary structure descriptions with various local
structural fragments, also known as a 'structural alphabet'
[13-19], which can redefine not only regular periodic struc-
tures but also their capping areas. Such studies have
described local protein structures according to various geo-
metric descriptors (for example, C
α
coordinates, C
α
distances,
α or φ, and ψ dihedral angles) and algorithms (for example,
hierarchical clustering, empirical functions, and hidden
Markov models [HMMs] [12]). Many of these methods
involve protein structure prediction; an exception is the SA-
Search tool [12], which is based on C
σ
coordinates and C
α
dis-
tances, and which adopts a structural alphabet and a suffix
tree approach for rapid protein structure searching.
To address the above issues, we have developed a novel
kappa-alpha (κ, α) plot derived structural alphabet and a
novel BLOSUM-like substitution matrix, called SASM (struc-
tural alphabet substitution matrix), for BLAST [5], which
searches in a structural alphabet database (SADB). This
structural alphabet is valuable for reconstructing protein
structures from just a small number of structural fragments
and for developing a fast structure database search method
called 3D-BLAST. This tool is as fast as BLAST and provides
the statistical significance (E value) of an alignment, indicat-
ing the reliability of a hit protein structure. For the purposes
of scanning a large protein structure database, 3D-BLAST is
fast and accurate and is useful for the initial scan for similar
protein structures, which can be refined by detailed structure
comparison methods (for example, CE and MAMMOTH).
To the best of our knowledge, 3D-BLAST is the first tool that
permits rapid protein structure database searching (and pro-
vides an E value) by using BLAST, which searches a SADB
database with a SAMS matrix. The SADB database and the
SASM matrix improve the ability of BLAST to search for
structural homology of a query sequence to a known protein
structure or a family of proteins. This tool searches for the
structural alphabet high-scoring segment pairs (SAHSPs)
that exist between a query structure and each structure in the
database. Experimental results reveal that the search accu-
racy of 3D-BLAST is significantly better than that of PSI-
BLAST [5] at 25% sequence identity or less.
Results and discussion
(κ, α) Plot and structural alphabet
A pair database comprising 674 structural pairs (Additional
data file 1), each with a high structural similarity and low
sequence identity, was derived from the SCOP classification
database [20] for the (κ, α) plot (Figure 1a,b). Each structure
in this database (1,348 proteins) was divided into a series of
3D protein fragments (225,523 fragments), each five residues
long, using κ and α angles. The angle κ, ranging from 0° to
180°, of residue i is a bond angle formed by three C
α
atoms of
residues i - 2, i, and i + 2. The angle α, ranging from -180° to
180°, of a residue i is a dihedral angle formed by the four C
α
atoms of residues i - 1, i, i + 1, and i + 2. Each structure has a
specific (κ, α) plot (Figure 1a) when governed by these two
angles. For instance, a typical (κ, α) plot (blue diamond) of an
all-β protein (human anti-HIV-1 GP120-reactive antibody
E51, PDB code 1RZF-L [21]) is significantly different from
that (red cross) of an all-α protein (human hemoglobin, PDB
code 1J41-A [22]). Conversely, two similar protein structures
have similar (κ, α) plots.
An accumulated (κ, α) plot (Figure 1b) consisting of 225,523
protein fragments was obtained from this pair database. The
plot is split into 648 cells (36 × 18) when the angles of κ and
α are divided by 10°. In the accumulated (κ, α) plot, most of
the α-helix segments are located on four cells in which the α
angle ranges from 40° to 60°, and the κ angle ranges from
100° to 120°. In contrast, the κ angle of most of the β-strand
segments ranges from 0° to 30°, and the α angle ranges from
-180° to -120°, or 160° to 180°. The number of 3D segments
in each cell ranges from 0 to 22,310, and the color bar on the
right side presents the distribution scale. Based on the defini-
tions in the DSSP program [23] the numbers of α-helix and β-
strand segments are 82,482 (36.6%) and 52,371 (23.3%),
respectively. Most 3D segments in the same cell in this plot
have similar 3D shapes, that is, a root mean square deviation
(rmsd) below 0.3 Å on five contiguous C
α
atom coordinates.
Moreover, the conformations of 3D segments located in adja-
cent cells are often encoded into similar structural letters
which have more similar 3D structures than those in distant
cells (Figures 1b,c). Hence, the (κ, α) plot is helpful for clus-
tering these 3D segments to determine a representative seg-
ment for each cluster.
Based on the (κ, α) plot and a new nearest neighbor clustering
(see Materials and methods, below), a new 23-state structural
alphabet was derived to represent the profiles of most 3D
fragments, and was roughly categorized into five groups (Fig-
ure 2a and Additional data file 2): helix letters (A, Y, B, C, and
D), helix-like letters (G, I, and L), strand letters (E, F, and H),
strand-like letters (K and N), and others. The 3D shapes of
representative segments in the same category are similar;
conversely, the shapes of different categories are significantly
different. For instance, the shapes of representative 3D seg-
ments in the helix letters are similar to each other, as are
those in strand alphabets. In contrast, the shapes of helix let-
ters and strand letters obviously differ. The average structural
distance (determined from the rmsd value of five continuous
C
α
atom positions between a pair of 5-mer segments) of
intersegments in both helix and strand letters is less than 0.4
Å (Figure 1c), and is much less that those of other letters in the
structural alphabet. Additionally, most α-helix secondary
structures based on the definition of the DSSP program are
Genome Biology 2007, Volume 8, Issue 3, Article R31 Tung et al. R31.3
comment reviews reports refereed researchdeposited research interactions information
Genome Biology 2007, 8:R31
encoded as helix or helix-like alphabets, and none are
encoded as strand or strand-like alphabets (Figure 2b). Con-
versely, most β-strand segments are encoded as strand or
strand-like letters (Additional data file 3).
All residues were fairly restricted in their possibilities in the
(κ, α) plot (Figure 1b). The proportion of cells with 0 seg-
ments, which were encoded as structural letter 'Z', was 28.2%
(183 cells among 648). Additionally, the numbers of cells and
segments with structural letter 'Z' were 272 (42.0% [272/
648]) and 989 (0.4% [989/225,523]), respectively. Restated,
only 0.44% segments were widely distributed in 41.98% of
cells. If the segments of a new protein structure are located on
these 41.98% cells, then they may be regarded as poor struc-
tural segments. Conversely, five helix letters (A, Y, B, C, and
D) and three strand letters (E, F, and H) were located in seven
and 30 cells (Figure 1b), respectively. The total number of
segments located in these 37 (4.4%) cells was 75,477 (33.5%).
The (κ, α) plot is similar to a Ramachandran plot, based on
the following observations. First, the α-helices are located in
very restricted areas, in which α ranges from 40° to 60°, and
κ ranges from 100° to 120°. Additionally, β-sheet segments
are restricted to some regions in the (κ, α) plot. All residues
are fairly restricted in their possibilities in both plots. Second,
angles φ and ψ in the Ramachandran plot, denoting a protein
structure with a series of 3D positions of amino acids, are
widely adopted to develop various structural segments
(blocks). Here, the (κ, α) plot was utilized to develop a struc-
tural alphabet, which represents a protein structure as a
series of 3D protein fragments, each of which are five residues
long. The angles φ and ψ represent the position relationship
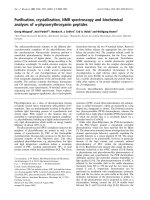
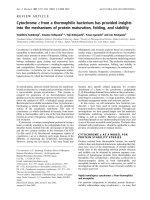
The (κ, α) plot and the distribution of the 23-state structural alphabetFigure 1
The (κ, α) plot and the distribution of the 23-state structural alphabet. (a) The typical (κ, α) plots of an all-α protein (Protein Data Bank [PDB] code 1J41-
A; red) and an all-β protein (PDB code 1RZF-L; blue). (b) The distribution of accumulated (κ, α) plot of 225,523 segments derived from the pair database
with 1,348 proteins. This plot, which comprises 648 cells (36 × 18), is clustered into 23 groups, and each cell is assigned a structure letter. (c) The average
intrasegment (blue) and intersegment root mean square deviation (rmsd) values of the 23-state structural alphabet.
ZZZZZZZZZZZZZZZZZZZZZZZZZZZZZZZZZZZZ
ZZZZZZZZZZZZZZZZZZZZZZZZZZZZZZZZZZZZ
ZZZZZZZZZZZZZZZZZZZZZZZZZZZZZZZZZZZZ
ZZZZZZZZZZZZZZZZZZLZZZZZZZZZZZZZZZZZ
ZZZZZZZZSSSSSWWLWLLLLLI I LZZZZZZZZZZZ
ZZZZZZSSSSSSWWWWWWLLLLLI I LLLRZZZZZZZ
ZZ ZZ ZSSSSSSSSWWWWWWWL DACI I LL QRRZZZZZ
ZZZSSSSSSSSSSWWWVVVVMDDBDLQQQQQRZZZZ
QSSSSSSSSSSVVVVVVVVVVMGGGGQQQQQQQQZZ
PPSSSSTTTTTTTVVVVVVVVMGMGGQQQQQQQQRQ
PPPPPPTTTTTTVVVVVVVMM
MMMMQQQ
QQQRRQP P
PPPPPTTTTTTTTTVVVVVXMXMMMMXXXRRRRRPP
PPPPTTTTNNNTXXXXXXXXXXXXXXXXXXXXXRRP
NPTTTNNKKKKKKKXKXXXXZXXXXXXXXXXXXNNN
HNNNKKKKKKKKKZZZZZZZZZZZZXZXXXXXHHHH
HHHKFFKKKKKZZZZZZZZZZZZZZZZZXXXXHHHH
EEEFFFKKZZZZZZZZZZZZZZZZZZZZZXXXXNHH
EEFFFFZZZZZZZZZZZZZZZZZZZZZZZZZZNNHH
Alpha
Kappa
0
0.5
1
1.5
2
2.5
A&Y
B
C
D
E
F
G
H
I
K
L
M
N
P
Q
R
S
T
V
W
X
Z
Structural alphabet
RMSD (Å)
Intra
Inter
0
30
60
90
120
150
180
-180 -120 -60 0 60 120 180
Alpha
Kappa
1RZF-L
1J41-A
(b)
(c)
(a)
R31.4 Genome Biology 2007, Volume 8, Issue 3, Article R31 Tung et al. />Genome Biology 2007, 8:R31
of two contiguous amino acids, whereas the angles κ and α
represent the position relationship of five amino acids. These
observations indicate that the (κ, α) plot is an effective means
of both developing short sequence structure motifs and
assessing the quality of a protein structure.
Reconstructing protein
A greedy algorithm and the evaluation criteria (global-fit
score) presented by Kolodny and coworkers [15] were applied
to measure the performance of 23-state structural alphabet
(structural segments) in reconstructing the α-β-barrel pro-
tein (PDB code 1TIM-A [15,24]) and 38 structures (Additional
data file 4) selected from the SCOP-516 set, which comprises
516 proteins. This greedy algorithm reconstructs the protein
in increasingly large segments using the best structural frag-
ment, namely the one whose concatenation produces a struc-
ture with the minimum rmsd from the corresponding
segment in the protein from 23 structural segments. No
energy minimization procedure was utilized to optimize the
reconstructing structures in this study. The global rmsd val-
ues were from 0.58 Å to 2.45 Å, and the average rmsd value
was 1.15 Å for these 38 proteins. Figure 3a,b illustrate the
reconstructed structures of the α-β-barrel protein and ribo-
nucleotide reductase (PDB code 1SYY-A [25]), respectively.
The C
α
carbon rmsd values were 0.80 Å (1TIM-A) and 0.63 Å
(1SYY-A) between the X-ray structures (red) and recon-
structed proteins (green). The reconstructed structures are
frequently close to the X-ray structures on both α-helix and β-
sheet segments, and the loop segments account for the main
differences. If all representative segments (465 segments) of
the non-zero cells in the (κ, α) plot were considered when
reconstructing structures, then the global rmsd values would
be in the range 0.35 to 2.32 Å, and the average rmsd value
would be 0.94 Å.
The 23-state structural alphabet should be able to represent
more biologic meaning than standard three-state secondary
structural alphabets. First, the classic regular zones of three-
state secondary structures are flexible structures. For
instance, α-helices may be curved [26] and more than one-
quarter of them are irregular [27], and the φ and ψ dihedral
angles of β-sheets are widely dispersed. The proposed 23-
state alphabet describes α-helices with eight segments (five
helix letters and three helix-like letters) and β-sheets with five
segments (Figure 2a). Figure 3 reveals that the 23 structural
segments performed well in reconstructing protein struc-
tures, particularly in the structure segments of classic α-heli-
ces and β-sheets. Second, the three-state secondary structure
cannot represent the large conformational variability of coils.
Nonetheless, some similar structures can be identified for
many of the protein fragments, such as β-turns [28], π-turns,
and β-bulges [29]. Here, 10 structural segments in the 23-
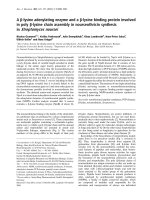
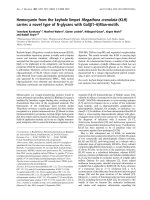
The relationship between the 23-state structural alphabet and three-state secondary elementsFigure 2
The relationship between the 23-state structural alphabet and three-state secondary elements. (a) The three-dimensional (3D) segment conformations of
the five main classes of the 23-state structural alphabet, including helix letter (A, Y, B, C, and D), helix-like letters (G, I, and L), strand letters (E, F, and H),
strand-like letters (K and N), and others (Additional data file 2). The shapes of the segments in the same category are similar to each other. (b) The
distributions of the 23-state structural alphabet on 82,482 α-helix segments, 52,371 β-strand segments, and the 66,503 coil segments defined by the DSSP
program.
Helix-likeHelix
Strand-likeStrand
0
5,000
10,000
15,000
20,000
25,000
A&Y
B
C
D
G
I
L
E
F
H
K
N
M
P
Q
R
S
T
V
W
X
Z
Frequence
0
5,000
10,000
15,000
A&Y
B
C
D
G
I
L
E
F
H
K
N
M
P
Q
R
S
T
V
W
X
Z
Frequence
0
2,000
4,000
6,000
8,000
10,000
A&Y
B
C
D
G
I
L
E
F
H
K
N
M
P
Q
R
S
T
V
W
X
Z
Frequence
α-helix (H,G and I in DSSP)
β-strand (E and B in DSSP)
Other DSSP codes
(b)
(a)
Genome Biology 2007, Volume 8, Issue 3, Article R31 Tung et al. R31.5
comment reviews reports refereed researchdeposited research interactions information
Genome Biology 2007, 8:R31
state alphabet were utilized to describe the loop conforma-
tions. An analysis using the PROMOTIF [30] tool reveals that
most of the segments (>80%) in the letter 'W' are β-turns.
Protein structure database search
In a structural database search, 3D-BLAST identifies the
known homologous structures and determines the evolution-
ary classification of a query structure from an SADB database
(Additional data file 5). Users input a PDB code with a protein
chain (for example, 1GR3-A) or a domain structure with a
SCOP identifier (for example, d1gr3a_). When the query has
a new protein structure, the 3D-BLAST tool enables users to
input the structure file in the PDB format. The tool returns a
list of protein structures that are similar to the query, ordered
by E values, within several seconds. When we searched data-
bases such as SCOP [20] or CATH [31], which are based on
structural classification schemes, the evolutionary classifica-
tion (family/superfamily) of the query protein was based on
the first structure in the 3D-BLAST hit list.
The main advantages of 3D-BLAST using BLAST as a search
tool include robust statistical basis, effective and reliable
database search capabilities, and established reputation in
biology. However, the use of BLAST in protein structure
search has several limitations, namely the need for an SADB
database, a new SASM matrix, and a new E value threshold to
show the statistical significance of an alignment hit. These
issues are described in the following subsections.
SADB databases and test data sets
A SADB database was easily derived from a known protein
structure database based on the (κ, α) plot and the structural
alphabet. We created five SADB databases derived from the
following protein structure databases PDB; a nonredundant
PDB chain set (nrPDB); all domains of SCOP1.69 [20];
SCOP1.69 with under 40% identity to each other; and
SCOP1.69 with under 95% identity to each other.
The SCOP-516 query protein set, which has a sequence iden-
tity below 95% selected from the SCOP database [20], was
chosen to measure the utility of 3D-BLAST for the discovery
of homologous proteins of a query structure. This set contains
516 query proteins that are in SCOP 1.69 but not in SCOP 1.67,
and the search database was SCOP 1.67 (11,001 structures).
The total number of alignments was 5,676,516 (516 × 11,001).
For evolutionary classification, the first position of the hit list
of a query was treated as the evolutionary family/superfamily
of this query protein. For comparison with related work on
rapid database searching, 3D-BLAST was also tested on a
dataset of 108 query domains, termed SCOP-108 (Additional
data file 6), proposed by Aung and Tan [9]. These queries,
which have under 40% sequence homology to each other,
were chosen from medium-sized families in SCOP. The
search database (34,055 structures) represents most domains
in SCOP 1.65. Finally, the utility of 3D-BLAST for 319 struc-
tural genomics targets was analyzed; the search database was
SCOP 1.69, with under 95% identity to each other.
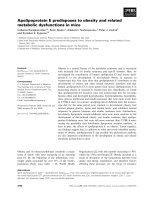
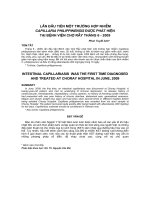
Reconstruction protein structures using the 23-state structural alphabetFigure 3
Reconstruction protein structures using the 23-state structural alphabet. Reconstruction of the (a) α-β-barrel protein (Protein Data Bank [PDB] code
1TIM-A [24]) and (b) ribonucleotide reductase (PDB code 1SYY-A [25]). The α-carbon root mean square deviation (rmsd) between the X-ray structures
(red) and reconstructed proteins (green) are 0.80 Å (1TIM-A) and 0.63 Å (1SYY-A), respectively.
(a) (b)
R31.6 Genome Biology 2007, Volume 8, Issue 3, Article R31 Tung et al. />Genome Biology 2007, 8:R31
Here, several common metrics (precision, recall, and receiver
operating characteristic [ROC] curve) were utilized to assess
the predicted quality of a search method on database search-
ing. Precision is defined as A
h
/T
h
and recall is defined as A
h
/
A, where A
h
is the number of true hit domains in the hit list,
T
h
is the total number of domain proteins in the hit list, and A
is total number of true hits in the database. The ROC curve
plots the sensitivity (recall) against 1.0 - specificity (false-pos-
itive rate). The average precision is defined as
, where is the number of compounds in a
hit list containing i correct domains.
Structural alphabet substitution matrix (SASM)
A substitution matrix is an essential component when BLAST
is used to search a structural database quickly. A new BLO-
SUM-like substitution matrix, called SASM (Figure 4), was
developed by using a method similar to that used to construct
BLOSUM62 [32] based on the pair database. The SASM (23 ×
23) provides insight into substitution preferences for 3D seg-
ments between homologous structures with low sequence
identity.
The SASM matrix presents good relationships between bio-
logic functions and protein structures. The highest substitu-
tion score in SASM represents the alignment of an alphabet
'W' with an alphabet 'W', in which the conformations of seg-
ments are similar β-turns. Substitution scores are high when
two identical structural alphabets (for example, diagonal
entries) are aligned. For instance, the alignment scores of
aligning 'I' and 'S' to themselves are 9 and 8, respectively.
Most substitution scores are positive when two structural
alphabets in the same category, for example helix alphabets
(/)/iT A
i
A
h
i
=
∑
1
T
h
i
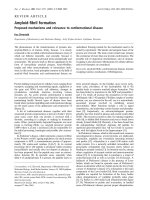
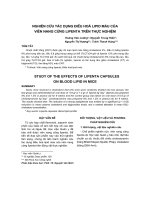
Structural alphabet substitution matrix (SASM)Figure 4
Structural alphabet substitution matrix (SASM). The SASM is a BLOSUM-like substitution matrix for determining aligned scores for the 3D-BLAST tool, as
BLOSUM matrix used in BLAST. The scores are high if the same letters (those on the main diagonal) or letters in the same category (those near the main
diagonal) are aligned. In contrast, the scores are low when two letters with different properties are aligned.
AYBCDE F HG I LKNT P SWXVMRQZ
A 53222
-12 -12
-9-1-2 0 -8-7-7-7-5-4-6-6-3-5-3-4
Y 35232
-15 -10 -10
-1 -2 -1 -8 -8 -7 -7 -5 -6 -7 -7 -3 -5 -3 -4
B 22522
-12 -10 -10
1 -2-2-7-7-6-6-5-4-6-5-2-5-3-4
C 23251
-11
-9-9-1 1 -1-8-7-7-6-5-5-6-6-3-5-3-4
D 22215
-10
-9 -9 1 0 1 -6 -5 -5 -5 -4 -1 -4 -4 -1 -4 -2 -3
E
-12-15-12-11-10
6 1 2 -8-9-8-2-1-4-4-8-6-3-4-6-6-7-3
F
-12 -10 -10
-9 -9 1 6 0 -6 -7 -7 1 -1 -3 -3 -6 -5 -2 -4 -4 -4 -5 -2
H -9
-10 -10
-9-9 2 0 6 -5-6-6-1 2 -3-2-6-4 0 -3-4-2-4-2
G -1-1 1 -1 1 -8-6-5 7 0 -1-4-4-3-3-3-1-2-1 2 -2 1 -2
I -2 -2 -2 1 0 -9 -7 -6 0 9 3 -5 -3 -4 -4 -2 2 -3 -3 -1 -2 -1 -2
L 0 -1-2-1 1 -8-7-6-1 3 7 -6-5-3-4-1 3 -4-2-2-1-1-1
K -8-8-7-8-6-2 1 -1-4-5-6 6 1 -1-3-4-4-1-2-3-4-4 0
N -7 -8 -7 -7 -5 -1 -1 2 - 4 -3 -5 1 6 1 1 -3 -3 0 -1 -3 0 -2 0
T -7 -7 -6 -7 -5 -4 -3 -3 -3 -4 -3 -1 1 6 1 0 -1 -1 0 -2 -1 -2 -2
P -7 -7 -6 -6 -5 -4 -3 -2 -3 -4 -4 -3 1 1 7 0 -2 -2 -2 -3 1 -2 -1
S -5 -5 -5 -5 -4 -8 -6 -6 -3 -2 -1 -4 -3 0 0 8 2 -3 -1 -4 -2 -2 -2
W -4 -6 -4 -5 -1 -6 -5 -4 -1 2 3 -4 -3 -1 -2 2 11 -2 2 -1 -2 -1 -2
X -6 -7 -6 -6 -4 -3 -2 0 -2 -3 -4 -1 0 -1 -2 -3 -2 7 1 2 1 -1 0
V -6 -7 -5 -6 -4 -4 -4 -3 -1 -3 -2 -2 -1 0 -2 -1 2 1 8 2 -2 -3 -1
M -3 -3 -2 -3 -1 -6 -4 -4 2 - 1 -2 -3 -3 -2 -3 -4 -1 2 2 7 -2 -1 -2
R -5 -5 -5 -5 -4 -6 -4 -2 -2 -2 -1 -4 0 - 1 1 - 2 -2 1 -2 -2 8 3 -2
Q -3-3-3-3-2-7-5-4 1 -1-1-4-2-2-2-2-1-1-3-1 3 6 -2
Z -4 -4 -4 -4 -3 -3 -2 -2 -2 -2 -1 0 0 -2 -1 -2 -2 0 -1 -2 -2 -2 9
Genome Biology 2007, Volume 8, Issue 3, Article R31 Tung et al. R31.7
comment reviews reports refereed researchdeposited research interactions information
Genome Biology 2007, 8:R31
(A, Y, B, C, and D), are aligned. Conversely, the lowest substi-
tution score (-15) in SASM is for the alignment of 'Y' (helix
alphabet) with 'E' (strand alphabet). These scores are also low
when helix alphabets (A, Y, B, C, and D) are aligned with
strand alphabets (E, F, and H).
The SASM matrix and BLOSUM62 [32] were compared
because they adopted BLAST as the search tool. The highest
substitution score is 11 for both matrices. By contrast, the low-
est score for SASM (-15) is much lower than that for
BLOSUM62 (-4). This large difference occurs mainly because
α-helices and β-strands constitute very different protein sec-
ondary structures, and the structural letters pertaining to
these two structures are better conserved than those of amino
acid sequences. Because the gap penalty is an important fac-
tor, various combinations of gap penalties were systemati-
cally tested for 3D-BLAST and the SASM matrix based on the
pair database (1,348 proteins). Here, the optimal values for
the open gap penalty and the extended one are 8 and 2,
respectively.
Statistics of 3D-BLAST
A database search method should enable users to examine the
statistical significance of an alignment in order to determine
the reliability of the prediction. 3D-BLAST maintains the
benefits of the BLAST tool in terms of ordering hit proteins by
E value for rapid scanning of structural database. We used the
theoretical result [33,34] to estimate the E value of an
ungapped local alignment of two structural alphabet (SA)
sequences A (query) and B (database sequence) with score S
using the following steps. First, we computed statistical
parameters λ and K according to the 23-state SA
compositions of A and B and the SASM matrix (Figure 4). In
a SA database search, we used the actual SA composition of A
and an average SA composition for B. Second, we computed
adjusted lengths L
A
and L
B
of A and B, where L
B
is the sum of
lengths of all database sequences. Third, we obtained a nor-
malized score S' = λS - ln(K) and calculated the E value =
L
A
L
B
e
-S
. Although the theory referred to above has not been
proved to be valid for gapped local alignments, computational
experiments suggest that that it is [35,36]. The statistical
parameters λ and K cannot be derived from theory; they must
be estimated by simulation with random or real but unrelated
sequences.
To evaluate the accuracy of the E values reported by 3D-
BLAST, we submitted shuffled SA sequences as queries and
found the number of match sequences with E values below
various thresholds. For simplicity, we used the query set
SCOP-516 and the respective shuffled queries (516 SA
sequences) that represent protein structures, and the search
database was SCOP 1.67. Shuffled queries mimic completely
random SA sequences, which preserve only the composition
basis of a protein structure, using the typical SA composition.
The numbers of matches of 516 shuffled queries with E-values
below e
-20
, e
-15
, and e
-10
are 0, 3, and 326, respectively. On the
other hand, the numbers of matches of 516 queries in the
SCOP-516 dataset with E values below e
-20
, e
-15
and e
-10
are
8,268, 18,700, and 64,440, respectively. Protein structures
and the structural letters are more conserved than protein
sequences; thus, as one would expect, the E values of 3D-
3D-BLAST performance with E values on the protein query set SCOP-516Figure 5
3D-BLAST performance with E values on the protein query set SCOP-516. (a) The relationship between 3D-BLAST E values and the root mean square
deviation (rmsd) values of aligned residues. The average rmsd values with E value below e
-10
, e
-15
, e
-20
, and e
-25
are 3.57 Å, 2.85 Å, 2.37 Å and 2.25 Å,
respectively, based on 22,415 protein structures randomly selected from the 516 returned lists. (b) The relationship between E values and the
percentages of true (black) and false (gray) function assignment. The correct percentages of the superfamily assignments with E values below e
-10
, e
-15
, e
-20
and e
-25
, are 95.26%, 97.67%, 99.31%, and 99.75%, respectively. The coverage values of the function assignment are 98.06% (<e
-10
), 91.47% (<e
-15
), 83.72%
(<e
-20
), and 76.74 (<e
-25
).
0
1
2
3
4
5
6
7
8
9
-180-160-140-120-100
-80
-60-40-20
0
E-value of 3D-BLAST (e)
Percentage
True (Superfamily)
False (Superfamily
)
(b)(a)
E-value of 3D-BLAST (e)
RMSD (Å)
0
2
4
6
8
10
12
14
0-20-40-60-80-100
R31.8 Genome Biology 2007, Volume 8, Issue 3, Article R31 Tung et al. />Genome Biology 2007, 8:R31
BLAST are larger than those of BLAST when the reliable indi-
cators are similar.
The proposed 3D-BLAST provides a threshold E value to
identify a highly significant similarity with the query. The
SASM matrix reveals that the biologic significance of the
high-scoring structures can be inferred from the similarity
score, and the proportion of true positives rises when a lower
E value is utilized (Figure 5). Figure 5a shows that E values
correlate strongly with the rmsd values of aligned residues
between the query protein and the hit proteins. A total of
22,415 proteins were randomly chosen from the hit lists of
516 query proteins in the SCOP-516 dataset. Among these
22,415 proteins, 27.72% (6,215 structures) had rmsd values
below 3.0 Å. If the E value was restricted to under e
-20
, then
83.52% of hit proteins (2,130 proteins from among 2,549 pro-
teins) had rmsd values less than 3.0 Å, and the average rmsd
was 2.37 Å. When the E value was restricted to under e
-15
and
under e
-10
, then 72.65% (3,984 proteins among 5,487 pro-
teins) and 51.70% (5,742 proteins among 11,106 proteins) of
proteins had rmsd values less than 3.0 Å, respectively, and
the average rmsd values were 2.85 Å and 3.57 Å.
For classification assignment, the relationship between the E
value of the first hit and the number of correct (dark line) and
false (gray line) classification assignments for the SCOP-516
dataset was calculated (Figure 5b). If the E value was
restricted to under e
-15
, then 97.67% of 516 query structures
are assigned correct classifications and the coverage was
91.47%. The coverage is defined as P/T, where P is the
number of assigned structures by a method and T is total
number of structures. For example, P is 472 and T is 516 for
the set SCOP-516. When the E value was less than e
-20
and e
-
10
, 99.31% and 95.26% of the predicted cases were correct,
and the coverage values were 83.72% and 98.06%, respec-
tively. When the sequence identity was less than 25% (154
proteins from among 516 proteins), the rate of correct assign-
ment was 90.35%. The coverage was 72.12% when the E value
was less than e
-15
. For the database search, the precision was
0.80 and the recall was 0.48 when the E value was below e
-15
;
by comparison, the precision was 0.90 and the recall was 0.42
when the E value was below e
-20
. These analytical results
demonstrate that the E value of 3D-BLAST enables users to
examine the reliability of the structure database search of a
query.
Search examples
Using the yeast copper chaperone for superoxide dismutase
(yCCS) from Arabidopsis thaliana (PDB code 1JK9-B) [37] as
the query protein and an E value threshold of 10
-10
, a 3D-
BLAST search of the database SCOP1.69 found 19 members
(Table 1). Figure 6 shows two hits of the search results. The
protein (yCCS) comprised amino-terminal and carboxyl-ter-
minal domains. The amino-terminal domain, called HMA
(heavy-metal associated) domain in the SCOP database, plays
a role in copper delivery. This domain contains an MH/
TCXXC metal binding motif (blue box in Figure 6a), and is
very similar to the metallochaperone protein Atx1. The car-
boxyl-terminal domain, termed the Cu,Zn superoxide dis-
mutase-like domain in the SCOP database, comprised an
Table 1
3D-BLAST search results by copper chaperone for superoxide dismutase (PDB code 1JK9-B) from yeast as query
PDB code Protein title log(E value) rmsd (Å) Sequence identity (%)
a
SCOP sccs Species
1EJ8-A Copper chaperone for yeast sod -50.70 1.10 57.6 b.1.8.1 Saccharomyces cerevisiae
1QUP-A Copper chaperone for superoxide dismutase -27.05 0.58 28.3 d.58.17.1 Saccharomyces cerevisiae
1CC8-A Superoxide dismutase 1 copper chaperone -17.40 1.64 8.6 d.58.17.1 Saccharomyces cerevisiae
1TO4-A Superoxide dismutase -17.22 2.78 19.6 b.1.8.1 Schistosoma mansoni
1DO5-A Human copper chaperone for superoxide dismutase domain II -16.30 2.57 17.3 b.1.8.1 Homo sapiens
1OSD-A Oxidized Merp from Ralstonia metallidurans CH34 -16.05 1.61 11.1 d.58.17.1 Ralstonia metallidurans
1Q0E-A Copper, zinc superoxide dismutase -14.22 1.68 17.7 b.1.8.1 Bos taurus
1OAL-A Superoxide dismutase -14.00 2.19 17.7 b.1.8.1 Photobacterium leiognathi
1SRD-A Copper, zinc superoxide dismutase -13.30 2.71 17.5 b.1.8.1 Synthetic construct
1FE0-A Copper transport protein atox1 -13.10 1.40 9.9 d.58.17.1 Homo sapiens
1OZU-A Copper, zinc superoxide dismutase -12.70 2.42 18.5 b.1.8.1 Homo sapiens
1ESO Copper, zinc superoxide dismutase -12.30 2.49 17.6 b.1.8.1 Escherichia coli
1FVQ-A Copper-transporting ATPase -12.00 1.64 9.9 d.58.17.1 Saccharomyces cerevisiae
1JCV Copper, zinc superoxide dismutase -11.70 2.24 20.3 b.1.8.1 Saccharomyces cerevisiae
1S6U-A Copper-transporting ATPase 1 -11.15 1.87 8.6 d.58.17.1 Homo sapiens
1XSO-A Copper, zinc superoxide dismutase -10.70 1.88 19.3 b.1.8.1 Xenopus laevis
1OQ3-A Potential copper-transporting ATPase -10.40 1.84 11.4 d.58.17.1 Bacillus subtilis
1VCA-A Human vascular cell adhesion molecule-1 -10.30 3.76 15.9 b.1.1.3 Homosapiens
1KQK-A Potential copper-transporting ATPase -10.22 1.63 12.3 d.58.17.1 Bacillus subtilis
1MWY-A The N-terminal domain of ZntA in the apo-form -10.10 1.67 9.0 d.58.17.1 Escherichia coli
a
Amino acid sequence identity is calculated using FASTA software. PDB, Protein Data Bank; rmsd, root mean square deviation.
Genome Biology 2007, Volume 8, Issue 3, Article R31 Tung et al. R31.9
comment reviews reports refereed researchdeposited research interactions information
Genome Biology 2007, 8:R31
eight-stranded β-barrel that strongly resembles yeast super-
oxide dismutase I and human superoxide dismutase I.
3D-BLAST was able to identify 9 and 10 homologous struc-
tures of amino-terminal domains and carboxyl-terminal
domains, respectively, using this two-domain protein (yCCS)
as query. The sequence identities between yCCS and most of
the homologous structures (17 out of 19 proteins) were less
than 20%. Figure 6a,c illustrates sequence alignments and
the structure alignment between yCCS and an amino-termi-
nal domain homologous protein (PDB code 1CC8-A [38]).
The sequence identities of structure alphabet and amino acid
sequences were 42% and 17%, respectively. 3D-BLAST can
align six amino acids of the metal binding motif together, and
the rmsd is 1.64 Å between these two proteins. The aligned
secondary structures are represented as a continuous color
spectrum from red through orange, yellow, green and blue to
violet. Figures 6b,d show the sequence and structure align-
ments between yCCS and a carboxyl-terminal domain homol-
ogous protein (PDB code 1QOE-A [39]). The sequence
identities of the structure alphabet and the amino acid
sequences were 30% and 14%, respectively, and the rmsd
between these two proteins was is 1.68 Å. The structural
alphabets were strongly conserved in areas of the secondary
structures (green block), which are β-strands represented by
structural alphabets, such as E, F, H, K, and N. These results
reveal that the structural alphabet sequences are much better
conserved than the amino acid sequences, which explains
why 3D-BLAST could detect the invariant residues and find
these distantly related proteins.
Search results and comparison with PSI-BLAST
Figure 7 illustrates the accuracies of the 3D-BLAST and PSI-
BLAST in structure database searches and evolutionary clas-
sification assignments using the query set SCOP-516. For this
experiment, 3D-BLAST was compared with PSI-BLAST,
because PSI-BLAST often performs much better than BLAST
for this purpose. Standalone PSI-BLAST [5] was installed on
a personal computer with a single processor (Pentium 2.8
GHz with 512 megabytes of RAM). The main differences
between 3D-BLAST and PSI-BLAST are in the search data-
bases and substitution matrices. In 3D-BLAST, the
substitution matrix is the SASM matrix and the searching
database is the SADB, whereas PSI-BLAST adopts an amino
acid sequence database and a BLOSUM62 substitution
matrix. The number of iterations for PSI-BLAST was set to
three and the open gap penalty and the extended one are 11
and 1, respectively. For database search, the threshold of the
E values of 3D-BLAST and PSI-BLAST are set to 10
-10
and
0.01, respectively.
For a database search tool, the ROC curve (Figure 7a) pro-
vides an estimation of the likely number of true positive and
false positive predictions. A perfect method, which can
Sequence and structure alignments of 3D-BLAST search results using yCCS as the queryFigure 6
Sequence and structure alignments of 3D-BLAST search results using yCCS as the query. This protein consists of the amino-terminal and carboxyl-
terminal domains. Sequence alignments (structural alphabet and amino acid sequences) of (a) amino-terminal domain and (b) carboxyl-terminal domain
between the query protein and homologous proteins (Protein Data Bank [PDB] codes 1CC8-A and 1QOE-A, respectively). Structure alignments of (c)
amino-terminal domain and (d) carboxyl-terminal domain between the query protein and the homologous proteins (PDB codes 1CC8-A and 1QOE-A,
respectively). The aligned secondary structures are denoted as a continuous color spectrum from red through orange, yellow, green, and blue to violet.
The amino-terminal domain contains an MT/HCXXC metal binding motif (blue box in panel a and wireframe model in panel c). yCCS, yeast copper
chaperone for superoxide dismutase.
SStructura
ll alphabett sequence:: Identitiess
=
=
29/688 (42%)
(a) (N-terminal domain)
Structural alphabet sequence: Identities 29/
68 (42%)
1jk9B: 2
HKHFEFHKNXXSLQGCBYYAB
-DQMQPGQHVTEFEEM
LSRTFEEXTQTF
CBAAABABBBSQPEEFHVP 68
1cc8A: 1 HFHEEFHKHHVTIGDCBACBDCDGGQXCQPVPEEEEGLSRPEEEXPQTFBDYYYYYCGGSQTHE VP 66
Amino acid sequence: Identities = 12/68 (17%)
1jk9B: 2 TYEATYAIPMHCENCVNDIKA-CLKNVPGINSLNFDIEQQIMSVESSVAPSTIINTLRNCGKDAIIRG 68
1cc8A: 1 IKHY
Q
FNVV
MTCS
GCSGAVNKVLTKLEPDVSKIDISLEK
Q
LVDVYTT
LPYDFILEKIKKTGKEV RS 66
Q
Q
(b) (C-terminal domain)
Structural alphabet sequence: Identities = 49/160 (30%)
1jk9B: 75 PFEFFHKF
MTNKCQTFDQTK
QHXNEEEHFHXTLL
NFEEEHEHXP
NMSXVPFFHKNKG
PRHXVSVLGGSKT HVPFF
1q0eA: 1
PEEFFH
HNDS
QH
NKHEEHFH
-
TWL
PFENZNEEXR
TN
-
V
VNKNNNNKM
PRHXVSVLMQSZTTRNMSXN
1q0eA:
1
PEEFFH
HNDS
QH
NKHEEHFH
TWL
PFENZNEEXR
TN
V
VNKNNNNKM
PRHXVSVLMQSZTTRNMSXN
Ami
n
o acid
seque
n
ce:
Ident
it
ies = 23
/
160 (14%)
1jk9B: 75
SAVAILET
FQKYTIDQKKDT
AVRGLARIVQ
VGEN
KTLFDITVNG
VPEA
GNYHASIHE
KGDVSKGVESTGK
VWHKF
1jk9B:
75
SAVAILET
FQKYTIDQKKDT
AVRGLARIVQ
VGEN
KTLFDITVNG
VPEA
GNYHASIHE
KGDVSKGVESTGK
VWHKF
1q0eA: 1 KAVCVLKGDG PVQGTIHFEA-KGDTVVVTGSITGLT-EGDHGFHVHQFGDNTQGCTSAGPHFNPLS
K
(c) (N-terminal domain)
XPFK EXXTKFDWTDQPEHEEFHEHNQPKD-DCQ VQTFHE HHKNFMPQ MQPMSRH
XPNHHEKNPKN
213
NRKNIQPGQTKCQHT
XNFE
-
F
KIS
RNEFHXHHHM
GPKMVWIQNXVQTFHEKKVSNEKTQXSQTCGGDLTTQNX
THVPEKKHKT
147
NRKNIQPGQTKCQHT
XNFE
F
KIS
RNEFHXHHHM
GPKMVWIQNXVQTFHEKKVSNEKTQXSQTCGGDLTTQNX
THVPEKKHKT
147
DEPI
ECFNES
DLGKN
LYSGKTFLSA
PLPT
-
WQL
IGRSFV
ISKSLNHP
ENEPSSV
KDYSFLGVIAR
213
DEPI
ECFNES
DLGKN
LYSGKTFLSA
PLPT
WQL
IGRSFV
ISKSLNHP
ENEPSSV
KDYSFLGVIAR
213
K
KHGGPKDEERHVGDLGNVT-ADKNGVAIVDIVDPLISLSGEYSIIGRTMVVHEKPDDLGRGGNEESTKTGNAGSRLACGVIGI 147
(d) (C-terminal domain)
R31.10 Genome Biology 2007, Volume 8, Issue 3, Article R31 Tung et al. />Genome Biology 2007, 8:R31
recover all true hits without any false positives, can be
denoted as a point in the top left corner of this graph, whereas
a random method that generates equal numbers of true posi-
tive and false positive predictions uniformly distributed
across all scores would yield a diagonal line from (0,0) to
(1,1). Figure 7a shows that 3D-BLAST (dark lines) yields
much better predictions than does PSI-BLAST (gray lines).
The sensitivity of family assignments was superior to that of
superfamily assignments in both methods, whereas the false-
positive rates of family assignments were higher than those of
the superfamily assignments.
For most sets of sequence identities, 3D-BLAST outper-
formed PSI-BLAST (Figure 7b) in protein evolutionary
classification assignments. Almost 70.16% (362 out of 516
proteins) of query proteins were more than 25% identical to
one of the library representatives from the same SCOP
superfamily, and 100% of these domains were correctly
mapped by both 3D-BLAST and PSI-BLAST. When the
sequence identity was less than 25% (154 out of 516 proteins),
the accuracy of 3D-BLAST ranged from 96.29% to 50%,
whereas the accuracy of PSI-BLAST ranged from 94.29% to
21.74% (Figure 7b). These proteins were difficult to assign
because of the limited similarity of the query proteins to the
representative library domains. 3D-BLAST yielded
significantly better results than did PSI-BLAST at sequence
identity levels of 25% or less. The analytical results reveal
that, as expected, sequence comparison tools that are more
sensitive to distant homology are usually more successful at
making challenging assignments. In summary, 3D-BLAST
achieved more reliable assignments than did PSI-BLAST in
cases of low sequence identity for this test set. The structural
alphabet, SADB database, and SASM matrix could predict
protein structures more accurately than simple amino acid
sequence analyses.
Comparisons and discussions
Comparing the results of different structure database search
methods is generally neither straightforward nor completely
fair, because each such method utilizes different accuracy
measures, searching databases, and test complexes. Figure 8
shows the relationship between recall and precision, and
Table 2 presents the average search time and average preci-
sion of 3D-BLAST, PSI-BLAST, MAMMOTH [8], CE [7],
TOPSCAN [11], and ProtDex2 [9] on 108 query proteins pro-
posed by Aung and Tan [9] (Additional data file 6). The per-
formance of TOPSCAN and ProtDex2, which are fast search
methods for scanning structure databases, was summarized
from previous studies [9]. Other four programs were installed
and run on the same personal computer with a single proces-
sor. Here, the PSI-BLAST and 3D-BLAST used E values to
order the hit proteins; MAMMOTH and CE (detailed struc-
ture alignment tools) utilized Z scores to rank the hit proteins.
On average, 3D-BLAST required about 3.18 s seconds to scan
the database for each query protein (Table 2). It is about
34,000 and 3838 times faster than CE and MAMMOTH,
respectively. 3D-BLAST was about two times slower than
PSI-BLAST, because 3D-BLAST identified many more words
(typically of length three for proteins in BLAST) that score
more than a threshold value in the SADB databases than
those identified by PSI-BLAST in protein sequence databases.
The reason for this stems from the fact that the BLAST algo-
rithm scans the database for words that score at least a
Comparison 3D-BLAST with PSI-BLASTFigure 7
Comparison 3D-BLAST with PSI-BLAST. Evaluation of the 3D-BLAST and PSI-BLAST in database search and family/superfamily assignments by SCOP-516
based on (a) receiver operating characteristic (ROC) curves and (b) percentages of correct classification assignments. 3D-BLAST (black lines)
outperforms PSI-BLAST (gray lines) in the ROC curve. The dashed and solid lines denote the ROC curves for the SCOP superfamily and SCOP family
assignments, respectively. 3D-BLAST (black bars) is much better than PSI-BLAST (gray bars) when the sequence identity is under 20%.
0
0.2
0.4
0.6
0.8
1
0 0.2 0.4 0.6 0.8 1
1-specificity
Sensitivity
3D-BLAST (superfamily)
PSI-BLAST (superfamily)
3D-BLAST (family)
PSI-BLAST (family)
SCOP Level
Sequence identity
>30%
30%~25%
<15%
25%~20%
20%~15%
Superfamily
Family
Superfamily
Family
Superfamily
Family
Superfamily
Family
Superfamily
Family
0%
20%
40%
60%
80%
100%
Function assignment accuracy
3D-BLAST
PSI-BLAST
(b)
(a)
Genome Biology 2007, Volume 8, Issue 3, Article R31 Tung et al. R31.11
comment reviews reports refereed researchdeposited research interactions information
Genome Biology 2007, 8:R31
threshold when aligned with some words within the query
sequence; the algorithm then extends each such 'hit' in both
directions to check the alignment score [5].
MAMMOTH is the best and TOPSCAN is the worst for these
108 queries among these six methods (Figure 8). 3D-BLAST
was much better than fast structure database search methods
(TOPSCAN [11] and ProtDex2 [9]), and its performance
approached those of CE and MAMMOTH. Notably, PSI-
BLAST outperformed both TOPSCAN and ProtDex2, which
considered secondary and 3D protein structures. As shown in
Table 2, the mean of average precision of 3D-BLAST (78.2%)
was better than that of PSI-BLAST (69.2%) and lightly worse
than those of CE (82.1%) and MAMMOTH (83.4%). For some
query proteins, such as serotonin N-acetyltranferase [40]
(PDB code 1CJW-A) and translation initiation factor IF2/
eIF5B [41] (PDB code 1G7S-A; Additional data file 6), 3D-
BLAST, MAMMOTH, and CE were markedly better than PSI-
BLAST because most sequence identities between the query
proteins and their members are under 20%. For several query
proteins, such as human dihydro-orotate dehydrogenase [42]
(PDB code 1D3G-A) and yeast copper chaperones for SOD
[43] (PDB code 1EJ8-A), CE and MAMMOTH were worse
than 3D-BLAST. Interestingly, PSI-BLAST outperformed CE,
MAMMOTH, and 3D-BLAST for S-adenosylhomocysteine
hydrolase [44] (PDB code 1B3R-A).
The recognition performance of 3D-BLAST is expressed as
top rankings (Additional data file 7), using Lindahl's bench-
mark [45], together with the performance of eight popular
sequence comparison (for example, HMM and profile
methods). The benchmark includes 976 proteins derived
from the SCOP for identifying homologous pairs at different
similarity levels (Additional data file 8). Sequence identities
between the query proteins and their homologous members
in the superfamily and fold levels are much lower than those
at the family level. These methods can be divided into two cat-
egories: methods using only single sequence information
(BLAST2 and SSEARCH [3]) and methods using multiple
sequence alignments (PSI-BLAST, HMMER-HSSP [46],
HMMER-PSI-BLAST [46], SAM-HSSP [4], SAM-PSIBLAST
[4], and BLAST-LINK [45]). The methods of constructing
profiles/HMMs used a larger dataset, comprising the
SWISSPROT-35 and TREMBL-5 databases [47] together with
the benchmark sequences of the HSSP database [48].
At the family level, 3D-BLAST identified 78.4% of homolo-
gous pairs that were ranked in the top 5. This was comparable
to the best performance of any of the other methods (78.9%),
which was achieved by BLAST-LINK (Additional data file 7).
At the superfamily and fold levels, 3D-BLAST significantly
outperformed all of the other methods. 3D-BLAST yielded
54.8% and 39.3% homologous pairs at the superfamily and
fold levels, respectively. On the other hand, the best accura-
cies for the other methods were 40.6% (by BLAST-LINK) at
the superfamily level and 18.7% (by SAM-PSIBLAST) at the
fold level.
The main factors causing 3D-BLAST to perform poorly on
some cases in both SCOP-516 and SCOP-108 datasets are
summarized as follows. First, 3D-BLAST might have made
minor shifts when aligning two local segments with similar
Table 2
Average search time and mean average precision of each program on 108 queries in SCOP-108
Program Mean of average precision Total searching time (s) Average time per query (s) Related to 3D-BLAST
PSI-BLAST
a
69.8% 18.31 0.170 0.533
3D-BLAST 78.2% 34.35 0.318 1
MAMMOTH
b
82.1% 131,855 1220.88 3838.58
CE 83.4% ~13.5 days ~3 hours ~34000
Time was measured using a personal computer equipped with an Intel Pentium 2.8 GHz processor with 1,024 megabytes of RAM memory.
a
PSI-
BLAST used E values to rank the hit proteins.
b
MAMMOTH and CE utilized Z scores to rank hit proteins.
3D-BLAST versus fast structure search, sequence profile search, and detailed structural alignmentFigure 8
3D-BLAST versus fast structure search, sequence profile search, and
detailed structural alignment. Comparison of 3D-BLAST with fast
structure search methods (TopScan and ProtDex2), sequence profile
search method (PSI-BLAST), and detailed structural alignment methods
(CE and MAMMOTH) based on the precision and recall of the protein
query set SCOP-108. The performance of TOPSCAN and ProtDex2 is
summarized from previous work [9].
0%
10%
20%
30%
40%
50%
60%
70%
80%
90%
100%
0% 10% 20% 30% 40% 50% 60% 70% 80% 90% 100%
Recall
Precision
CE
MAMMOTH
3D-BLAST
PSI-BLAST
ProtDex2
TopScan
R31.12 Genome Biology 2007, Volume 8, Issue 3, Article R31 Tung et al. />Genome Biology 2007, 8:R31
codes, because the structural alphabets did not consider the
actual euclidean distances. Hence, 3D-BLAST is more sensi-
tive when the query proteins (for example, PDB code 1VDL-A
and 1PMZ-A in SCOP-516) are the members of the 'all-α' class
in SCOP. Second, the structural similarity of a query protein
to the library members is rather limited. Third, an inherent
problem in the BLAST algorithm is inability to detect remote
homology of structural alphabet sequences. Use of PSI-
BLAST as the search algorithm for 3D-BLAST slightly
improved the overall performance on the SCOP-516 set. An
enhanced position-specific score matrix of the structure
alphabet for SADB databases should be developed to improve
the performance of 3D-BLAST in the future. Finally, the E
values of the hits are not significant.
We demonstrated the robustness and adaptability of 3D-
BLAST for the initial scan of large protein structure data-
bases; conversely, detailed structure alignment tools often
align two structures slowly but accurately. Because of basic
differences, comparisons between 3D-BLAST and detailed
structure alignment tools are not straightforward. However,
detailed structure alignment tools can be applied to refine the
searching structures of 3D-BLAST to improve accuracy of
prediction.
Structural genomics targets
We analyzed 319 structural genomics targets, called SG-319,
using 3D-BLAST (Figure 9) with regard to function assign-
ment. The structural genomics initiative aims to determine
representative structures for all protein families in cells
[1,49,50]. To sample the protein structural space more effi-
ciently, structural genomics projects employ various target
selection strategies to filter out proteins that are homologous
to the proteins with structures already in the PDB [51]. As a
result, the molecular functions of the proteins targeted by
structural genomics are often unknown. The SG-319 set con-
tains 319 structural genomics targets contributed by more
than 10 structural genomics consortia, and publication dates
range from 1 January 2005 to 30 September 2005. There are
126 proteins in SG-319 having the 'unknown function'
annotation.
3D-BLAST used these 319 proteins as query proteins, and the
search classification database was SCOP 1.69, which contains
12,074 domains. About 38.2% (122 proteins) and 32.6% (104
proteins) of the SG-319 proteins have more than 25% and
under 20% sequence identity, respectively, to one of the
library representatives of the SCOP superfamily, according to
search results with 3D-BLAST. In all, 3D-BLAST assigned
244 (78.5%) proteins to SCOP superfamilies if the threshold
of E value was set at under e
-15
by the SG-319 query set (Figure
9a). When the sequence identity was more than 25%, 98.4%
(120 out of 122) of these cases could be assigned to a SCOP
superfamily by 3D-BLAST, and 62.9% (124 out of 197) of the
remaining proteins could also be assigned.
The following observations help in comparing the character-
istics and performance between applying 3D-BLAST to SG-
319 (Figure 9a) and applying it to SCOP-516 (Figure 5b).
First, the distribution of the sequence identity of these two
sets was significantly different. The sequence identities of 197
(61.8%) and 154 (29.85%) proteins in SG-319 and SCOP-516,
respectively, were under 25%. The average sequence identity
in SG-319 is significantly lower than that of SCOP-516. Sec-
3D-BLAST function assignment results for 319 proteins targeted by structural genomicsFigure 9
3D-BLAST function assignment results for 319 proteins targeted by structural genomics. (a) The percentages of assigned proteins (black) and unassigned
proteins (gray) are 76.5% and 23.5%, respectively, when the threshold E value is set to e
-15
. (b) Structure alignment between the query protein (Protein
Data Bank [PDB] code 1yrhA, green) and the first-rank protein (PDB code 1e5dA, orange) in the hit list. The FMN ligand of both proteins are indicted as
wireframe models.
0
5
10
15
20
25
30
35
40
0 102030405060708090100
Sequence identity (percentage)
Number of cases
Assignment
Unassignment
76.5%
23.5%
(a)
(b)
Genome Biology 2007, Volume 8, Issue 3, Article R31 Tung et al. R31.13
comment reviews reports refereed researchdeposited research interactions information
Genome Biology 2007, 8:R31
ond, the assigned parentages of SG-391 and SCOP-516 were
78.5% and 91.47%, respectively, when the E value was
restricted to under e
-15
. If the sequence identity was under
25%, then the assigned rates were 62.9% (SG-319) and
72.12% (SCOP-516). Third, 3D-BLAST achieved similar accu-
racies for both sets if the sequence identity was above 25%.
These observations are consistent with recent analyses of pro-
teins targeted by structural genomics [51,52].
Figure 9b shows that 3D-BLAST assigned a structural genom-
ics target (PDB code 1YRH) to the flavodoxin-related family
[53] based on the first-rank protein (PDB code 1E5D [54]) in
the hits. The E value was 10
-25
and the Z score of CE and rmsd
value were 5.7 and 1.56 Å, respectively, when these two pro-
teins were aligned. These two proteins have the same Gene
Ontology (GO) annotations [55] and the same domain anno-
tations in three databases, including PROSITE [56], Pfam
[57], and CATH [31]. The aligned structures of these two pro-
teins are similar, and the FMN-binding motifs (wireframe
model) are also aligned well (Figure 9b). Eight of the top 10
proteins in the hits are the members of the same SCOP
superfamily. However, PSI-BLAST was unable to yield the
same assignment.
Conclusion
This study demonstrates the robustness and feasibility of the
(κ, α) plot derived structural alphabet for developing a small
set of sequence-structure fragments and a fast one-against-all
structure database search tool. The (κ, α) plot is an effective
means of assessing the quality of protein 3D structure. The
3D-BLAST tool, which exploits the benefits of BLAST, is effi-
cient and reasonably effective. 3D-BLAST is significantly bet-
ter than PSI-BLAST at 25% sequence identity or less, and is as
fast as BLAST. The structural alphabet and matrix SASM
achieve good agreement for protein structures and biologic
inference. Future investigations can adopt the (κ, α) plot
derived 3D fragment library to develop a small 3D fragment
library and predict protein structures. Moreover, many
sequence-based methods can be applied to mine biologic
meanings quickly from protein structures based on this 23-
state structural alphabet. Finally, 3D-BLAST can be adopted
to develop multiple structure alignment and structure profile
search methods.
Materials and methods
(κ, α) Plot cluster and structural alphabet
To code the structural alphabet and calculate the substitution
matrix we selected 674 structural pairs (1,348 proteins; Addi-
tional data file 1), which are structurally similar and with low
sequence identity, from SCOP based on two criteria: pairs
must have rmsd under 3.5 Å, with more than 70% of aligned
resides included in the rmsd calculation; and pairs must have
under 40% sequence identity. Based on κ and α angles, an
accumulated (κ, α) plot (Figure 1b) consisting of 225,523 pro-
tein fragments, each five residues long, was obtained from
these 1,348 proteins. This plot is split into 648 cells (36 × 18)
when the angles of κ and α are divided by 10°. In the study,
the structural distance of a pair of 5-mer protein segments i
and j is determined from the rmsd value of the five C
α
atom
positions, and is given as follows:
Where (X
k
, Y
k
, Z
k
) and (x
k
, y
k
, z
k
) denote the coordinates of
the kth C
α
atom of segments i and j, respectively. The
structural distance is also used to define the intrasegment and
intersegment distances.
3D-BLAST used BLAST as the search method and was
designed to maintain the advantages of BLAST. However, 3D-
BLAST is slow if the structural alphabet is un-normalized,
because the BLAST algorithm searches a statistically signifi-
cant alignment by two main steps [5]. It first scans the data-
base for words that score more than a threshold value if
aligned with words in the query sequence; it then extends
each such 'hit' word in both directions to check the alignment
score. To reduce the ill effects of using an un-normalized
structural alphabet, we set a maximum number (γ) of seg-
ments in a cluster in order to have similar compositions for
the 23 structural letters and 20 amino acids. The value of γ
was set to 16,000 (about 7.0% of total structural segments in
the pair database).
To identify a set of 3D fragment segments (a structural alpha-
bet), we developed a novel nearest-neighbor clustering (NNC)
method to cluster 225,523 fragments in the accumulated (κ,
α) plot (Figure 1b) into 23 groups. For each group, a repre-
sentative segment, which represents the pattern profiles of
the backbone fragments, was identified and assigned to a
structural letter. These representative segments of clusters
comprise a set of local structural segments. The NNC algo-
rithm used the following steps and goals. The first step is to
identify a representative structural segment, namely a center
segment of all segments in this cell according to structural
distances, for each cell in this (κ, α) plot. The second step is to
cluster 648 representative segments into 23 groups by group-
ing similar representative segments into individual clusters
and restricting the maximum number of segments in a
cluster. In the third step, a representative segment is identi-
fied in each cluster based on the cell weight, which is defined
as follows:
Where S
i
is the number of segments in cell i and M is the
number of cells in this cluster. The fourth step involves
assigning the representative segment of a cluster to a struc-
Xx Yy Zz
kk kk kk
k
−
()
+−
()
+−
()
⎡
⎣
⎢
⎤
⎦
⎥
⎧
⎨
⎪
⎩
⎪
⎫
⎬
⎪
⎭
⎪
=
∑
22 2
1
5
12
5/
/
w
S
i
i
j
j
M
=
=
∑
1
1
1
/
/S
R31.14 Genome Biology 2007, Volume 8, Issue 3, Article R31 Tung et al. />Genome Biology 2007, 8:R31
tural letter. In the fifth and final step, a composition of 23
structural letters is obtained that is similar to the 20 common
amino acids. We developed an NNC algorithm instead of
using a standard clustering algorithm, such as a hierarchical
clustering method, which is unable to achieve the second,
third and fifth steps/goals.
The NNC method clustered 648 representative segments into
23 groups using the following steps. First, a structural dis-
tance matrix (D), stored with the rmsd values by calculating
the all-against-all representative segments, is first created
with a size given by N × N, where N denotes the number of
cells. An entry (D
ij
) represents the structural distance of rep-
resentative segments i and j. Second, an unlabeled cell is
selected with the maximum number of segments as the seed,
and labeled as C
i
. Third, an unlabeled cell is added, which rep-
resents the nearest neighbor of the seed, into this cluster and
labeled as C
i
if rmsd < ε (minimum structural distance), and
if the sum of segments in this group is less than a bound γ
(maximum number of a cluster). This step is repeated until an
added cell violates the restriction thresholds, ε or γ. Fourth,
steps 2 and 3 are repeated until the number of clusters equals
22 or all of the cells are labeled. Fifth, all remaining unlabeled
cells are assigned to a cluster C
23
. Here, ε = 0.95 Å and γ =
16,000.
A set of representative segments with 23 states and its respec-
tive structural letters are identified (Figure 2a and Additional
data file 2) after performing the NNC method. Here, this 23-
state structural alphabet was adopted for both protein struc-
ture reconstructions and protein structure database searches.
The intrasegment structural distances (blue) are much
greater than the intersegment structural distances (Figure
1c), and the average rmsd values of these 3D representative
segments located in the same (or similar) cluster are fre-
quently below 0.8 Å. The composition of the 23-state struc-
tural alphabet resembles that of the 20 amino acids obtained
from the pair database. The distribution of the 23-state struc-
tural segments is consistent with that of the eight-state sec-
ondary structures defined by the DSSP program (Additional
data file 3).
BLOSUM-like substitution matrix
A substitution matrix and an SADB database are the essential
components for adopting BLAST to search a structural data-
base quickly. A new BLOSUM-like substitution matrix, called
SASM (Figure 4), was developed by using a method similar to
that used to construct BLOSUM62 [32] based on the pair
database. The SASM (23 × 23) provides insight into substitu-
tion preferences for 3D segments between homologous struc-
tures with low sequence identity. An entry (S
ij
), which is the
substitution score for aligning a structural alphabet i, j pair (1
≤ i, j ≤ 23) of the SASM matrix, is defined as S
ij
= clog
2
(q
ij
/e
ij
),
where c is a scale factor for the matrix, and q
ij
and e
ij
are the
observed probability and the expected probability, respec-
tively, of the occurrence of each i, j pair. q
ij
is given as
, where f
ij
is the total number of aligning
alphabets i to j. The factor e
ij
equals p
i
p
j
if i = j; otherwise, it
equals 2p
i
p
j
(if i ≠ j), where p
i
is the background probability of
occurrence of alphabet i and equals . Here,
the optimal c value is found by testing various values ranging
from 0.1 to 5.0; c is set to 1.89 for the best performance and
efficiency. The final score S
ij
is rounded to the nearest integer
value.
Additional data files
The following additional data are available with the online
version of this paper. Additional data file 1 is a table listing
674 protein pairs. Additional data file 2 is a figure showing the
representative 3D fragments of the 23-state structural
alphabet. Additional data file 3 is a figure showing the distri-
butions of a 23-state structural alphabet on each kind of eight
DSSP secondary structure codes. Additional data file 4 is a
table showing the rmsd between X-ray structures and recon-
structed structures using 23 representative segments on 38
proteins. Additional data file 5 is a figure showing an overview
of 3D-BLAST for structure database search. Additional data
file 6 is a table listing the average precision of each program
on 108 queries in SCOP-108. Additional data file 7 is a table
showing the recognition performance of nine methods on the
Lindahl's benchmark dataset at the family, superfamily, and
fold levels. Additional data file 8 is a table listing 976 proteins
of the Lindahl's benchmark.
Additional data file 1Table listing 674 protein pairsTable listing 674 protein pairs.Click here for fileAdditional data file 2Figure showing the representative 3D fragments of the 23-state structural alphabetFigure showing the representative 3D fragments of the 23-state structural alphabet.Click here for fileAdditional data file 3Figure showing the distributions of a 23-state structural alphabet on each kind of eight DSSP secondary structure codesFigure showing the distributions of a 23-state structural alphabet on each kind of eight DSSP secondary structure codes.Click here for fileAdditional data file 4Table showing the rmsd between X-ray structures and recon-structed structures using 23 representative segments on 38 proteinsTable showing the rmsd between X-ray structures and recon-structed structures using 23 representative segments on 38 proteins.Click here for fileAdditional data file 5Figure showing an overview of 3D-BLAST for structure database searchFigure showing an overview of 3D-BLAST for structure database search.Click here for fileAdditional data file 6Table listing the average precision of each program on 108 queries in SCOP-108Table listing the average precision of each program on 108 queries in SCOP-108.Click here for fileAdditional data file 7Table showing the recognition performance of nine methods on the Lindahl's benchmark dataset at the family, superfamily, and fold levelsTable showing the recognition performance of nine methods on the Lindahl's benchmark dataset at the family, superfamily, and fold levels.Click here for fileAdditional data file 8Table listing 976 proteins of the Lindahl's benchmarkTable listing 976 proteins of the Lindahl's benchmark.Click here for file
Acknowledgements
J-MY was supported by National Science Council and the University System
at Taiwan-Veteran General Hospital Grant. Authors are grateful to both
the hardware and software supports of the Structural Bioinformatics Core
Facility at National Chiao Tung University.
References
1. Burley SK, Almo SC, Bonanno JB, Capel M, Chance MR, Gaasterland
T, Lin D, Sali A, Studier FW, Swaminathan S: Structural genomics:
beyond the human genome project. Nat Genet 1999,
23:151-157.
2. Deshpande N, Addess KJ, Bluhm WF, Merino-Ott JC, Townsend-
Merino W, Zhang Q, Knezevich C, Xie L, Chen L, Feng Z, et al.: The
RCSB Protein Data Bank: a redesigned query system and
relational database based on the mmCIF schema. Nucleic
Acids Research 2005, 33:D233-D237.
3. Pearson WR, Lipman DJ: Improved tools for biological sequence
comparison. Proc Natl Acad Sci USA 1988, 85:2444-2448.
4. Karplus K, Barrett C, Hughey R: Hidden Markov models for
detecting remote protein homologies. Bioinformatics 1998,
14:846-856.
5. Altschul SF, Madden TL, Schaffer AA, Zhang J, Zhang Z, Miller W, Lip-
man DJ: Gapped BLAST and PSI-BLAST: a new generation of
protein database search programs. Nucleic Acids Res 1997,
25:3389-3402.
6. Holm L, Sander C: Protein structure comparison by alignment
ff
ij mk
k
m
m
/
==
∑∑
11
23
ii ik
ki
+
≠
∑
23
2/
Genome Biology 2007, Volume 8, Issue 3, Article R31 Tung et al. R31.15
comment reviews reports refereed researchdeposited research interactions information
Genome Biology 2007, 8:R31
of distance matrices. J Mol Biol 1993, 233:123-138.
7. Shindyalov IN, Bourne PE: Protein structure alignment by incre-
mental combinatorial extension (CE) of the optimal path.
Protein Eng 1998, 11:739-747.
8. Ortiz AR, Strauss CE, Olmea O: MAMMOTH (Matching molec-
ular models obtained from theory): an automated method
for model comparison. Protein Sci 2002, 11:2606-2621.
9. Aung Z, Tan KL: Rapid 3D protein structure database search-
ing using information retrieval techniques. Bioinformatics 2004,
20:1045-1052.
10. Carpentier M, Brouillet S, Pothier J: YAKUSA: a fast structural
database scanning method. Proteins 2005, 61:137-151.
11. Martin AC: The ups and downs of protein topology: rapid
comparison of protein structure. Protein Eng 2000, 13:829-837.
12. Guyon F, Camproux AC, Hochez J, Tuffery P: SA-Search: a web
tool for protein structure mining based on a structural
alphabet. Nucleic Acids Res 2004, 32:W545-W548.
13. Levitt M: Accurate modeling of protein conformation by auto-
matic segment matching. J Mol Biol 1992, 226:507-533.
14. Bystroff C, Baker D: Prediction of local structure in proteins
using a library of sequence-structure motifs. J Mol Biol 1998,
281:565-577.
15. Kolodny R, Koehl P, Guibas L, Levitt M: Small libraries of protein
fragments model native protein structures accurately. J Mol
Biol 2002, 323:297-307.
16. Camproux AC, Gautier R, Tuffery P: A hidden markov model
derived structural alphabet for proteins. J Mol Biol 2004,
339:591-605.
17. de Brevern AG, Etchebest C, Hazout S: Bayesian probabilistic
approach for predicting backbone structures in terms of pro-
tein blocks. Proteins 2000, 41:271-287.
18. Fetrow JS, Palumbo MJ, Berg G: Patterns, structures, and amino
acid frequencies in structural building blocks, a protein sec-
ondary structure classification scheme. Proteins 1997,
27:249-271.
19. Rooman MJ, Rodriguez J, Wodak SJ: Automatic definition of
recurrent local structure motifs in proteins. J Mol Biol 1990,
213:327-336.
20. Andreeva A, Howorth D, Brenner SE, Hubbard TJ, Chothia C, Murzin
AG: SCOP database in 2004: refinements integrate structure
and sequence family data. Nucleic Acids Res 2004, 32:D226-D229.
21. Huang CC, Venturi M, Majeed S, Moore MJ, Phogat S, Zhang M-Y,
Dimitrov DS, Hendrickson WA, Robinson J, Sodroski J, et al.: Struc-
tural basis of tyrosine sulfation and VH-gene usage in anti-
bodies that recognize the HIV type 1 coreceptor-binding site
on gp120. Proc Natl Acad Sci USA 2004, 101:2706-2711.
22. Adachi S, Park S-Y, Tame JRH, Shiro Y, Shibayama N: Direct obser-
vation of photolysis-induced tertiary structural changes in
hemoglobin. Proc Natl Acad Sci USA 2003, 100:7039-7044.
23. Kabsch W, Sander C: Dictionary of protein secondary struc-
ture: pattern recognition of hydrogen-bonded and geometri-
cal features. Biopolymers 1983, 22:2577-2637.
24. Banner DW, Bloomer AC, Petsko GA, Phillips DC, Wilson IA:
Atomic coordinates for triose phosphate isomerase from
chicken muscle. Biochem Biophys Res Commun 1976, 72:146-155.
25. Hogbom M, Stenmark P, Voevodskaya N, McClarty G, Graslund A,
Nordlund P: Radical site in chlamydial ribonucleotide reduct-
ase defines a new R2 subclass. Science 2004, 305:245-248.
26. Kumar S, Bansal M: Geometrical and sequence characteristics
of a-helices in globular proteins. Biophys J 1998, 75:1935-1944.
27. Barlow DJ, Thornton JM: Helix geometry in proteins. J Mol Biol
1988, 201:601-619.
28. Takano K, Yamagata Y, Yutani K: Role of amino acid residues at
turns in the conformational stability and folding of human
lysozyme. Biochemistry 2000, 39:8655-8665.
29. Milner-White EJ: Recurring loop motif in proteins that occurs
in righthanded and left-handed forms. Its relationship with α-
helices and β-bulge loops. J Mol Biol 1988, 199:503-511.
30. Hutchinson EG, Thornton JM: PROMOTIF: a program to iden-
tify and analyze structural motifs in proteins. Protein Sci 1996,
5:212-220.
31. Pearl F, Todd A, Sillitoe I, Dibley M, Redfern O, Lewis T, Bennett C,
Marsden R, Grant A, Lee D, et al.: The CATH Domain Structure
Database and related resources Gene3D and DHS provide
comprehensive domain family information for genome
analysis. Nucleic Acids Res 2005, 33:D247-D251.
32. Henikoff S, Henikoff JG: Amino acid substitution matrices from
protein blocks. Proc Natl Acad Sci USA 1992, 89:10915-10919.
33. Karlin S, Altschul SF: Methods for assessing the statistical signif-
icance of molecular sequence features by using general scor-
ing schemes. Proc Natl Acad Sci USA 1990, 87:2264-2268.
34. Altschul SF, Gish W, Miller W, Myers EW, Lipman DJ: Basic local
alignment search tool. J Mol Biol 1990, 215:403-410.
35. Altschul SF, Gish W: Local alignment statistics. Methods Enzymol
1996, 266:460-480.
36. Pearson WR: Empirical statistical estimates for sequence
similarity searches. J Mol Biol 1998, 276:71-84.
37. Lamb AL, Torres AS, O'Halloran TV, Rosenzweig AC: Het-
erodimeric structure of superoxide dismutase in complex
with its metallochaperone.
Nat Struct Biol 2001, 8:751-755.
38. Rosenzweig AC, Huffman DL, Hou MY, Wernimont AK, Pufahl RA,
O'Halloran TV: Crystal structure of the Atx1 metallochaper-
one protein at 1.02 A resolution. Structure 1999, 7:605-617.
39. Hurley JK, Weber-Main AM, Stankovich MT, Benning MM, Thoden JB,
Vanhooke JL, Holden HM, Chae YK, Xia B, Cheng H, et al.: Struc-
ture-function relationships in Anabaena ferredoxin: correla-
tions between X-ray crystal structures, reduction potentials,
and rate constants of electron transfer to ferredoxin:NADP+
reductase for site-specific ferredoxin mutants. Biochemistry
1997, 36:11100-11117.
40. Hickman AB, Namboodiri MA, Klein DC, Dyda F: The structural
basis of ordered substrate binding by serotonin N-acetyl-
transferase: enzyme complex at 1.8 A resolution with a bis-
ubstrate analog. Cell 1999, 97:361-369.
41. Roll-Mecak A, Cao C, Dever TE, Burley SK: X-Ray structures of
the universal translation initiation factor IF2/eIF5B:
conformational changes on GDP and GTP binding. Cell 2000,
103:781-792.
42. Neidhardt EA, Grossman TH, Ocain T, Clardy J: Structures of
human dihydroorotate dehydrogenase in complex with anti-
proliferative agents. Structure 2000, 8:25-33.
43. Hall LT, Sanchez RJ, Holloway SP, Zhu H, Stine JE, Lyons TJ, Demeler
B, Schirf V, Hansen JC, Nersissian AM, et al.: X-ray crystallographic
and analytical ultracentrifugation analyses of truncated and
full-length yeast copper chaperones for SOD (LYS7): a
dimer-dimer model of LYS7-SOD association and copper
delivery. Biochemistry 2000, 39:3611-3623.
44. Hu Y, Komoto J, Huang Y, Gomi T, Ogawa H, Takata YFM, Takusa-
gawa F: Crystal structure of S-adenosylhomocysteine hydro-
lase from rat live. Biochemistry 1999, 38:8323-8333.
45. Lindahl E, Elofsson A: Identification of related proteins on fam-
ily, superfamily and fold level. J Mol Biol 2000, 295:613-625.
46. Eddy SR: Profile hidden Markov models. Bioinformatics 1998,
14:755-763.
47. Boeckmann B, Bairoch A, Apweiler R, Blatter MC, Estreicher A,
Gasteiger E, Martin MJ, Michoud K, O'Donovan C, Phan I, et al.: The
SWISS-PROT protein knowledgebase and its supplement
TrEMBL in 2003. Nucleic Acids Res 2003, 31:365-370.
48. Schneider R, Sander C: The HSSP database of protein struc-
ture-sequence alignments. Nucleic Acids Res 1996, 24:201-205.
49. Zhang C, Kim SH: Overview of structural genomics: from
structure to function. Curr Opin Chem Biol 2003, 7:28-32.
50. Burley SK, Bonanno JB: Structural genomics of proteins from
conserved biochemical pathways and processes. Curr Opin
Struct Biol 2002, 12:383-391.
51. Todd AE, Marsden RL, Thornton JM, Orengo CA: Progress of
structural genomics initiatives: an analysis of solved target
structures. J Mol Biol 2005, 348:1235-1260.
52. Chance MR, Fiser A, Sali A, Pieper U, Eswar N, Xu G, Fajardo JE, Rad-
hakannan T, Marinkovic N: High-throughput computational and
experimental techniques in structural genomics. Genome Res
2004, 14:2145-2154.
53. Grandori R, Carey J: Six new candidate members of the alpha/
beta twisted open-sheet family detected by sequence simi-
larity to flavodoxin. Protein Sci 1994, 3:2185-2193.
54. Frazao C, Silva G, Gomes CM, Matias P, Coelho R, Sieker L, Macedo
S, Liu MY, Oliveira S, Teixeira M, et al.: Structure of a dioxygen
reduction enzyme from Desulfovibrio gigas. Nat Struct Biol 2000,
7:1041-1045.
55. Harris MA, Clark J, Ireland A, Lomax J, Ashburner M, Foulger R, Eil-
beck K, Lewis S, Marshall B, Mungall C, et al.: The Gene Ontology
(GO) database and informatics resource. Nucleic Acids Res
2004, 32:D258-D261.
56. Falquet L, Pagni M, Bucher P, Hulo N, Sigrist CJ, Hofmann K, Bairoch
A: The PROSITE database, its status in 2002. Nucleic Acids Res
2002, 30:235-238.
R31.16 Genome Biology 2007, Volume 8, Issue 3, Article R31 Tung et al. />Genome Biology 2007, 8:R31
57. Bateman A, Coin L, Durbin R, Finn RD, Hollich V, Griffiths-Jones S,
Khanna A, Marshall M, Moxon S, Sonnhammer ELL, et al.: The Pfam
protein families database. Nucleic Acids Res 2004, 32:D138-D141.