Báo cáo y học: "Genomic analysis of the relationship between gene expression variation and DNA polymorphism in Drosophila simulans" pps
Bạn đang xem bản rút gọn của tài liệu. Xem và tải ngay bản đầy đủ của tài liệu tại đây (340.18 KB, 14 trang )
Genome Biology 2008, 9:R125
Open Access
2008Lawniczaket al.Volume 9, Issue 8, Article R125
Research
Genomic analysis of the relationship between gene expression
variation and DNA polymorphism in Drosophila simulans
Mara KN Lawniczak
¤
*
, Alisha K Holloway
¤
†
, David J Begun
†
and
Corbin D Jones
‡
Addresses:
*
Division of Cell and Molecular Biology, Imperial College London, London, SW7 2AZ, UK.
†
Department of Evolution and Ecology
and Center for Population Biology, University of California, Shields Avenue, Davis, CA 95616, USA.
‡
Department of Biology and Carolina Center
for Genome Science, University of North Carolina, Chapel Hill, NC 27599, USA.
¤ These authors contributed equally to this work.
Correspondence: Mara KN Lawniczak. Email: Alisha K Holloway. Email:
© 2008 Lawniczak et al.; licensee BioMed Central Ltd.
This is an open access article distributed under the terms of the Creative Commons Attribution License ( which
permits unrestricted use, distribution, and reproduction in any medium, provided the original work is properly cited.
Expression variation and polymorphism<p>Analysis of six <it>Drosophila simulans</it> genotypes revealed that genes with greater variation in gene expression between geno-types also have higher levels of sequence polymorphism in many gene features.</p>
Abstract
Background: Understanding how DNA sequence polymorphism relates to variation in gene
expression is essential to connecting genotypic differences with phenotypic differences among
individuals. Addressing this question requires linking population genomic data with gene expression
variation.
Results: Using whole genome expression data and recent light shotgun genome sequencing of six
Drosophila simulans genotypes, we assessed the relationship between expression variation in males
and females and nucleotide polymorphism across thousands of loci. By examining sequence
polymorphism in gene features, such as untranslated regions and introns, we find that genes
showing greater variation in gene expression between genotypes also have higher levels of
sequence polymorphism in many gene features. Accordingly, X-linked genes, which have lower
sequence polymorphism levels than autosomal genes, also show less expression variation than
autosomal genes. We also find that sex-specifically expressed genes show higher local levels of
polymorphism and divergence than both sex-biased and unbiased genes, and that they appear to
have simpler regulatory regions.
Conclusion: The gene-feature-based analyses and the X-to-autosome comparisons suggest that
sequence polymorphism in cis-acting elements is an important determinant of expression variation.
However, this relationship varies among the different categories of sex-biased expression, and trans
factors might contribute more to male-specific gene expression than cis effects. Our analysis of sex-
specific gene expression also shows that female-specific genes have been overlooked in analyses
that only point to male-biased genes as having unusual patterns of evolution and that studies of
sexually dimorphic traits need to recognize that the relationship between genetic and expression
variation at these traits is different from the genome as a whole.
Published: 12 August 2008
Genome Biology 2008, 9:R125 (doi:10.1186/gb-2008-9-8-r125)
Received: 6 March 2008
Revised: 20 May 2008
Accepted: 12 August 2008
The electronic version of this article is the complete one and can be
found online at /> Genome Biology 2008, Volume 9, Issue 8, Article R125 Lawniczak et al. R125.2
Genome Biology 2008, 9:R125
Background
Phenotypic differences among individuals result, in part,
from variation in gene expression caused by underlying
sequence polymorphism. Thus, a deeper understanding of the
relationship between sequence polymorphism and expres-
sion variation (defined here as within species differences in
transcript abundance across genotypes) is a crucial compo-
nent of connecting genotype to phenotype and of elucidating
the mechanisms of phenotypic evolution. Several previous
studies have combined genome-wide gene expression data
with divergence estimates in protein coding regions to inves-
tigate the relationship between genotype and phenotype. For
example, genes that show significant expression variation
within species tend to be more diverged at amino acid sites
between species and are often male-biased in their expression
[1-4]. The same patterns are found for genes that have
diverged in expression between species [3,5-7]. Finally, more
highly expressed genes tend to show lower levels of both pol-
ymorphism and divergence in coding regions [1,3,8].
Sequence variation of cis-acting regulatory regions is clearly
important in determining expression differences within spe-
cies [9,10] and between species [7,11,12] (reviewed in [13,14]).
Several recent studies have also shown that expression varia-
tion within a species is correlated with local levels of nucle-
otide heterozygosity [8,15,16]. However, in many studies,
expression variation could have been confounded with
sequence variation, as there has been no way of evaluating or
correcting for probe mismatch between the strains used and
the reference upon which the expression array was designed.
We examine expression variation in genotypes that have been
recently whole-genome shotgun sequenced [17], which pro-
vides us with the information necessary to mask probes that
show differences from the reference sequence. The genome
sequence data also give us accurate estimates of nucleotide
heterozygosity within gene features for the same genotypes,
which allows us to investigate the connection between local
sequence variation and expression variation on a genomic
scale. Thus far, this relationship has been examined only in
Saccharomyces cerevisiae, where an enrichment of sequence
polymorphisms between two strains was observed in the pro-
moter regions and the 3' untranslated regions (UTRs) of
genes that showed expression differences between the strains
[16].
A description of the genomic relationship between expression
variation and local heterozygosity would allow one to begin
investigating the connection between these sources of varia-
tion in different functional elements, such as UTRs, coding
regions and introns, and provide some information regarding
the physical scale over which sequence variation is correlated
with expression variation. A strong positive correlation
between nucleotide heterozygosity and expression variation
would provide genomic evidence for the relationship between
cis-acting sequence variants and expression variation. Fur-
thermore, such a positive correlation would raise interesting
questions about the population genetic factors influencing
expression variation. Two population genetic models for
explaining local variation in heterozygosity are hitchhiking
effects of linked beneficial mutations and variation in neutral
mutation rates. A positive correlation between heterozygosity
and expression variation would suggest one of two mecha-
nisms. First, recent hitchhiking events in cis-acting regions
would reduce sequence variation and, therefore, expression
variation. Under a second mechanism, if the neutral mutation
rate were high, variation at cis-acting regulatory sites would
be manifest as elevated variation in expression levels. Alter-
natively, a weak relationship between local levels of heterozy-
gosity and expression variation might suggest that trans-
acting effects are more important determinants of gene
expression variability.
Here, we use whole genome polymorphism data to examine
the relationship between sequence polymorphism and
expression variation at a genomic scale. The strength of our
data lies in having assessed gene expression variation from
the same six D. simulans lines for which we have whole
genome sequences. We also revisit the previously examined
relationship of sequence divergence and gene expression var-
iation using our D. simulans data in combination with the
whole genome sequences of Drosophila melanogaster and
Drosophila yakuba
. Using these resources, we summarize
sequence polymorphism and divergence in specific features
of annotated genes including coding regions, UTRs, putative
core promoter regions (CPRs), and introns. We then examine
whether expression variation is related to sequence polymor-
phism (and divergence) in particular features at a genomic
level.
A second focus of this work is to understand whether there are
different relationships between expression variation and
sequence polymorphism depending on chromosomal loca-
tion, gene expression level, and sex biased expression. As
there is clear evidence for reduced sequence polymorphism
on the X chromosome [17], we ask whether there is reduced
expression variation among X-linked genes compared to
autosomal genes. Highly expressed genes have repeatedly
been shown to be less polymorphic and evolve more slowly
than lowly expressed genes [1,3,8] and we also examine
whether these categories have different tendencies for varia-
ble expression. Finally, we examine the relationship between
sequence polymorphism and expression variation for differ-
ent categories of sex bias. As males and females share a com-
mon genome, sexual dimorphism is determined by
differences in gene expression [18]. The factors controlling
sexually dimorphic gene expression could be very different
from those controlling unbiased gene expression. Compari-
son of sex-specific genes to unbiased genes will determine if
the relationship between expression and genetic variation at
sexually dimorphic genes is different from the genome as a
whole.
Genome Biology 2008, Volume 9, Issue 8, Article R125 Lawniczak et al. R125.3
Genome Biology 2008, 9:R125
Results
Gene expression variation and population genomic
sequence data
Genome-wide summaries of sequence length, polymorphism
and divergence for each gene feature for which we have
detectable expression data are presented in Table 1. Our
microarray data show 313 genes in males and 119 genes in
females with significant expression variation between lines
after Bonferroni correction. Taking a slightly less conserva-
tive approach (p < 0.001), 16% of genes (1,262/7,949) and
10% of genes (723/7,128 genes) show expression variation in
males and females, respectively.
Variably expressed genes (p < 0.001) show significantly
higher nucleotide heterozygosity in all gene features except
for the putative 5' CPR (see Materials and methods for defini-
tion). This relationship extends beyond the genes exhibiting
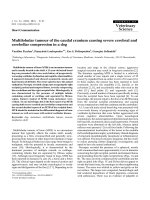
the most dramatic expression variation (Figure 1) and is visi-
ble even among genes that have marginal expression varia-
tion (p < 0.05, noted with asterisks in Figure 1). Figure 1
shows that the positive relationship between π and expression
variation is strong for the coding regions and 3'UTRs, weak
for introns and 5'UTRs, and is absent for CPRs. These results
are robust to different bin sizes (Materials and methods). Var-
iably expressed genes also have significantly shorter coding
sequences, 5'UTRs, intronic regions, and 3'UTRs, and signif-
icantly fewer introns than non-variably expressed genes in
both sexes (Table 1). In other words, variably expressed genes
are shorter and more polymorphic than other genes.
We have done our best to remove the possibility that the rela-
tionship between expression variation and nucleotide hetero-
zygosity is due to probe mismatch by removing all probes that
show any divergence from the D. melanogaster sequence in
Table 1
Gene feature length, polymorphism and divergence by gene expression variation for each sex
Male* Female*
Genome average NS
†
SIG
‡
X
2
p-value
§
NS
†
SIG
‡
X
2
p-value
§
Number of genes 6,687 1,262 6,405 723
Length
EXON 1,675 1,726 1,357 67.07 *** 1,768 1,416 36.94 ***
5'UTR 239 251 198 59.68 *** 248 216 16.59 ***
Intron 2,493 2,750 1,764 16.14 *** 2,598 2,390 4.51 0.0336
Number of introns 3.55 3.69 3.11 16.42 *** 3.67 3.11 13.68 0.0002
3'UTR 392 418 299 96.22 *** 414 353 28.52 ***
Polymorphism
CPR 0.0290 0.0290 0.0284 0.88 0.3479 0.0297 0.0304 0.32 0.5727
5'UTR 0.0112 0.0108 0.0127 13.34 0.0003 0.0108 0.0122 5.94 0.0148
Nonsynonymous 0.0024 0.0022 0.0029 43.56 *** 0.0021 0.0026 21.63 ***
Synonymous 0.0318 0.0308 0.0357 62.93 *** 0.0310 0.0355 28.04 ***
First intron 0.0277 0.0274 0.0294 6.45 0.0100 0.0266 0.0284 6.82 0.0090
All introns 0.0302 0.0297 0.0324 12.53 0.0004 0.0290 0.0317 9.56 0.0020
3'UTR 0.0122 0.0114 0.0156 66.80 *** 0.0110 0.0151 54.52 ***
Divergence
¶
CPR 0.0525 0.0532 0.0468 26.96 *** 0.0543 0.0514 3.16 0.0757
5'UTR 0.0229 0.0224 0.0225 0.01 0.9063 0.0223 0.0216 0.11 0.7392
Nonsynonymous 0.0060 0.0057 0.0065 17.96 *** 0.0049 0.0054 13.64 0.0002
Synonymous 0.0531 0.0526 0.0538 5.41 0.0200 0.0522 0.0541 5.79 0.0160
First intron 0.0463 0.0457 0.0472 3.07 0.0797 0.0448 0.0480 3.70 0.0546
All introns 0.0487 0.0480 0.0503 4.98 0.0256 0.0472 0.0512 9.11 0.0025
3'UTR 0.0228 0.0217 0.0256 22.61 *** 0.0209 0.0244 20.22 ***
*Male and female sets include genes that are expressed in that sex, but may also be expressed in the other sex.
†
NS, not significantly differentially
expressed between genotypes (AOV p-value > 0.001).
‡
SIG, significantly differentially expressed between genotypes (AOV p-value ≤ 0.001).
§
X
2
and
p-values derived from Kruskal Wallis; three asterisks denote p-value < 0.0001.
¶
Divergence refers to lineage specific divergence along the D. simulans
branch.
Genome Biology 2008, Volume 9, Issue 8, Article R125 Lawniczak et al. R125.4
Genome Biology 2008, 9:R125
Figure 1 (see legend on next page)
NonSyn
0.000
0.002
0.003
0.004
0.025
0.030
0.035
0.040
0.000
0.025
0.030
0.035
0.040
0.000
Intron1
0.000
0.002
0.003
0.004
0.000
0.025
0.030
0.035
5'UTR
0.000
0.010
0.012
0.014
0.016
0.000
0.010
0.012
0.014
0.016
0.000
0.025
0.030
0.035
CPR
0.000
0.025
0.030
0.035
0.000
0.025
0.030
0.035
3'UTR
0.000
0.008
0.010
0.012
0.014
0.016
0.018
0.020
0.006
0.008
0.010
0.012
0.014
0.016
0.018
0.020
*
*
*
*
*
*
*
*
*
*
*
*
0.040 0.040
Syn
Low
expression
variance
High
expression
variance
Low
expression
variance
High
expression
variance
Male Female
Genome Biology 2008, Volume 9, Issue 8, Article R125 Lawniczak et al. R125.5
Genome Biology 2008, 9:R125
addition to any polymorphism within the D. simulans
genome sequences (see Materials and methods). However,
due to the light coverage of the D. simulans genome
sequences, for many probes we are missing sequence data for
some genotypes. Therefore, we also exclude all probes that
have fewer than two genotypes that show perfect concordance
with the D. melanogaster probe sequence (coverage n ≥ 2).
We also confirmed that our results were robust when we
increased the stringency to n ≥ 4 at each site within a probe
(Table S1 in Additional data file 1; see Materials and meth-
ods). Additionally, for any given gene, we found no significant
difference in the average intensity (for example, expression
level) between genotypes with no coverage in comparison to
genotypes with sequence coverage (Materials and methods).
Furthermore, for any given gene, the genotype that is most
differentially expressed is missing sequence information no
more frequently than expected by chance (χ
2
= 1.177, p =
0.2779). We repeated this analysis for the top 500 statistically
significant genes and also found no effect. Finally, our results
are robust even when we exclude all significantly differen-
tially expressed genes for which the outlier genotype is miss-
ing sequence data (data not shown). These results strongly
suggest that unobserved polymorphisms at probe sites are
not confounding our analyses (see Materials and methods).
Similar to the relationship with polymorphism, expression
variation in both sexes has a positive relationship with
sequence divergence in coding regions, 3'UTRs and, to a
lesser extent, introns (Table 1). However, the relationship
between expression variation and heterozygosity is quite dif-
ferent from the relationship between expression variation
and sequence divergence for some functional elements. For
example, expression variation is positively associated with
5'UTR polymorphism, but not 5'UTR divergence (Table 1).
Additionally, expression variation is significantly negatively
associated with CPR divergence in the male analysis but
shows no relationship with CPR polymorphism (Table 1).
X-linkage
X-linked genes are far less likely than autosomal genes to vary
between genotypes in expression, especially in males (Mann-
Whitney U test (MWU): males X
2
= 55.25, p < 0.0001;
females X
2
= 17.51, p < 0.0001). However, male-expressed X-
linked genes have significantly lower average gene expression
than autosomal genes (X
2
= 8.92, p = 0.0028) whereas
female-expressed genes do not differ in their expression level
depending on chromosomal location (X
2
= 0.06, p = 0.80).
This lower gene expression intensity among male-expressed
X-linked genes might reduce our ability to detect significant
expression differences for this category. Even when we
restrict our analysis to only average and highly expressed
genes - thereby completely removing the significant differ-
ence in average gene expression intensity between X and
autosomes - we find that the male-expressed X-linked genes
are still less likely to show significant expression variation
than are autosomal genes (X
2
= 35.25, p < 0.0001).
Expression level
We find that most gene features of highly expressed genes are
less heterozygous than those of average or lowly expressed
genes (Tables 2 and 3 for males and females, respectively) yet
highly expressed genes are more likely to show expression
variation than average or lowly expressed genes as previously
reported [1,3,8]. It is important to note that our reduced abil-
ity to detect expression variation in lowly expressed genes
might contribute to the finding that highly expressed genes
are more likely to show variable expression. Although highly
expressed genes have lower overall levels of polymorphism,
the positive relationships shown in Table 1 between sequence
polymorphism in the various gene features and expression
variation are still strong for average and highly expressed
genes and weak for lowly expressed genes (data not shown).
Highly expressed genes also show lower levels of divergence
in UTRs, introns, and coding regions (Tables 2 and 3) consist-
ent with previous reports [2,19,20]. However, the CPR shows
the opposite trend, with highly expressed genes having
greater heterozygosity and greater divergence (Tables 2 and
3). Highly expressed genes also tend to have shorter gene fea-
tures and fewer introns than average expressed genes, which
are, in turn, shorter than lowly expressed genes (Tables 2 and
3).
Sex bias
Genes were divided into five sex-related categories - male-
specific, male-biased, female-specific, female-biased, and
unbiased (see Materials and methods). The relationship
between nucleotide variation, expression variation, and sex
bias is complicated but several general patterns emerge
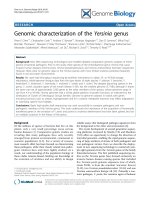
Significant expression variation between genotypes is associated with elevated levels of sequence polymorphism at most types of sitesFigure 1 (see previous page)
Significant expression variation between genotypes is associated with elevated levels of sequence polymorphism at most types of sites. The y-axis is the per
site nucleotide diversity (note: axis scale varies by feature). The pink line indicates the genomic mean nucleotide diversity and yellow lines indicate 95%
confidence intervals around the genomic mean. The x-axis represents the level of expression variation between genotypes for the different gene features
as named (5'UTR, untranslated region; CPR, core promoter region; NonSyn, nonsynonymous sites; Syn, synonymous sites). P-values from the AOV of
expression variation were sorted and grouped into 15 equal sized bins. Bins on the left side of the figure have no evidence of expression variation and bins
on the right have the most variably expressed genes. For each bin, blue circles represent the mean nucleotide diversity with standard error bars.
Permutation tests examined whether nucleotide diversity was higher within each bin than in a random sample of genes from the genome. The asterisk
marks the bin in which an average p-value = 0.05 occurs. To the right of the asterisk, a positive trend is observed in some gene features, suggesting that the
positive relationship between gene expression variation and nucleotide polymorphism is not solely confined to the most dramatically differentially
expressed genes.
Genome Biology 2008, Volume 9, Issue 8, Article R125 Lawniczak et al. R125.6
Genome Biology 2008, 9:R125
(Table 4; see Table S2 in Additional data file 2 for more
details). Polymorphism in coding regions and 5'UTRs is sig-
nificantly higher in sex-specific genes than non-sex-specific
genes (the pooled class of sex-biased and unbiased genes).
Male-specific and male-biased genes have lower levels of pol-
ymorphism in the CPR than other genes, but higher levels of
polymorphism in introns and 3'UTRs. Overall, sex-specific
genes show greater levels of divergence in most gene features;
however, rates of amino acid evolution in male-specific genes
are strikingly higher than all other classes of bias (Table 4). In
contrast, in the CPR, female-biased and female-specific genes
are evolving more rapidly than unbiased genes, which are, in
turn, evolving more rapidly than male-biased and male-spe-
cific genes (Table 4). Coding sequence length also shows a
strong relationship with sex bias (Table 4). Female-specific
and female-biased coding regions are longer than unbiased
genes, which are, in turn, longer than male-biased and male-
specific genes. Sex-specific genes have significantly shorter
UTRs and significantly fewer introns than sex-biased and
unbiased genes (Table 4). This result is somewhat surprising
for female-specific genes as they have among the longest cod-
ing regions.
Discussion
Gene expression variation and population genomic
sequence data
The recent analysis of six genomes of D. simulans provided
the first glimpse of whole genome population variation in a
higher eukaryote [17]. We used polymorphism and diver-
gence estimates for gene features (for example, UTRs,
introns, and so on) together with expression variation meas-
ured using Affymetrix gene expression arrays (see Materials
and methods) to examine the relationship between expres-
sion variation and local sequence polymorphism. Local or cis
variation can affect gene transcription by modifying
enhancer, promoter, or microRNA (miRNA) target sites.
However, local sequence variation can also mislead us with
respect to gene expression variation if probes hybridize dif-
ferently due to undetected sequence polymorphism. Recent
Table 2
Gene feature length, polymorphism and divergence in males for genes with high, average and low levels of expression
Low Average High Tukey's HSD summary* X
2
p-value
†
Number of genes 2,073 4,167 1,709
Length
EXON 1,874 1,747 1,225 L>A>H 306.91 ***
5'UTR 282 240 207 L>A>H 16.62 0.0002
Intron 3,644 2,521 1,450 L>A>H 7.11 0.0286
Number of introns 3.86 3.75 2.88 L=A>H 63.89 ***
3'UTR 503 380 338 L>A>H 77.77 ***
Polymorphism
CPR 0.0277 0.0295 0.0290 L=A=H 13.40 0.0012
5'UTR 0.0114 0.0116 0.0097 L=A>H 24.01 ***
Nonsynonymous 0.0029 0.0023 0.0016 L>A>H 245.83 ***
Synonymous 0.0335 0.0322 0.0277 L>A>H 86.68 ***
First intron 0.0290 0.0276 0.0263 L≥A≥H 7.58 0.0226
All introns 0.0317 0.0301 0.0284 L≥A≥H 9.52 0.0086
3'UTR 0.0131 0.0122 0.0109 L=A>H 41.23 ***
Divergence
‡
CPR 0.0493 0.0533 0.0528 A=H>L 19.77 ***
5'UTR 0.0225 0.0232 0.0208 A≥L≥H 12.66 0.0018
Nonsynonymous 0.0066 0.0060 0.0047 L>A>H 155.62 ***
Synonymous 0.0524 0.0543 0.0494 A≥L≥H 35.69 ***
First intron 0.0475 0.0463 0.0433 L=A>H 7.79 0.0203
All introns 0.0483 0.0492 0.0462 A≥L≥H 7.06 0.0293
3'UTR 0.0237 0.0225 0.0204 L=A>H 22.83 ***
*L, low expression; A, average expression; H, high expression (see Materials and methods).
†
X
2
and p-values derived from Kruskal Wallis; three
asterisks denote p-value < 0.0001.
‡
Divergence refers to lineage specific divergence along the D. simulans branch.
Genome Biology 2008, Volume 9, Issue 8, Article R125 Lawniczak et al. R125.7
Genome Biology 2008, 9:R125
findings suggesting that protein divergence between species
strongly correlates with expression divergence between spe-
cies (for example, [2,3]) have been called into question [21].
Larracuente et al. [21] examined expression and protein
divergence for seven Drosophila species using species-spe-
cific arrays. They found that expression divergence is largely
uncoupled from protein divergence and they suggest that
hybridization mismatch errors might have confounded previ-
ous research. Although we only examine gene expression var-
iation within a species here, it is important to point out that
the probe sequence issues are similar and can bias our results
as polymorphism in probe regions can also cause errors in our
measurements of transcription. We ameliorated this problem
by: first masking probes that showed any divergence from D.
melanogaster (on which the chip was based) or any polymor-
phisms within D. simulans; second, examining whether our
results are robust to different coverage stringencies when
there are missing data (they are); and third, examining
whether genotypes with missing probe sequence data are
more likely to be expression outliers than expected by chance
(they are not). After these corrections and tests, we found a
positive relationship between nucleotide polymorphism and
expression variation that is particularly strong for coding
regions and 3'UTRs (Table 1, Figure 1). While the strong pos-
itive relationship between nucleotide polymorphism and
expression variation observed for features of the transcript
suggests that the physical scale over which heterozygosity is
correlated with expression variation may be gene-sized or
larger, the results also suggest that smaller scale effects of
heterozygosity may occur, as the relationship is quite differ-
ent for the 3'UTR versus the core promoter region.
3'UTR evolution
This first demonstration of a genome-wide positive relation-
ship between expression variation and nucleotide polymor-
phism in the 3'UTR suggests a functional link between these
types of variation. 3'UTRs contain several types of regulatory
elements, including binding sites for miRNAs and AU-rich
elements, which are known to regulate gene expression. For
example, miRNAs can bind and control protein abundance by
Table 3
Gene feature length, polymorphism and divergence in females for genes with high, average and low levels of expression
Low Average High Tukey's HSD summary* X
2
p-value
†
Number of genes 1,652 3,999 1,477
Length
EXON 1,877 1,825 1,319 L=A>H 198.71 ***
5'UTR 287 241 213 L>A>H 15.53 0.0004
Intron 3,845 2,521 1,386 L>A>H 20.64 ***
Number of introns 3.97 3.71 2.94 L=A>H 48.06 ***
3'UTR 547 366 384 L>H=A 108.03 ***
Polymorphism
CPR 0.0260 0.0304 0.0315 H=A>L 59.21 ***
5'UTR 0.0110 0.0115 0.0094 A=L>H 28.06 ***
Nonsynonymous 0.0028 0.0021 0.0013 L>A>H 341.18 ***
Synonymous 0.0337 0.0325 0.0259 L=A>H 148.96 ***
First intron 0.0283 0.0272 0.0240 L=A>H 19.94 ***
All introns 0.0309 0.0298 0.0260 L=A>H 24.77 ***
3'UTR 0.0136 0.0116 0.0089 L>A>H 106.22 ***
Divergence
‡
CPR 0.0452 0.0550 0.0597 H>A>L 132.46 ***
5'UTR 0.0218 0.0229 0.0209 A≥L≥H 6.70 0.0350
Nonsynonymous 0.0066 0.0048 0.0034 L>A>H 243.38 ***
Synonymous 0.0513 0.0546 0.0476 A≥L≥H 79.80 ***
First intron 0.0471 0.0459 0.0411 L=A>H 13.88 0.0010
All introns 0.0482 0.0489 0.0437 A=L>H 22.22 ***
3'UTR 0.0241 0.0221 0.0168 74.98 ***
*L, low expression; A, average expression; H, high expression (see Materials and methods).
†
X
2
and p-values derived from Kruskal Wallis; three
asterisks denote p-value < 0.0001.
‡
Divergence refers to lineage specific divergence along the D. simulans branch.
Genome Biology 2008, Volume 9, Issue 8, Article R125 Lawniczak et al. R125.8
Genome Biology 2008, 9:R125
suppressing translation or marking mRNAs for degradation
(reviewed in [22]). In animals, knockouts of miRNAs produce
variable results, ranging from no observable phenotype to
developmental-stage specific death [23]. This indicates that,
in many cases, miRNA-based regulation is both redundant
with other methods of control and could be more important
in fine-tuning protein levels rather than causing dramatic
changes in abundance [23]. Also, analyses examining gene
expression divergence across species in known miRNA target
genes find that these genes are less likely to show expression
divergence than non-targets [24]. Given these results, it is
unclear whether there would be broad scale patterns observ-
able between expression variation and sequence polymor-
phism in miRNA target genes. Nevertheless, miRNAs are
thought to have a large impact on 3'UTR evolution with selec-
tion limiting miRNA complementary sites and 3'UTR length
(thus avoiding additional binding sites) [25]. These patterns
all suggest that the expression variation we observe to be
tightly correlated with 3'UTR variation is unlikely to be
caused by miRNA regulation. To further explore this, we
examined the set of all predicted target miRNA targets [26]
(retrieved from [27]) and we find that polymorphism in the
3'UTR of target genes is dramatically lower than non-targets
(target 3'UTR average π = 0.00795 (n = 2,945); non-target
3'UTR average π = 0.0147 (n = 5,526); X
2
= 185.28, p <
0.0001). Of course, this is perhaps not surprising given that
targets were identified by conservation in binding sites across
many Drosophila species, and thus are likely highly con-
served functionally [26]. However, the relationship between
3'UTR variation and expression variation among genes with
known miRNA targets is also much weaker (target 3'UTR π in
SIG (significantly varying genes) = 0.0087, NS (non-signifi-
cantly varying genes) = 0.0077, X
2
= 6.21, p = 0.0127; non-
target 3'UTR π in SIG = 0.0185, NS = 0.0138, X
2
= 49.04, p <
Table 4
Gene feature length, polymorphism and divergence for sex-specific*, sex-biased*, and unbiased genes
X
2
p-value
†
Tukey's HSD summary
‡
Summary
§
Number of genes
Length
EXON 247.10 *** Fb≥Fs≥U≥Mb≥Ms F>U>M
5'UTR 133.27 *** U,Fb≥Mb≥Ms,Fs NSS>SS
Intron 131.81 *** U≥Mb,Fb,Ms>Fs NSS>SS
Number of introns 64.44 *** U,Fb≥Mb≥Ms,Fs NSS>SS
3'UTR 236.01 *** U≥Fb≥Mb>Ms,Fs NSS>SS
5' intergenic 291.9 *** Ms>Mb,U,Fs≥Fb M>F,U
3' intergenic 274.6 *** Ms≥Mb≥U,Fb,Fs M>F,U
Polymorphism
CPR 79.64 *** Fb,Fs,U>Ms,Mb F,U>M
5'UTR 22.14 0.0002 Ms,Fs≥Fb,Mb≥U SS>NSS
Nonsynonymous 305.11 *** Ms≥Fs≥Mb≥U,Fb SS>NSS
Synonymous 33.62 *** Fs,Ms≥Mb≥U,Fb SS>NSS
First intron 59.49 *** Ms≥Mb≥Fs,U,Fb M>F,U
All introns 48.10 *** Ms≥Mb≥Fs,Fb,U M>F,U
3'UTR 156.48 *** Ms≥Mb≥Fs>U>Fb M>F,U
Divergence
¶
CPR 212.79 *** Fb,Fs>U>Ms,Mb F>U>M
5'UTR 80.02 *** Fs≥Ms>Fb≥Mb≥U SS>NSS
Nonsynonymous 533.92 *** Ms>Fs,Mb>Fb,U SS>NSS
Synonymous 81.82 *** Ms≥Fs,Fb,Mb≥U SS>NSS
First intron 68.47 *** Ms,Fs≥Mb≥Fb,U SS>NSS
All introns 55.72 *** Ms≥Fs≥Mb≥Fb,U SS>NSS
3'UTR 259.87 *** Ms≥Fs≥Mb≥Fb≥U SS>NSS
*Male- and female-specific sets include genes that are expressed only in that sex, whereas sex-biased are expressed, on average, three-fold higher in
one sex than the other.
†
X
2
and p-values derived from Kruskal Wallis; three asterisks denote p-value < 0.0001.
‡
Ms, male-specific; Mb, male-biased;
Fs, female-specific; Fb, female-biased; U, unbiased.
§
F, female; M, male; U, unbiased; NSS, non-sex-specific; SS, sex-specific.
¶
Divergence refers to
lineage specific divergence along the D. simulans branch.
Genome Biology 2008, Volume 9, Issue 8, Article R125 Lawniczak et al. R125.9
Genome Biology 2008, 9:R125
0.0001). This might further suggest that miRNA target site
polymorphism is not a major contributor to expression varia-
tion, although it is important to note that our power to detect
the relationship is also reduced, given lower levels of 3'UTR
polymorphism.
Interestingly, a recent study reported that adaptive evolution
of the 3' regulatory sequence is associated with recently
evolved increased levels of expression in D. simulans [6]. Our
results provide further support that the functional elements
in the 3'UTR harbor sequence variants with significant
impacts on expression variation. Although expression varia-
tion within species may not be related to miRNA control,
there are many other aspects of the 3'UTR that can affect
transcript abundance [28-30].
Core promoter region evolution
Unlike all other gene features examined here, heterozygosity
in the CPR shows no strong evidence of a link with expression
variation (Table 1, Figure 1). This is somewhat surprising as
CPRs presumably include regulatory elements that might
contain polymorphisms that contribute to expression varia-
tion. A recent study examining polymorphism in the
upstream 1-2 Kb of a small set of genes that vary and do not
vary in expression between D. melanogaster genotypes also
found no relationship between upstream polymorphism and
gene expression differences [31]. We suggest several possible
explanations for this result. First, while the CPR might be
functionally important for gene regulation, polymorphism at
a small number of sites may be responsible for expression
variation, thus preventing us from detecting a genomic rela-
tionship. Alternatively, CPR variants affecting expression
variation may occur at low frequency and make only a small
contribution to heterozygosity. For either of these two scenar-
ios to be true, one must assume that CPR variants evolve
under a distinctly different evolutionary regime than other
types of either coding or non-coding variation. We have no
evidence for this unusual assumption. In fact, our compari-
sons between the X and the autosomes show that levels of
expression variation reflect overall patterns of sequence vari-
ation, suggesting the action of common evolutionary mecha-
nisms. Thus, our first two explanations seem implausible.
Instead we suspect that heterozygosity in trans-acting factors
that interact with CPRs may instead shape the CPR's role in
expression variation, perhaps leading to constraint in this
region. From a population genetics perspective, however, we
would expect to see reduced heterozygosity in CPRs relative
to other gene features if they have greater functional con-
straint and this general pattern was not observed; in fact,
UTRs are much less polymorphic and diverged than CPRs
(Table 1).
However, if genes are examined by sex bias, this relationship
changes. Male-biased and male-specific genes show signifi-
cantly lower levels of polymorphism and divergence in the
CPR than other categories of bias (Table 4). Furthermore, in
spite of showing no relationship with heterozygosity in the
CPR, variably expressed genes in males show reduced levels
of divergence in the CPR (Table 1; Figure S1 in Additional data
file 3). This is not true for variably expressed genes in females.
Sequence conservation in the CPR among genes that are var-
iably expressed in males supports the idea that the CPRs of
these genes experience functional constraint because they
contain important regulatory elements. This is the case for
TATA-box containing genes, which are more variably
expressed than TATA-less genes. TATA-box containing genes
have twice as many transcription factor binding sites on aver-
age than TATA-less genes and thus show higher levels of
sequence conservation in the CPR [32]. We find this pattern
in our data, too, with TATA-box containing genes having
much lower levels of polymorphism and divergence in the
CPR, yet being significantly more likely to show expression
variation (data not shown). Furthermore, TATA-box contain-
ing genes show no relationship between expression variation
and nucleotide variation for any of the gene features. TATA-
box containing genes, therefore, might be more likely to be
influenced by distant cis or by trans-acting variation than
local cis variation. In a recent study, a mutated TATA-box was
demonstrated to have less frequent and lower magnitude
transcriptional bursts than a conserved TATA-box, suggest-
ing that the conserved TATA-box facilitates the formation of
a stable transcription scaffold and this allows for rapid bursts
of transcription [33]. Indeed, TATA-box containing genes are
more likely to be stress-response genes, which must be capa-
ble of rapid bursts of transcription. In Arabidopsis, genes
observed to change regulation under a variety of conditions
(multi-stimuli response genes) have a greater likelihood of
containing a TATA-box, a higher density of cis-elements in
upstream regions, and longer upstream intergenic regions
[34]. These multi-stimuli response genes are also shorter and
have fewer introns so might be produced more economically
[34]. Interestingly, all the patterns mentioned above for
TATA-box containing genes are also true for male-biased
genes; they tend to be more variably expressed, shorter, con-
tain fewer introns and they have higher levels of conservation
in the CPR. Furthermore, male-specific and male-biased
genes show much greater upstream and downstream inter-
genic distances (Table 4), again similar to TATA-box contain-
ing genes. Perhaps male-specific and male-biased genes are
more likely to be under the control of distant cis-regulatory
elements or trans-factors. This could allow for the decoupling
of local cis variation affecting expression from coding
sequence variation. If the mutational target for expression
changes is farther away from the coding sequence, then each
can evolve more independently of the other. Male-biased and
male-specific genes are notoriously rapidly evolving and a
mechanism that decouples this rapid evolution from linked
expression changes and allows each phenotype to evolve
independently of the other could be beneficial. In a mutation
accumulation experiment in yeast, the trans mutational tar-
get size and the presence of a TATA-box were each positively
correlated with the likelihood that a gene changed in expres-
Genome Biology 2008, Volume 9, Issue 8, Article R125 Lawniczak et al. R125.10
Genome Biology 2008, 9:R125
sion over time [35]. Male-biased gene expression is very labile
over time [36], perhaps suggesting again that these genes are
more influenced by trans variation than cis variation.
X-linkage
Our results support previous research showing that the X
chromosome is depleted of male-biased and male-specific
genes and enriched for female-biased and female-specific
genes (Table 4) [5,37,38]. A novel finding in our analyses is
that the lower sequence polymorphism often observed on the
X chromosome is reflected in less variable expression of X-
linked genes, especially in males. This relationship supports
the finding that local sequence variation and expression vari-
ation are linked. We find that males also have significantly
lower average gene expression on the X than autosomes. The
chromosome biology of the X and autosomes differs greatly as
males are hemizygous for the X. In a majority of X-linked
genes, dosage is equalized through hypertranscription medi-
ated by the dosage compensation complex [39]. Incomplete
dosage compensation on the X in males is a possible source of
reduced average expression [39]. However, even after remov-
ing lowly expressed genes, males have significantly fewer var-
iably expressed X-linked genes than autosomal genes.
Expression level
Consistent with previous research, genes expressed highly in
both sexes are more likely to show significant expression var-
iation than average or lowly expressed genes (X
2
= 56.96, p <
0.0001; [2]), but, as noted, this may be due to technical diffi-
culties in detecting differences in expression of lowly
expressed genes. Highly expressed genes also tend towards
lower levels of sequence polymorphism and divergence in
UTRs, introns, and coding regions (Tables 2 and 3). These
results extend and support findings from previous work that
showed coding regions of highly expressed genes evolve
slowly [2,19]. However, the CPR does not follow this pattern.
In females, lowly expressed genes actually have lower levels of
polymorphism in the CPR than average or highly expressed
genes (Tables 2 and 3). Furthermore, this is the only category
that shows a relationship where CPR polymorphism is posi-
tively associated with gene expression variation. This result
may reflect the fact that, in the female analysis, there is an
excess of male-biased genes in the lowly expressed class and
male-biased genes tend to have particularly low levels of pol-
ymorphism in the CPR. Divergence in the CPR also shows a
departure from patterns detected in the other gene features.
Lowly expressed genes show lower levels of divergence in the
CPR (Tables 2 and 3). This may be driven by a difference in
the sexes discussed below.
Sex bias
Sex-specific genes are highly polymorphic and evolve rapidly
Our study reveals that both female-specific and male-specific
genes show elevated levels of polymorphism in coding regions
and 5'UTRs while female-biased and male-biased genes show
patterns more similar to unbiased genes (Table 4). Sex-spe-
cifically expressed genes also show elevated levels of diver-
gence in all gene features except the CPR (Table 4). Indeed,
the pooling of sex-specific and sex-biased genes in previous
work might have masked the difference between these very
different categories of expression.
The CPR stands out among the gene features because it shows
the lowest levels of polymorphism and divergence among
male-specific and male-biased genes in spite of the fact these
genes show among the highest levels of polymorphism and
divergence in all other gene features. It has been previously
reported that male-biased genes are overrepresented among
the class of genes that show expression variation [4] and
divergence [36]. As discussed above, we speculate that there
might be a difference between the locations of regulatory
regions of male-biased versus female-biased and unbiased
genes.
Sex-specific genes have simpler regulatory regions
Genes expressed in a sex-specific manner may have a more
narrowly defined function than genes expressed in both
sexes. Our data support this idea if the information content of
UTRs and introns is correlated with their length and/or con-
servation. As previously mentioned, sex-specific genes show
the highest levels of polymorphism and divergence in the
UTRs and introns. Additionally, sex-specific genes have sig-
nificantly shorter UTRs and significantly fewer introns than
sex-biased and unbiased genes (Table 4). In fact, female-spe-
cific genes have the shortest UTRs and introns even though
they have among the longest coding regions. The shorter
introns and UTR suggests that there is less opportunity for
information content in UTRs and introns in sex-specific
genes.
To explicitly test the hypothesis that UTRs of sex-specific
genes have fewer regulatory elements, we examined the
5'UTRs of sex-specific (SS) and unbiased genes (non-sex spe-
cific (NSS)) for evidence of translational regulatory elements.
One mechanism of translational regulation is through
upstream translation initiation codons (uAUGs) and
upstream open reading frames (uORFs). These uAUGs and
uORFs reside in the 5'UTR and can regulate translation by
causing the ribosome to stall or by blocking another ribosome
from the translation start site (see [40,41] for reviews). Based
on the probability of observing an AUG given the base compo-
sition of the 5'UTR sequence, non-conserved AUGs are
under-represented in 5'UTRs [40,41]. However, uAUGs con-
served between species are overrepresented, which suggests
that they serve some functional role.
We investigated the prevalence of conserved uAUGs and
uORFs (present in D. simulans, D. melanogaster, and D.
yakuba) in sex-specific and unbiased genes with 5'UTRs that
were at least 50 nucleotides in length. For our analyses,
uORFs are defined as having both an initiation and termina-
tion codon within the 5'UTR, whereas uAUGs are simply ini-
Genome Biology 2008, Volume 9, Issue 8, Article R125 Lawniczak et al. R125.11
Genome Biology 2008, 9:R125
tiation codons in the 5'UTR that may or may not be followed
by a termination codon. We find that sex-specific genes have
fewer uORFs per 5'UTR nucleotide (MWU: SS 0.0036 versus
NSS 0.0039, X
2
= 7.49, p = 0.0062) and a lower proportion of
genes with a uORF present (MWU: SS 0.44 versus NSS 0.51,
X
2
= 16.54, p < 0.0001). However, the pattern with uAUGs
was less clear. There were similar numbers of uAUGs (per
5'UTR nucleotide) in sex-specific and non-sex-specific genes
(MWU: SS 0.0051 versus NSS 0.0047, X
2
= 0.33, p = 0.5677),
but there was a trend towards a lower proportion of sex-spe-
cific genes harboring uAUGs (MWU: SS 0.52 versus NSS
0.55, X
2
= 3.08, p = 0.0793). Given these data, we have weak
evidence that sex-specific genes have fewer translational reg-
ulatory elements in their 5'UTRs, supporting the hypothesis
that genes with more narrowly defined functions have sim-
pler or fewer regulatory sequences.
Conclusion
Across six genotypes of D. simulans, we find that genes with
significant expression variation also tend to have higher lev-
els of sequence polymorphism, particularly in the coding
region and 3'UTR (Table 1, Figure 1). Clearly, cis-regulatory
variation plays an important role in determining transcript
levels, but these data cannot address the relative role of trans-
acting factors. Further research examining the role of the
3'UTR in Drosophila gene expression will determine whether
the positive association detected here indicates functional dif-
ferences that may be acted upon by natural selection. Addi-
tional support for the positive relationship between sequence
polymorphism and gene expression variation comes from
comparisons of the X to autosomes. Genes located on the X,
already known to have lower levels of sequence polymor-
phism than autosomal genes [42], are also less likely to show
significant expression variation than genes on autosomes.
Similar to previously published reports, we find that sex dif-
ferences in expression are abundant and male-biased genes
are overrepresented among the most variably expressed
genes [4]. However, by pooling sex-specific genes with sex-
biased genes, some information is lost. We find that female-
specific genes are a previously overlooked category showing
high levels of polymorphism and divergence for some gene
features. Additionally, these sex-specific genes may have sim-
pler mechanisms of gene regulation related to fewer or more
narrowly defined functions. This last point has important
implications for studies examining the importance of regula-
tory changes in the evolution of phenotypic differences as it
implies that patterns inferred from sexually dimorphic traits
might not be reflective of the genome as a whole.
Materials and methods
Genotypes
Gene expression and sequence data are derived from seven
genotypes of D. simulans from Kenya (c167.4), Madagascar
(md106 and md199), New Caledonia (nc48), and North
America (w
501
, sim4, and sim6). These genotypes were
recently sequenced using light shotgun whole genome
sequencing [17]. The inbred lines sim4 and sim6 are from a
single population (Winters, California). Sequence reads of
sim4 and sim6 were combined to produce a consensus
genomic sequence [17].
Sample preparation for microarray analysis
Parental flies from each genotype were reared on standard
laboratory medium at room temperature in the same facility.
Virgin flies from each of the seven genotypes were collected
and housed in single sex vials in groups of ten for three days.
On the morning of the fourth day, 3 replicates of 30 flies from
each sex and each genotype were flash frozen. Flies were
stored at -80°C until RNA extraction.
Total RNA was extracted from whole flies using Trizol reagent
(Invitrogen, Carlsbad, CA, USA). Affymetrix guidelines were
followed for cDNA synthesis, cRNA processing and biotin-
labeling, and fragmenting. We analyzed gene expression var-
iation in the seven genotypes discussed above using Affyme-
trix Dros2 D. melanogaster genechips. Oligonucleotide chips
were probed, hybridized, stained, washed and scanned at the
UC-Davis Core Facility according to Affymetrix guidelines.
Microarray probe masking
The Dros2 Affymetrix chip has approximately 18,700
probesets, each representing a known or predicted transcript.
Each probeset is composed of fourteen 25-base oligonucle-
otide probes that perfectly match (PM) the D. melanogaster
reference sequence and 14 probes that mis-match (MM) the
reference sequence at the central (13th) base of the probe. For
our purposes, all data from the MM probes were excluded;
thus, each probeset is represented by up to 14 PM probes.
Probes from the Affymetrix Dros2 genechips were developed
from within target sequences of transcribed DNA. These tar-
get sequences correspond to transcribed sequence that may
or may not be contiguous (that is, targets may span an intron,
but do not include intronic sequence). Probes for the Affyme-
trix Dros2 genechips were designed from D. melanogaster
assembly version 3 whereas our analyses are all based on
assembly version 4. In order to reconcile two assembly ver-
sions and associate probesets with genes, we downloaded tar-
get sequences from Affymetrix [43] and identified
homologous sequence in version 4 using BLAT [44]. We
removed target sequences (and therefore probesets) that hit
multiple locations within the D. melanogaster genome. We
also removed probes that hit multiple locations within target
sequences.
Using the light shotgun whole genome sequences available
for the D. simulans genotypes assayed for gene expression,
probe polymorphism within D. simulans and divergence
from D. melanogaster was corrected for in our analyses. We
followed the approach described in [45]. This and other ear-
Genome Biology 2008, Volume 9, Issue 8, Article R125 Lawniczak et al. R125.12
Genome Biology 2008, 9:R125
lier work noted that the effect of this divergence can be either
a reduction of signal or an inflation of the variance in the sig-
nal among probes [45]. The latter, which can be an issue on
Affymetrix arrays, tends to reduce the power of an analysis.
As this should make it harder to see a significant association,
our analyses should be conservative.
On average, in the syntenic assemblies there are sequence
data from 3.9 D. simulans lines covering each nucleotide. For
detection of polymorphism, we required that each nucleotide
within a probe be represented by data from at least two D.
simulans lines. Probes with lower coverage were masked, as
were all probes that were found to be polymorphic within the
six D. simulans genotypes. We also masked all probes that
showed any sequence divergence between the D. simulans
and D. melanogaster genome sequences. It is important to
note that although including divergent probes might give
inaccurate information as to true levels of gene expression,
because we are only comparing gene expression within D.
simulans, including divergent probes should not bias our
results. The real concern for masking is the polymorphic
probes within D. simulans. However, it should be noted that
this has been considered but not been corrected for in
intraspecific expression analyses in other species because it
has been demonstrated to have a minor contribution to
expression variation [3,4,8]. Regardless, it is possible that by
considering probes that were covered by only two D. simulans
lines, we missed some probes that were polymorphic within
D. simulans. Therefore, we also conducted all analyses with a
second dataset that included only probes that were covered by
at least four D. simulans lines. The results are quantitatively
identical to the analyses presented in the paper (Table S1 in
Additional data file 1). As an additional approach towards
determining whether missing sequence data could bias our
results, we also examined whether the most significant outlier
genotype in terms of gene expression was also one of the gen-
otypes that was missing sequence data in the n ≥ 4 coverage
analyses. If true - that is, if the missing genotypes for any
given gene also tend to be expression outliers for that gene -
then the missing probe sequence data could be different from
the reference probe and thus have an impact on gene expres-
sion that is unrelated to actual expression. We limited our
analysis to male data as these showed the most deviant
expression. The most differentially expressed genotype was
missing sequence data (n = 1,926) no more likely than
expected by chance (n = 1,965; χ
2
= 1.177, p = 0.2779). Nor
was there significant difference in the average intensity value
between those genes with coverage and those without (genes
with coverage, intensity = 6.882; genes without coverage,
intensity = 6.865). This analysis, however, may be con-
founded by the fact that most genes are not statistically signif-
icantly different among lines and that inclusion of these genes
in the analysis may obscure an effect. Thus, we repeated the
analysis with the 500 genes with the strongest differences in
expression among the lines. The expression outlier was miss-
ing sequence data in 161 cases, which is not significantly dif-
ferent from the random expectation of 167 (χ
2
= 0.324; p =
0.5694). Therefore, missing probe sequence data do not
appear to bias our results.
In addition to masking divergent and polymorphic probes, we
also masked probes that were called 'absent' by the Affymetrix
algorithm. We did this to ensure that only genes with reliably
detectable sequence were used in the analysis. Any probeset
not called 'present' in at least three chips was considered to be
absent (absent male = 7,817 probesets; absent female = 9,238
probesets). Masking was performed prior to background cor-
rection and normalization using code graciously sent by Ariel
Chernomoritz. This was done for each sex separately as some
genes are considered absent in one sex but present in the
other.
Microarray background correction, normalization, and
analysis
After masking, data were processed and normalized using the
rma package in Bioconductor [46]. Expression variation was
assessed separately for each sex using mixed model ANOVAs
in R with genotype as a fixed effect and replicate (RNA prep)
as a random effect. The total number of genes analyzed after
the removal of polymorphic and diverged probes and absent
probesets was 7,949 for males and 7,128 for females.
Estimates of nucleotide polymorphism and divergence
D. simulans and D. yakuba were syntenically aligned to v4 of
the D. melanogaster genome assembly [17]. Genes in D.
simulans and D. yakuba were assessed for initiation codons,
splice junctions, and termination codons that matched the D.
melanogaster gene model (annotation v4.2). Estimates of
polymorphism, π, and divergence were taken from Begun et
al. [17]. Briefly, the six D. simulans lines were used to esti-
mate levels of nucleotide variation. In coding regions, π was
calculated according to Nei and Gojobori [47] to count the
number of nonsynonymous and synonymous sites and to
determine the number of nonsynonymous and synonymous
changes between two codons. Male flies are hemizygous for
the X chromosome. Assuming there are equal numbers of
males and females in a population, differences in population
size between the X and autosomes were corrected for by mul-
tiplying polymorphism estimates on the X by 4/3. Lineage-
specific divergence in D. simulans was estimated using D.
melanogaster and D. yakuba reference sequences. In coding
regions, divergence was calculated using codeml with codon
frequencies estimated from the data and dN and dS estimated
for each branch [48]. For noncoding regions, baseml [48]
with HKY as the model of evolution was used to account for
base frequency and transition/transversion bias [49].
Polymorphism data were summarized for the following gene
features on a gene-by-gene basis. Three hundred bases just
upstream of the transcription initiation site were examined
because this region typically contains the core promoter
(CPR). Predicted and gold collection (that is, those with a fully
Genome Biology 2008, Volume 9, Issue 8, Article R125 Lawniczak et al. R125.13
Genome Biology 2008, 9:R125
sequenced cDNA; retrieved from [50]) 5' and 3'UTRs were
examined. We include analyses using the pooled set of pre-
dicted and gold UTRs because analyses using the more con-
servative gold UTR datasets did not differ from the pooled
datasets. Both synonymous and nonsynonymous sites were
examined for the coding regions of each gene. Additionally,
because regulatory elements are often found in first introns,
levels of polymorphism in the first intron and the combined
data for all introns were examined separately. Divergence
along the D. simulans lineage was also calculated for each of
these features.
Association of gene expression variation with
population genomic data
The p-values resulting from the gene-by-gene ANOVAs were
used to represent gene expression variability across geno-
types, with low p-values indicating high levels of expression
variation. Summary sequence data on polymorphism and
divergence for each gene feature were combined with the
ANOVA p-values. For each feature, genes were sorted by p-
value and put into 15 equal sized bins with n genes in each bin.
The average and standard error of π were calculated for each
bin. For permutation tests, n π values were drawn from the
total dataset and the average π was calculated. This was
repeated 10,000 times to generate an empirical distribution
of average π. The number of permuted datasets with average
π values that were higher than the sample dataset (that is,
each bin) was divided by the total number of permuted data-
sets to obtain p-values. This process was similar for investiga-
tion of the relationship between sequence divergence and
expression variation.
In addition to discovering genes that vary in expression by
genotype, we also categorized genes based on gene feature
length and levels of expression intensity. Expression intensity
was determined based on overall average expression for a
gene on the chip. In males, the average gene expression inten-
sity was 6.87 and in females it was 7.45. High, average, and
low gene expression was determined by making cutoffs
(males: low is less than 5.37, high is greater than 8.37;
females: low is less than 5.95, high is greater than 8.95).
These cut-offs are arbitrary and chosen because they resulted
in about half of the genes falling into 'average' gene expres-
sion and the remainder of the genes falling roughly equally
into 'high' and 'low' expression categories.
Classes of sex bias were determined by using both presence/
absence calls and relative levels of gene expression. Genes
were considered male-specific if they were called 'absent' in
all female chips, but 'present' in at least three male chips.
Female-specific genes were determined the same way. 'Strict'
sex-specific genes were required to be present in all chips of
one sex and absent in all chips of the other sex. Genes were
considered male-biased if they were at least three-fold higher
in males than females. Female-biased genes were determined
the same way, and unbiased genes include all genes with less
than three-fold variation in expression intensity between
males and females.
Abbreviations
CPR, core promoter region; miRNA, microRNA; MM, mis-
match; MWU, Mann-Whitney U test; NSS, non-sex specific;
PM, perfect match; SS, sex-specific; uAUGs, upstream trans-
lation initiation codons; uORFs, upstream open reading
frames; UTR, untranslated region.
Authors' contributions
ML helped design the experiments, collected and analyzed
data, and wrote the paper. AH analyzed data and wrote the
paper. DB helped design experiments and edited the paper.
CJ helped design experiments, analyzed data and edited the
paper.
Additional data files
The following additional data are available. Additional data
file 1 contains Table S1, which shows that the results pre-
sented in Table 1 and Figure 1 are robust to increasing the
minimum coverage to four sequences per probe. Additional
data file 2 contains Table S2, which shows the details of the
statistical results summarized in Table 4. Additional data file
3 contains Figure S1, which shows the relationship between
expression variation and divergence for the gene features dis-
cussed in this manuscript.
Additional data file 1Table S1The results presented in Table 1 and Figure 1 are robust to increas-ing the minimum coverage to four sequences per probe.Click here for fileAdditional data file 2Table S2Details of the statistical results summarized in Table 4.Click here for fileAdditional data file 3Figure S1The relationship between expression variation and divergence for the gene features discussed in this manuscript.Click here for file
Acknowledgements
We thank Ariel Chernomoretz for providing the R scripts used to mask
probes and much help adapting them for our purposes, and Eric Blanc,
Gene Schuster, and Bregje Wertheim for their valuable help with R and Bio-
conductor packages. We also thank Pawel Michalak and two anonymous
reviewers for thoughtful comments and criticisms. This work was funded
by an NSF Postdoctoral Fellowship in Biological Informatics to AKH, NIH
Grant R01-GM071926 to DJB, and funds from the Carolina Center for
Genome Sciences and the NSF to CDJ.
References
1. Good JM, Hayden CA, Wheeler TJ: Adaptive protein evolution
and regulatory divergence in Drosophila. Mol Biol Evol 2006,
23:1101-1103.
2. Lemos B, Bettencourt BR, Meiklejohn CD, Hartl DL: Evolution of
proteins and gene expression levels are coupled in Dro-
sophila and are independently associated with mRNA abun-
dance, protein length, and number of protein-protein
interactions. Mol Biol Evol 2005, 22:1345-1354.
3. Nuzhdin SV, Wayne ML, Harmon KL, McIntyre LM: Common pat-
tern of evolution of gene expression level and protein
sequence in Drosophila. Mol Biol Evol 2004, 21:1308-1317.
4. Meiklejohn CD, Parsch J, Ranz JM, Hartl DL: Rapid evolution of
male-biased gene expression in Drosophila. Proc Natl Acad Sci
USA 2003, 100:9894-9899.
5. Ranz JM, Castillo-Davis CI, Meiklejohn CD, Hartl DL: Sex-depend-
ent gene expression and evolution of the Drosophila tran-
scriptome. Science 2003, 300:1742-1745.
6. Holloway AK, Lawniczak MK, Mezey JG, Begun DJ, Jones CD: Adap-
tive gene expression divergence inferred from population
genomics. PLoS Genet 2007, 3:2007-2013.
Genome Biology 2008, Volume 9, Issue 8, Article R125 Lawniczak et al. R125.14
Genome Biology 2008, 9:R125
7. Wittkopp PJ, Haerum BK, Clark AG: Regulatory changes under-
lying expression differences within and between Drosophila
species. Nat Genet 2008, 40:346-350.
8. Kliebenstein DJ, West MA, van Leeuwen H, Kim K, Doerge RW,
Michelmore RW, St Clair DA: Genomic survey of gene expres-
sion diversity in Arabidopsis thaliana. Genetics 2006,
172:1179-1189.
9. Cowles CR, Hirschhorn JN, Altshuler D, Lander ES: Detection of
regulatory variation in mouse genes. Nat Genet 2002,
32:432-437.
10. Rockman MV, Wray GA: Abundant raw material for cis-regula-
tory evolution in humans. Mol Biol Evol 2002, 19:1991-2004.
11. Wittkopp PJ, Haerum BK, Clark AG: Evolutionary changes in cis
and trans gene regulation. Nature 2004, 430:85-88.
12. McGregor AP, Orgogozo V, Delon I, Zanet J, Srinivasan DG, Payre F,
Stern DL: Morphological evolution through multiple cis-regu-
latory mutations at a single gene. Nature 2007, 448:587-590.
13. Ranz JM, Machado CA: Uncovering evolutionary patterns of
gene expression using microarrays. Trends Ecol Evol 2006,
21:29-37.
14. Rockman MV, Kruglyak L: Genetics of global gene expression.
Nat Rev Genet 2006, 7:862-872.
15. Doss S, Schadt EE, Drake TA, Lusis AJ: Cis-acting expression
quantitative trait loci in mice. Genome Res 2005, 15:681-691.
16. Ronald J, Brem RB, Whittle J, Kruglyak L: Local regulatory varia-
tion in Saccharomyces cerevisiae. PLoS Genet 2005, 1:e25.
17. Begun DJ, Holloway AK, Stevens K, Hillier LW, Poh YP, Hahn MW,
Nista PM, Jones CD, Kern AD, Dewey CN, Pachter L, Myers E, Lan-
gley CH: Population genomics: whole-genome analysis of pol-
ymorphism and divergence in Drosophila simulans. PLoS Biol
2007, 5:e310.
18. Ellegren H, Parsch J: The evolution of sex-biased genes and sex-
biased gene expression. Nat Rev Genet 2007, 8:689-698.
19. Drummond DA, Bloom JD, Adami C, Wilke CO, Arnold FH: Why
highly expressed proteins evolve slowly. Proc Natl Acad Sci USA
2005, 102:14338-14343.
20. Choi JK, Kim SC, Seo J, Kim S, Bhak J: Impact of transcriptional
properties on essentiality and evolutionary rate. Genetics
2007, 175:199-206.
21. Larracuente AM, Sackton TB, Greenberg AJ, Wong A, Singh ND,
Sturgill D, Zhang Y, Oliver B, Clark AG: Evolution of protein-cod-
ing genes in Drosophila. Trends Genet 2008, 24:114-123.
22. Valencia-Sanchez MA, Liu JD, Hannon GJ, Parker R: Control of
translation and mRNA degradation by miRNAs and siRNAs.
Genes Dev 2006, 20:515-524.
23. Georges M, Coppieters W, Charlier C: Polymorphic miRNA-
mediated gene regulation: contribution to phenotypic varia-
tion and disease. Curr Opin Genet Dev 2007, 17:166-176.
24. Cui Q, Yu Z, Purisima EO, Wang E: MicroRNA regulation and
interspecific variation of gene expression. Trends Genet 2007,
23:372-375.
25. Stark A, Brennecke J, Bushati N, Russell RB, Cohen SM: Animal
microRNAs confer robustness to gene expression and have
a significant impact on 3'UTR evolution. Cell 2005,
123:1133-1146.
26. Ruby JG, Stark A, Johnston WK, Kellis M, Bartel DP, Lai EC: Evolu-
tion, biogenesis, expression, and target predictions of a sub-
stantially expanded set of Drosophila microRNAs. Genome Res
2007, 17:1850-1864.
27. TargetScanFly [ />28. Pesole G, Mignone F, Gissi C, Grillo G, Licciulli F, Liuni S: Structural
and functional features of eukaryotic mRNA untranslated
regions. Gene 2001, 276:73-81.
29. Wilkie GS, Dickson KS, Gray NK: Regulation of mRNA transla-
tion by 5'- and 3'-UTR-binding factors. Trends Biochem Sci 2003,
28:182-188.
30. de Moor CH, Meijer H, Lissenden S: Mechanisms of translational
control by the 3' UTR in development and differentiation.
Semin Cell Dev Biol 2005, 16:49-58.
31. Brown RP, Feder ME: Reverse transcriptional profiling: non-
correspondence of transcript level variation and proximal
promoter polymorphism. BMC Genomics 2005, 6:110.
32. Tirosh I, Weinberger A, Carmi M, Barkai N: A genetic signature of
interspecies variations in gene expression. Nat Genet 2006,
38:830-834.
33. Blake WJ, Balázsi G, Kohanski MA, Isaacs FJ, Murphy KF, Kuang Y,
Cantor CR, Walt DR, Collins JJ: Phenotypic consequences of
promoter-mediated transcriptional noise. Mol Cell 2006,
24:853-865.
34. Walther D, Brunnemann R, Selbig J: The regulatory code for tran-
scriptional response diversity and its relation to genome
structural properties in A. thaliana. PLoS Genet 2007, 3:e11.
35. Landry CR, Lemos B, Rifkin SA, Dickinson WJ, Hartl DL: Genetic
properties influencing the evolvability of gene expression.
Science 2007, 317:118-121.
36. Zhang Y, Sturgill D, Parisi M, Kumar S, Oliver B: Constraint and
turnover in sex-biased gene expression in the genus Dro-
sophila. Nature 2007, 450:233-237.
37. Parisi M, Nuttall R, Naiman D, Bouffard G, Malley J, Andrews J, East-
man S, Oliver B: Paucity of genes on the Drosophila X chromo-
some showing male-biased expression. Science 2003,
299:697-700.
38. Sturgill D, Zhang Y, Parisi M, Oliver B: Demasculinization of X
chromosomes in the Drosophila
genus. Nature 2007,
450:238-241.
39. Legube G, McWeeney SK, Lercher MJ, Akhtar A: X-chromosome-
wide profiling of MSL-1 distribution and dosage compensa-
tion in Drosophila. Genes Dev 2006, 20:871-883.
40. Morris DR, Geballe AP: Upstream open reading frames as reg-
ulators of mRNA translation. Mol Cell Biol 2000, 20:8635-8642.
41. Meijer HA, Thomas AA: Control of eukaryotic protein synthesis
by upstream open reading frames in the 5'-untranslated
region of an mRNA. Biochem J 2002, 367:1-11.
42. Begun DJ, Whitley P: Reduced X-linked nucleotide polymor-
phism in Drosophila simulans. Proc Natl Acad Sci USA 2000,
97:5960-5965.
43. Affymetrix []
44. Kent WJ: BLAT—the BLAST-like alignment tool. Genome Res
2002, 12:656-664.
45. Mezey JG, Nuzhdin SV, Ye F, Jones CD: Coordinated evolution of
co-expressed gene clusters in the Drosophila transcriptome.
BMC Evol Biol 2008, 8:2.
46. BioConductor []
47. Nei M, Gojobori T: Simple methods for estimating the num-
bers of synonymous and nonsynonymous nucleotide substi-
tutions. Mol Biol Evol 1986, 3:418-426.
48. Yang Z: PAML: a program package for phylogenetic analysis
by maximum likelihood. Comput Appl Biosci 1997, 13:555-556.
49. Hasegawa M, Kishino H, Yano T: Dating of the human-ape split-
ting by a molecular clock of mitochondrial DNA. J Mol Evol
1985, 22:160-174.
50. Drosophila Gold Collection [ />gold_collection.shtml]