Managerial economics theory and practice phần 6 pptx
Bạn đang xem bản rút gọn của tài liệu. Xem và tải ngay bản đầy đủ của tài liệu tại đây (955.81 KB, 75 trang )
price of their product. Since these firms exhibit characteristics of both
perfect competition and monopoly, this market structure is referred to as
monopolistic competition.
The market power of monopolistically competitive firms, such as fast-
food restaurants, is derived from product differentiation and market seg-
mentation. Through subtle and not-so-subtle distinctions, each firm in a
monopolistically competitive industry is a sort of minimonopolist. But,
unlike monopolists, these firms are severely constrained in their ability to
set the market price for their product by the existence of many close sub-
stitutes. Thus, the demand for the output of monopolistically competitive
firms is much more price elastic (flatter) than the demand curve confronting
the monopolist. A firm in a perfectly competitive industry faces a perfectly
elastic (horizontal) demand curve because its output is a perfect substitute
for the output of other firms in the industry. Unlike monopolies and monop-
olistically competitive firms, which may be described as price makers, per-
fectly competitive firms are price takers.
CHARACTERISTICS OF MONOPOLISTIC
COMPETITION
Monopolistic competition has characteristics in common with both
perfect competition and monopoly. The most salient features of monopo-
listically competitive markets are as follows.
NUMBER AND SIZE DISTRIBUTION OF SELLERS
As in perfect competition, a monopolistically competitive industry
is assumed to have a large number of firms, each producing a relatively
small percentage of total industry output. As in perfect competition, the
actions of any individual firm are unlikely to influence the actions of its
competitors.
NUMBER AND SIZE DISTRIBUTION OF BUYERS
Also as in perfect competition, monopolistic competition assumes that
there are a large number of buyers for its output and that resources are
easily transferred between alternative uses.
PRODUCT DIFFERENTIATION
Unlike perfect competition, while each firm in a monopolistically com-
petitive industry produces essentially the same type of product, each firm
produces a product that is considered by consumers to be somewhat dif-
362 Market Structure: Monopolistic Competition
ferent from those of its competitors.The products of each firm in the indus-
try are close, albeit not perfect, substitutes. Monopolistic competition is fre-
quently encountered in the retail and service industries. Examples of
product differentiation are most frequently encountered in the same indus-
tries and include such products as clothing, soft drinks, beer, cosmetics, gaso-
line stations, and restaurants.
Product differences may be real or imagined. For example, regular (87
octane) gasoline has a precise chemical composition. Many consumers,
however, believe brand-name gasoline stations, such as Exxon and Mobile,
sell better gasoline than little-known vendors. Firms often reinforce these
perceived differences by introducing real or cosmetic additives into their
product. Monopolistically competitive firms commit substantial sums in
advertising expenditures to reinforce real and perceived product differ-
ences. These efforts are intended not only to attract new buyers but also to
create brand-name recognition and solidify customer loyalty. By segment-
ing the market in this manner, these producers are able to charge higher
prices. Within each segment of the market, the individual firm is a monop-
olist that is able to exercise market power.
CONDITIONS OF ENTRY AND EXIT
Finally, as in perfect competition, it is relatively easy for new firms to
enter the industry, or for existing firms to leave it.
Definition: Monopolistic competition is a market structure that is char-
acterized by buyers and sellers of a differentiated good or service and in
which it is relatively easy to enter the industry or to leave it.
SHORT-RUN MONOPOLISTICALLY
COMPETITIVE EQUILIBRIUM
Clearly, then, the one condition that differentiates the perfectly compet-
itive firm from the monopolistically competitive firm is that the latter faces
a downward-sloping demand curve for its product, which implies that, like
a monopolist, the firm has some control over the selling price of its product.
This market power stems from consumers’ belief that each firm in the indus-
try produces a somewhat different product, with different qualities and dif-
ferent customer appeal.
The typical firm’s ability to affect the selling price of its product implies
that the firm is able, within bounds, to raise the price of its product without
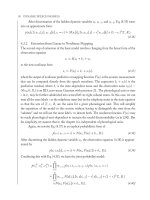
completely losing its customer base.This situation is illustrated in Figure 9.1,
which assumes the usual U-shaped marginal and average total cost curves.
In Figure 9.1, we observe that a typical monopolistically competitive firm
maximizes its short-run profit by producing at the level of output at which
Short-Run Monopolistically Competitive Equilibrium 363
marginal cost equals marginal revenue. This occurs at the output level Q*.
At this output level, the firm charges a price of P*, which is determined
along the demand (average revenue) curve. The firm’s total revenue is illus-
trated by the area of the rectangle 0P*BQ*. The firm’s total cost at output
level Q* is illustrated by the area of the rectangle 0ADQ*. Since total profit
is defined as the difference between total revenue and total cost, the firm’s
profit at output level Q* is illustrated by the area of the rectangle AP*BD.
Of course, in the short run the monopolistically competitive firm might
just as easily have generated an economic loss.This is illustrated by the area
of the rectangle P*ADB in Figure 9.2. Note, again, that profit is maximized
at Q*, where marginal cost equals marginal revenue.
LONG-RUN MONOPOLISTICALLY
COMPETITIVE EQUILIBRIUM
Each firm in a monopolistically competitive industry produces a some-
what different version of the same product. The objective of product dif-
ferentiation is market segmentation. By producing a product that is
perceived to be different from those produced by every other firm in the
364 Market Structure: Monopolistic Competition
FIGURE 9.1 Short-run monopolisti-
cally competitive equilibrium and positive
economic (above-normal) profit.
FIGURE 9.2 Short-run monopolistically
competitive equilibrium and negative eco-
nomic (below-normal) profit.
industry, firms in monopolistically competitive markets are able to carve
out their own market niche. In doing so, each firm faces a downward-sloping
demand curve for its product. Within a relatively narrow range of prices,
each firm exercises a degree of market power by exploiting brand-name
identification and customer loyalty.
There is, however, a limit to the ability of firms in a monopolistically com-
petitive industry to exercise market power by exploiting customer loyalty.
Since all firms produce fundamentally the same type of product, the
demand for each firm’s product is more price elastic because of the exis-
tence of many close substitutes. By contrast, there are not close substitutes
for the output of a monopolist. Moreover, as more firms enter the market,
the number of close substitutes increases, which not only reduces each firm’s
market share but also increases the price elasticity of demand for each
firm’s product.
The short-run analysis of the profit-maximizing, monopolistically com-
petitive firm is similar to that of the monopolist, but that is where the sim-
ilarity ends. Relatively easy entry into and exit from the industry guarantees
that in the long run monopolistically competitive firms will earn zero eco-
nomic profit. To see this, consider, again, the short-run monopolistically
competitive equilibrium condition in Figure 9.1.
The opportunity to obtain positive economic profits attracts new firms
into the industry. Each firm offers for sale in the market a product that is
somewhat different from those of its competitors, which results in increased
market segmentation. As a result, the demand curve firm not only shifts to
the left (because each firm has a smaller market share), but also becomes
more price elastic (because of an increase in the number of close substi-
tutes). Conversely, as firms exit the industry in the face of economic losses,
the market share of each firm increases and the demand curve shifts to the
right and becomes less price elastic (because fewer substitutes are available
to the consumer).As in the case of perfect competition, this process will con-
tinue until each firm earns zero economic (normal) profit. This final, long-
run monopolistically competitive equilibrium, is illustrated in Figure 9.3.
In the long run, the demand curve of the monopolistically competitive
firm is tangent to the average total cost curve at the profit-maximizing
output level Q*. At this output level, total revenue (P* ¥ Q*) is just equal
to total economic cost (ATC* ¥ Q*). This result is similar to the long-run
equilibrium solution for the perfectly competitive industry, where P* =
ATC* at the profit-maximizing output level. Unlike the perfectly competi-
tive firm, where P* = MR, profit-maximizing, monopolistically competitive
firms produce at an output level at which P* > MR, which is the same as
that for monopolies.
The long-run competitive equilibrium for a monopolistically competitive
industry can also be demonstrated as follows. By definition, total profit is
defined as
Long-Run Monopolistically Competitive Equilibrium 365
Average profit is defined as
Since p=0, then Ap=0, then
This result is identical to the situation that arises in long-run perfectly com-
petitive equilibrium.
The long-run monopolistically competitive equilibrium output level is to
the left of the minimum point on its average total cost curve. Price equals
average total cost, as in the case of long-run perfectly competitive equilib-
rium; however, price does not equal marginal revenue or marginal cost.
Thus, output is lower and the price is higher than would be the case in a
perfectly competitive industry.This result is similar to that found in the case
of monopoly.
Problem 9.1. A typical firm in a monopolistically competitive industry
faces the following demand and total cost equations for its product.
a. What is the firm’s short-run, profit-maximizing price and output level?
b. What is the firm’s economic profit?
c. Suppose that the existence of economic profit attracts new firms into the
industry such that the new demand curve facing the typical firm in this
TC Q Q=-+100 5
2
Q
P
=-20
3
P ATC**=
A
Q
TR
Q
TC
Q
AR ATC
PQ
Q
ATC
p
p
==-=-
=-
***
*
**
*
*
p= - = -TR TC P Q TC**
366 Market Structure: Monopolistic Competition
B
C
P*
$
0 Q* Q
MC
ATC
D=AR
MR
FIGURE 9.3 Long-run monopolis-
tically competitive equilibrium and zero
economic (normal) profit.
industry is Q = 35/3 - P/3. Assuming no change in the firm’s total cost
function, find the new profit-maximizing price and output level.
d. Is the firm earning an economic profit?
e. What, if anything, can you say about the relationship between the firm’s
demand and average cost curves? Is this result consistent with your
answer to part c?
Solution
a. To maximize profit, the monopolistically competitive firm produces at
the output level at which marginal cost equals marginal revenue. Price
is determined along the demand curve. Solving the demand equation for
price yields
Substituting this result into the definition of total revenue yields
Substituting this into the definition of total profit yields
Taking the first derivative of this expression with respect to Q and setting
the resulting equation equal to zero yields
The profit-maximizing output level is
Substituting this result into the demand equation results in
b. The firm’s economic profit is
These results are illustrated in the Figure 9.4.
c. The firm’s new profit equation is
Taking the first derivative of this expression and setting the results equal
to zero yields
d
dQ
Q
Q
p
=- =
=
40 8 0
5*
p=- + -100 40 4
2
p=- +
()
-
()
=100 65 8 125 4 8 125 164 0625
2
$.
P* =-
()
=60 3 8 125 35 625
Q*.= 8 125
d
dQ
Q
p
=- =65 8 0
p= - = - - + - =- + -TR TC Q Q Q Q Q Q600 3 100 5 100 65 4
22
2
TR PQ Q Q Q Q==-
()
=-60 3 60 3
2
PQ=-60 3
Long-Run Monopolistically Competitive Equilibrium 367
Substituting this result into the demand equation yields
d. The firm’s economic profit is
This result is consistent with the profit-maximizing condition that mar-
ginal revenue must equal marginal cost, that is,
e. The firm’s average total cost equation is
The slope of this function is
In long-run monopolistically competitive equilibrium, the slope of
the ATC curve and the slope of the demand function are the same,
therefore
Moreover, at Q* = 5, ATC = 20 = P*. These results are consistent with
the results in part c and are illustrated in Figure 9.5.
Problem 9.2. The demand equation for a product sold by a monopolisti-
cally competitive firm is
-
+=-
=
100
13
5
2
Q
Q*
dATC
dQ
Q
=
-
+
100
1
2
ATC
TC
Q==-+
100
5
MR MC
Q
=
-=-+
=
35 6 5 2
5*
p=- +
()
-
()
=-+-=100 40 5 4 5 100 200 100 0
2
P* =-
()
=35 3 35 20
368 Market Structure: Monopolistic Competition
FIGURE 9.4 Diagrammatic solution
to problem 9.1 part b.
The total cost equation of the firm is
a. Calculate the equilibrium price and quantity.
b. Is this firm in long-run or short-run equilibrium at the equilibrium price
and quantity?
c. Diagram your answers to parts a and b.
Solution
a. The profit-maximizing condition is
The total revenue equation is
Solving the demand equation for P yields
Substituting this result into the total revenue equation yields
The monopolist’s marginal revenue equation is
The monopolist’s marginal cost is
MC
dTC
dQ
Q==+505.
MR
dTR
dQ
Q==-50 4
TR Q Q Q Q=-
()
=-50 2 50 2
2
PQ=-50 2
TR PQ=
MR MC=
TC Q Q=++225 5 0 25
2
.
QP
D
=-25 0 5.
Long-Run Monopolistically Competitive Equilibrium 369
B
C
20
$
05Q
MC
ATC
Q=35/3–P/3
MR
35
FIGURE 9.5 Diagrammatic
solution to problem 9.1 part e.
Substituting these results into the profit-maximizing condition yields the
profit-maximizing output level:
To determine the profit-maximizing (equilibrium) price, substitute this
result into the demand equation:
b. Long-run competitive equilibrium is defined as the condition under
which p=0. In the short run, pπ0. The profit for the monopolistically
competitive firm at P* = $30 and Q* = 10 is
We can conclude from this result that the monopolistically competitive
firm is in long-run competitive equilibrium.
c. Figure 9.6 shows the answers to parts a and b.
Problem 9.3. The market equation for a product sold by a monopolisti-
cally competitive firm is
The total cost equation of the firm is
a. Calculate the equilibrium price and quantity.
b. Is this firm in long-run or short-run equilibrium at the equilibrium price
and quantity?
Solution
a. The profit-maximizing condition is
TC Q Q=+ +500 10 0 5
2
.
QP
D
=-100 4
p= - = - + +
()
=
()
-+
()
+
()
[]
=-=
TR TC P Q Q Q** * . *
.$
225 5 0 25
30 10 225 5 10 0 25 10 300 300 0
2
2
P*$=-
()
=50 2 10 30
Q* = 10
50 4 5 0 5-=+QQ.
370 Market Structure: Monopolistic Competition
FIGURE 9.6 Diagrammatic solution to
problem 9.2.
The total revenue equation is
Solving the demand equation for P yields
Substituting this result into the total revenue equation yields
The monopolist’s marginal revenue equation is
The monopolist’s marginal cost is
Substituting these results into the profit-maximizing condition yields the
profit-maximizing output level:
To determine the profit-maximizing (equilibrium) price, substitute this
result into the demand equation:
b. Long-run competitive equilibrium is defined as the condition under
which p=0. In the short run, pπ0. The profit for the monopolistically
competitive firm at P* = $40 and Q* = 20 is
Since p<0, we can conclude from this result that the firm is in short-run
monopolistically-competitive equilibrium.
ADVERTISING IN MONOPOLISTICALLY
COMPETITIVE INDUSTRIES
The importance of advertising in monopolistic industries is readily
apparent. Advertising highlights real or perceived product differences
between and among products of firms in the industry. Advertising creates
p= - = - + +
[]
=
()
-+
()
+
()
[]
=-
TR TC P Q Q Q** * . *
$
500 10 0 5
22 5 10 500 10 10 0 5 10 425
2
2
P*. $.=-
()
=25 02510 225
25 0 5 10
10
-=+
=
.
*
Q
MC
dTC
dQ
Q==+10
MR
dTR
dQ
Q==-25 0 5.
TR Q Q Q Q=-
()
=-25 0 25 25 0 25
2
PQ=-25 0 25.
TR PQ=
MR MC=
Advertising in Monopolistically Competitive Industries 371
and reinforces customer loyalty, which gives the firm limited market power.
The effect of successful advertising by firms in monopolistically competi-
tive firms is illustrated in Figure 9.7.
In Figure 9.7 the demand curve for the firm’s product shifts from D
0
to
D
1
as a result of the firm’s advertising expenditures. The costs of advertis-
ing are illustrated by the shifts in the marginal and average total cost curves
from MC
0
to MC
1
and ATC
0
to ATC
1
, respectively. These changes result in
an increased unit sales and prices. In the situation depicted the Figure 9.7,
the firm is clearly better off as a result of its presumably successful adver-
tising campaign. This is seen by the increase in profits from p
0
to p
1
.
How much advertising is optimal? In principle, the optimal level of
advertising expenditure maximizes the firm’s profits from having spent that
money. As a general rule, the firm will maximize its profits from advertis-
ing by producing at an output level at which marginal production cost
(including incremental advertising expenditures) equals marginal revenue.
EVALUATING MONOPOLISTIC COMPETITION
Many of the same criticisms of monopolistic market structures compared
with perfect competition are applicable when one is evaluating monopolis-
tic competition. As with monopoly, perfect competition may be considered
to be a superior market structure because it results in greater output and
lower prices than are obtained with monopolistic competition. This is
because as with a monopolist, the demand curve confronting the monopo-
listically competitive firm is downward sloping. On the other hand, the
demand curve confronting the monopolistically competitive firm is gener-
ally more elastic than that confronting the monopolist because of the exis-
tence of many close substitutes. Thus, the disparity between perfectly
competitive and monopolistically competitive prices and output levels will
372 Market Structure: Monopolistic Competition
FIGURE 9.7 Successful advertising by a
monopolistically competitive firm.
generally be less than what is found for the pricing and output decisions of
the monopolist.
Another criticism of monopolistic competition in comparison to perfect
competition is that production in the long run does not occur at minimum
per-unit cost. Thus, monopolistically competitive firms are inherently less
efficient than firms in perfectly competitive industries. On the other hand,
as with perfect competition, relatively easy entry into and exit from the
industry ensures that in the long-run monopolistically competitive firms
earn zero economic profits. Moreover, unlike monopolies, entry and exit are
relatively easy, which encourage product innovation and development.
Can we say anything good about monopolistic competition? Indeed, we
can. Although production is less efficient, the consumer is rewarded with
the greater product variety. In fact, it might be argued that the cost to the
consumer of increased product variety is somewhat higher per-unit cost of
production. This, of course, differs significantly from monopolies from
which, in the long run, the consumer receives nothing in return for sluggish
product innovation, production inefficiency, and higher per-unit costs.
At a more general level, the model of monopolistic competition has been
the subject of numerous criticisms since it was first proposed by Chamber-
lin and Robinson in the early 1930s. To begin with, the existence of monop-
olistically competitive industries has been difficult to identify empirically.
Product differentiation in industries comprising a large number of firms has
been found to be minimal, which implies that the demand curves facing
individual firms in the industry are approximately perfectly elastic (hori-
zontal). Thus, the model of perfect competition has been found to provide
a reasonably accurate approximation of the behavior of firms in monopo-
listically competitive industries.
It has also been found that industries characterized by products with
strong brand-name recognition typically consist of a few large firms that
dominate total industry output. As we will see in Chapter 10, these indus-
tries are best classified as oligopolistic. Finally, as with perfect competition,
monopolistic competition assumes that the pricing and output decisions of
one firm in the industry are unrelated to the pricing and output decisions
of its competitors. This assumption has been found to be unrealistic, since
a change in product price by one firm, say a local gasoline station, will
prompt price changes by neighboring firms. Interdependency of pricing and
output decisions of firms is characteristic of oligopolistic market structures.
CHAPTER REVIEW
Monopolistic competition is an example of an imperfect competition.
Firms in such industries exercise a degree of market power, albeit less than
that exercised by a monopoly. As in the cases of perfect competition and
Chapter Review 373
monopoly, profit-maximizing monopolistically competitive and oligopolis-
tic firms will produce at an output level at which MR = MC.
The characteristics of a monopolistically competitive industry are a large
number of sellers acting independently, differentiated products, partial (and
limited) control over product price, and relatively easy entry into and exit
from the industry.
Product differentiation refers to real or perceived differences in goods or
services produced by different firms in the same industry. Product differ-
entiation permits market segmentation, which enables individual firms to
set their own prices within limits. As in the case of a monopoly, each firm
in a monopolistically competitive industry faces a downward-sloping
demand curve, which implies that P > MR.
The short-run profit-maximizing condition for a monopolistically com-
petitive firm is P > MR = MC. As in the case of perfect competition, the
firm earns economic profit when P > ATC, which will attract new firms into
the industry. As new firms enter the industry, existing firms lose market
share. This is illustrated graphically by a shift to the left of each firm’s
demand curve. If P < ATC, the firm earns an economic loss, which will cause
firms to exit the industry, resulting in an increase in market share and a shift
to the right of the demand curve.
In the long run, the firm earns no economic profit because P = ATC.The
demand curve for the firm’s product is just tangent to the firm’s average
total cost curve. The long-run competitive equilibrium in monopolistically
competitive industries is P = ATC > MR = MC. As in the case of monop-
oly, since MC < ATC, per-unit cost is not minimized; that is, monopolisti-
cally competitive firms produce inefficiently in the long run.
Advertising is an important element of monopolistic competition
because it reinforces customer loyalty by highlighting real or perceived
product differences between and among products of firms in the industry.
The optimal level of advertising expenditures maximizes the firm’s profits;
profit maximization occurs when the firm is produced at an output level at
which marginal cost (which includes incremental advertising expenditures)
equals marginal revenue.
When compared with the model of perfect competition, in many respects
monopolistic competition is considered to be an inferior market structure.
As in the case of monopoly, the demand curve confronting a monopolisti-
cally competitive firm is downward sloping.Thus, monopolistic competition
results in lower output levels and higher prices than are characteristic of
perfect competition. Moreover, monopolistically competitive firms do not
produce at minimum per-unit cost. On the other hand, although production
is not as efficient as in perfect competition, the consumer is rewarded with
the greater product variety. As in the case of perfect competition, relatively
easy entry and exit encourage product innovation and development. In the
long run, monopolistically competitive firms earn only a normal rate of
return.
374 Market Structure: Monopolistic Competition
The model of monopolistic competition itself has been subjected to
numerous criticisms.First,it has been empirically difficult to identify monop-
olistically competitive industries. Product differentiation in industries com-
prising a large number of firms has been found to be minimal. Industries
characterized by strong brand-name recognition typically consist of a few
large firms. Such industries are best described as oligopolistic. Finally, the
assumption that the pricing and output decisions of one firm are unrelated
to the pricing and output decisions of its competitors is unrealistic.
KEY TERMS AND CONCEPTS
Monopolistic competition The market structure in which there are many
buyers and sellers of a differentiated good or service and it is relatively
easy to enter and leave the industry.
P > MR = MC The selling price is greater than marginal revenue, which
is equal to marginal cost, is the first-order profit-maximizing condition
for a firm facing a downward-sloping demand curve for its good or
service.
Product differentiation Exists when goods or services that are in fact
somewhat different, or are so perceived by the consumer, nonetheless
perform the same basic function.
CHAPTER QUESTIONS
9.1 Describe the similarities and differences between perfectly compet-
itive and monopolistically competitive market structures.
9.2 In monopolistically competitive industries it is not important for
each firm to supply products that are, in fact, different from those of com-
petitors. It is important only that the public think that the products are dif-
ferent. Do you agree? Explain.
9.3 Monopolistically competitive firms are similar to monopolies in that
they are able to earn economic profits in the long run. Do you agree with
this statement? If not, then why not?
9.4 Monopolistically competitive firms are similar to monopolies in that
they tend to charge a higher price and supply less product than firms in per-
fectly competitive industries. Do you agree? Explain.
9.5 In the long run, monopolistically competitive firms are inherently
inefficient. Do you agree? Explain.
9.6 Explain the importance of advertising in monopolistically competi-
tive industries. How does this compare with the importance of advertising
in perfectly competitive industries?
9.7 In monopolistically competitive industries, what is the optimal level
of advertising expenditure? Explain.
Chapter Questions 375
9.8 The demand for the product of a typical firm in a monopolistically
competitive industry tends to be more price inelastic than the demand for
the product of a monopolist. Do you agree? Explain.
9.9 In the long run, the selling price of a monopolistically competitive
firm’s product is equal to the minimum per-unit cost of production. Do you
agree with this statement? If not, then why not?
9.10 If a typical firm in a monopolistically competitive industry earns an
economic loss, should the firm shut down? Would your answer be different
if the firm were perfectly competitive?
9.11 If some firms exit a monopolistically competitive industry, what
will happen to the demand curve for the typical firm remaining in the
industry?
9.12 Compared with perfect competition, how is monopolistic competi-
tion similar to monopoly? How different?
9.13 What are some of the criticisms of the model of monopolistic
competition?
CHAPTER EXERCISES
9.1 Glamdring Enterprises produces a line of fine cutlery. The demand
equation for the firm’s top-of-the-line cutlery set, Orcrist, is
Glamdring’s total cost equation is
a. Give the firm’s short-run profit-maximizing price and output level.
Verify that Glamdring is earning a positive economic profit. What is
the relationship between price and average total cost?
b. Suppose that the existence of economic profits calculated in part a
attracts new firms into the industry. As a result, the demand curve
facing Glamdring becomes Q = 4.38 - 0.095P.Assuming no change in
the firm’s total cost function, give the new profit-maximizing price and
output level.
c. Is this firm in long-run monopolistically competitive equilibrium?
d. What, if anything, can you say about the relation between the firm’s
demand and average cost curves? Is this result consistent with your
answer to part c?
9.2 Suppose that a firm in a monopolistically competitive industry faces
the following demand equation for its product:
The firm’s total cost equation is
QP=-901.
TC Q Q=- +50 4 2
2
QP=-10 0 2.
376 Market Structure: Monopolistic Competition
a. Give the firm’s short-run profit-maximizing price and output.
b. Verify that the firm is earning a positive economic profit. What is the
relationship between price and average total cost?
c. Suppose that the existence of positive economic profits attracts new
firms into the industry. As a result, the new demand curve facing the
firm is
Is this firm in long-run monopolistically competitive equilibrium?
d. What is the relationship between selling price and average total cost?
Is this consistent with your answer to part c?
9.3 Suppose that in Exercise 9.2 the demand curve for the firm’s product
had been
As before, the firm’s total cost equation is
a. Give the firm’s short-run profit-maximizing price and output.
b. Verify that the firm is earning a negative economic profit.What is the
relation between price and average total cost?
c. Suppose that the existence of negative economic profits causes some
firms to exit the industry. As before, the demand curve facing the firm
becomes
What is the relation between selling price and average total cost? Is
this consistent with your answer to part b?
SELECTED READINGS
Chamberlin, E. The Theory of Monopolistic Competition. Cambridge, MA: Harvard Univer-
sity Press, 1933.
Demsetz, H. “The Welfare and Empirical Implications of Monopolistic Competition.” Eco-
nomic Journal, September (1964), pp. 623–641.
———. “Do Competition and Monopolistic Competition Differ?” Journal of Political
Economy, January–February (1968), pp. 146–168.
Friedman, M. Capitalism and Freedom. Chicago: University of Chicago Press, 1981.
Galbraith, J. K. Economics and the Public Purpose. Boston: Houghton Mifflin, 1973.
Henderson, J. M. and R. E. Quandt. Microeconomic Theory: A Mathematical Approach, 3rd
ed. New York: McGraw-Hill, 1980.
Hope, S. Applied Microeconomics. New York: John Wiley & Sons, 1999.
Robinson, J. The Economics of Imperfect Competition. London: Macmillan, 1933.
QP=-3 891 0 04545
TC Q Q=-+75 3
2
Q
P
=-3004.
Q
P
=-3 891 0 04545
TC Q Q=-+75 3
2
Selected Readings 377
Silberberg, E. The Structure of Economics: A Mathematical Analysis, 2nd ed. New York:
McGraw-Hill, 1990.
Stigler, G. J. The Organization of Industry. Homewood, IL: Richard D. Irwin, 1968.
Telser, L. G. “Monopolistic Competition: Any Impact Yet?” Journal of Political Economy,
March–April (1968), pp. 312–315.
378 Market Structure: Monopolistic Competition
10
Market Structure:
Duopoly and Oligopoly
379
Despite its shortcomings, the analysis of monopolistically competitive
industries provides valuable insights into the operations of markets in
general. We will next examine the cases of duopoly and oligopoly. An oli-
gopoly is an industry comprising “a few” firms. What constitutes “a few” in
this context, however, is somewhat debatable. A duopoly, which is a special
case of oligopoly, is an industry comprising two firms.
The distinguishing feature of oligopolistic or duopolistic market struc-
tures, especially compared with perfect competition or monopoly, is not
simply a matter of the number of firms in the industry. Rather, it is the
degree to which the output, pricing, and other decisions of one firm affect,
and are affected by, similar decisions made by other firms in the industry.
What is important is the interdependence of the managerial decisions
among the various firms in the industry.
The interdependence of firm behavior in duopolistic or oligopolistic
industries contrasts with market structures encountered in earlier chapters.
There was previously no need to consider the strategic behavior of rival
firms, either because the output of each firm was very small relative to
industry output (perfect competition) or because the firm had no competi-
tors (monopoly) or because of some combination of the two (monopolistic
competition). In the United States, where collusion between and among
firms is illegal, oligopolistic behavior may be modeled analytically as a non-
cooperative game in which the actions of one firm to increase market share
will, unless countered, result in a reduction of the market share of other
firms in the industry. Thus, action will be followed by reaction. This inter-
dependence is the essence of an analysis of duopolistic or oligopolistic
market structures.
CHARACTERISTICS OF DUOPOLY AND
OLIGOPOLY
There are a number of approaches to the analysis of duopolistic and
oligopolistic markets. Each of the models we discuss is developed for the
duopolistic market but can easily be generalized to the case of oligopolies.
Before examining these analytical approaches, we make some general state-
ments about the basic characteristics of duopolies and oligopolies.
NUMBER AND SIZE DISTRIBUTION OF SELLERS
“Oligopoly” refers to the condition in which industry output is domi-
nated by relatively few large firms. Although there is no precise definition
attached to the word “few,” two to eight firms controlling 75% or more of
a market could be defined as an oligopoly. However an oligopolistic market
structures is defined, its distinguishing characteristic is strategic interaction,
which refers to the extent to which the pricing, output, and other decisions
of one firm affect, and are affected by, the decisions of other firms.
The interdependence of firms in an industry is illustrated in Figure 10.1,
which shows the demand curve faced by all firms in the industry, DD, and
the demand curve faced by an individual firm, dd. The rationale behind the
diagram is as follows. If all firms in the industry decide to lower their price,
say from P
1
to P
2
, then the quantity demanded by consumers will increase
from Q
1
to Q
2
.
Suppose, however, that a single firm in the industry decided to reduce
price from P
1
to P
2
in the expectation that other firms would not respond
in a similar manner. In this case, the firm could anticipate a substantial
increase in its sales, say from Q
1
to Q
3
.This implies that over this price range,
the demand curve facing the individual firm is more price elastic than the
380 Market Structure: Duopoly and Oligopoly
P
3
Q
2
Q
1
P
1
P
2
0
D
D
d
d
FIGURE 10.1 Oligopolistic industry
and individual demand curves.
demand curve faced by the entire industry. The decision by one firm to uni-
laterally lower its selling price will result in a substantially larger market
share, provided this price reduction is not matched by the firm’s rivals—a
dubious assumption, indeed.
NUMBER AND SIZE DISTRIBUTION OF BUYERS
The number and size distribution of buyers in duopolistic and oligopo-
listic is usually unspecified, but generally is assumed to involve a large
number of buyers.
PRODUCT DIFFERENTIATION
Products sold by duopolies and oligopolies may be either homogeneous
or differentiated. If the product is homogeneous, the industry is said to be
purely duopolistic or purely oligopolistic. Examples of pure oligopolies are
the steel and copper industries. Examples of industries producing differen-
tiated products are the automobile and television industries.
CONDITIONS OF ENTRY AND EXIT
For either duopolies or oligopolies to persist in the long run, there must
exist conditions that prevent the entrance of new firms into the industry.
There is disagreement among economists over just what these conditions
are. Bain (1956) has argued that these conditions should be defined as any
advantage that existing firms hold over potential competitors, while Stigler
(1968) argues that these barriers to entry comprise any costs that must be
paid by potential competitors that are not borne by existing firms in the
industry. Many of the barriers to entry erected by oligopolists are the same
as those used by monopolists (see Chapter 8). Oligopolist also can control
the industry supply of a product and enhance its market power through the
control of distribution outlets, such as by persuading retail chains to carry
only its product. Persuasion may take the form of selective discounts, long-
term supply contracts, or gifts to management. Devices such as product war-
ranties also serve as an effective barrier to entry. New car warranties, for
example, typically require the exclusive use of authorized parts and service.
Such warranties limit the ability of potential competitors from offering
better or less-expensive products.
Definition: A duopoly is an industry comprising two firms producing
homogeneous or differentiated products; it is difficult to enter or leave the
industry.
Definition: A oligopoly is an industry comprising a few firms producing
homogeneous or differentiated products; it is difficult to enter or leave the
industry.
Characteristics of Duopoly and Oligopoly 381
MEASURING INDUSTRIAL CONCENTRATION
It was demonstrated in Chapter 8 that perfect competition results in an
efficient allocation of resources. Perfect competition results in the produc-
tion of goods and services that consumers want at least cost. As we move
further away from the assumptions underlying the paradigm of perfect com-
petition, with monopoly being the extreme case, firms acquire increasing
levels of market power, which usually results in prices that are higher and
output levels that are lower than socially optimal levels.
Oligopolies are characterized by a “few” firms dominating the output of
an industry. In many respects, an oligopolistic industry is like art—you know
it when you see it. But is it possible to measure the extent to which pro-
duction is attributable to a select number of firms? Is it possible to gauge
the degree of industrial concentration? To illustrate the concerns associated
with industrial concentration, it is useful to review the historical develop-
ment of antitrust legislation in the United States, where the federal gov-
ernment has attempted to remedy the socially nonoptimal outcomes of
imperfect competition either by enacting regulations to encourage compe-
tition and limit market power, or by regulating industries to encourage
socially desirable outcomes.
In 1887 Congress created the Interstate Commerce Commission to
correct abuses in the railroad industry, and in 1890 it passed the landmark
Sherman Antitrust Act, which asserted that monopolies and restraints of
trade were illegal. Unfortunately, the Sherman Act was deficient in that
its provisions were subject to alternative interpretations. Although the
Sherman Act banned monopolies, and certain kinds of monopolistic behav-
ior were illegal, it was unclear what constituted a restraint of trade.
Not surprisingly, actions brought by the U.S. Department of Justice
against firms believed to be in violation of the Sherman Act ended up in
the courts.Two of the most significant court challenges to prosecution under
the Sherman Act involved Standard Oil and American Tobacco. While the
U.S. Supreme Court in 1911 found both companies in violation of provi-
sions of the Sherman Act, the Court also made it clear that not every action
that seemed to restrain trade was illegal. The Justices ruled that market
structure alone was not a sufficient reason for prosecution under the
Sherman Act, indicating that only “unreasonable” actions to restrain trade
violated the terms of the law. As a result of this “rule of reason,” between
1911 and 1920 actions by the Justice Department against Eastman Kodak,
International Harvester, United Shoe Machinery, and United States Steel
were dismissed. Federal courts ruled that although each of these companies
controlled an overwhelming share of its respective market, there was no
evidence that these companies engaged in “unreasonable conduct.”
In an effort to strengthen the Sherman Act and clarify the rule of reason,
in 1914 Congress passed the Clayton Act, which made illegal certain spe-
cific practices. In general, the Clayton Act limited mergers that lessened
382 Market Structure: Duopoly and Oligopoly
competition or tended to create monopolies. In that same year, the Federal
Trade Commission was created to investigate “the organization, business
conduct, practices, and management of companies” engaged in interstate
commerce. Although the Clayton Act clarified many of the provisions of
the Sherman Act, the focus remained on the “rule of reason.” This changed
in 1945, when the Aluminum Corporation of America (Alcoa) was prose-
cuted for violating the Sherman Act by monopolizing the raw aluminum
market.
In a landmark case, United States versus Aluminum Company of
America, the Court ruled that while Alcoa engaged in “normal, prudent, but
not predatory business practices” it was the structure of the market per se
that constituted restraint of trade. On the basis of the per se rule, the Court
ordered the dissolution of Alcoa. The following year, other court cases
resulted in an extension of the Clayton Act that made illegal both tacit and
explicit acts of collusion. In its extreme form, collusion results in pricing and
output results that reflect monopolistic behavior. The implications of collu-
sive behavior by firms in an industry will be discussed at greater length later
in this chapter.
In the years to follow, Congress enacted several additional pieces of leg-
islation to deal with the problems associated with monopolistic behavior
and restraint of trade. In 1950, for example, the Celler–Kefauver Act, gave
the Justice Department the power to monitor and enforce the provisions
of the Clayton Act. Nevertheless, there remained considerable uncertainty
about what constituted an unacceptable merger. In response, the Justice
Department promulgated guidelines for identifying mergers that were
deemed to be unacceptable. These guidelines were initially based on the
notion of a concentration ratio. It was determined, for example, that if the
four largest firms in an industry controlled 75% or more of a market, any
firm with a 15% market share attempting to acquire another firm in the
industry would be challenged under the terms of the Clayton Act.
CONCENTRATION RATIO
The concentration ratio compares the dollar value of total shipments in
an industry accounted for by a given number of firms in an industry. The
U.S. Census Bureau, for example, calculates concentration ratios for the 4,
8, 20, and 50 largest companies, which are grouped according to a stan-
dardized industrial classification.
1
(See later: Table 10.1.)
Measuring Industrial Concentration 383
1
In 1997 the U.S. Census Bureau replaced the U.S. Standard Industrial Classification (SIC)
system with the North American Industry Classification System (NAICS). NAICS industries
are identified with a 6-digit code, which accommodates a larger number of sectors and pro-
vides more flexibility in designating subsectors.The new system also provides for greater detail
for the three NAICS countries (the United States, Canada, and Mexico). The international
NAICS agreement fixes only the first five digits of the code. Thus, the sixth digit in any given
item in the U.S. code may differ from that of the Canadian of Mexican code. The SIC system
had a 4-digit code.
Definition: Concentration ratios measure the percentage of the total
industry revenue or market share that is accounted for by the largest firms
in an industry.
Although the concentration ratios in Table 10.1 will provide useful
insights into the degree of industrial concentration, it is important not to
read too much into the statistics. To begin with, standard industrial classifi-
cations are based on the similarity of production processes but ignore sub-
stitutability across products, such as glass versus plastic containers. U.S.
Census data describe domestically produced goods and do not include
import competing products. Table 10.1 indicates, for example, that the eight
largest U.S. makers of motor vehicles and bodies account for 91% of indus-
try output. By omitting data from foreign competitors, especially from
Japanese automobile manufacturers, this statistic clearly overstates the
actual market share of U.S. automakers.
Another weakness of concentration ratios is that they are not sensitive
to differences within categories. The concentration ratio, for example,
makes no distinction between industry A, in which the top four companies
have 24% of the market, and industry B, in which the largest firm has 90%
384 Market Structure: Duopoly and Oligopoly
TABLE 10.1 Concentration Ratios and Herfindahl–Hirschman Indices in
Manufacturing, 1997
Value of HHI for
Number of shipments Largest 4 Largest 8 largest 50
NAICS Industry companies ($ millions) companies companies
a
companies
a
312221 Cigarettes 9 29,253 98.9 (D) (D)
331411 Primary copper 9 6,128 94.5 (D) 2,392.2
327213 Glass containers 11 4,198 91.1 98.0 2,959.9
312120 Breweries 494 18,203 89.7 93.4 (D)
311230 Breakfast cereals 48 6,556 86.7 94.7 2,772.7
336411 Aircraft 172 57,893 84.8 96.0 (D)
336111 Automobiles 173 95,366 79.5 96.3 2,349.7
325611 Soap and detergents 738 17,773 65.6 77.9 1,618.6
325110 Petrochemicals 42 19,468 59.8 83.3 1,187.0
331312 Primary aluminum 13 6,225 59.2 81.7 1,230.6
334413 Semiconductors 993 78,479 52.5 64.0 1,080.1
334111 Electronic computers 531 66,302 45.4 68.5 727.9
337111 Iron and steel 191 56,994 32.7 52.7 445.3
324110 Petroleum refineries 122 158,668 28.5 48.6 422.1
322121 Paper mills 121 42,966 37.6 59.2 541.7
325412 Pharmaceuticals 707 66,735 35.6 50.1 462.4
323117 Book printing 690 5,517 31.9 45.1 363.7
332510 Hardware 906 11,061 17.4 27.7 154.6
321113 Sawmills 4,024 24,632 16.8 23.2 112.3
a
(D), data omitted because of possible disclosure; data are included in higher level totals.
Source: U.S. Census Bureau, 1997 Economic Census.
of the market, while the next three companies account for an additional
6%. In both industries the concentration ratio for the largest four compa-
nies is 96%.
HERFINDAHL–HIRSCHMAN INDEX
In 1982 and 1984, guidelines of the U.S. Department Justice for identi-
fying unacceptable mergers were modified with the development of the
Herfindahl–Hirschman Index (HHI). The HHI is calculated as
(10.1)
where n is the number of companies in the industry and S
i
is the ith
company’s market share expressed in percentage points. The Herfindahl
–Hirschman Index ranges in value from zero to 10,000. According to the
modified guidelines, the Justice Department views any industry with an
HHI of 1,000 or less as unconcentrated. Mergers in unconcentrated indus-
tries will go unchallenged. If the index is between 1,000 and 1,800, a pro-
posed merger will be challenged by the Justice Department if, as a result of
the merger, the index rises by more than 100 points. Finally, if the HHI is
greater than 1,800, proposed mergers will be challenged if the index
increases by more than 50 points. Table 10.1 summarizes concentration
ratios for the largest four and eight companies and the Herfindahl–
Hirschman Index for the 19 industries listed.
Definition:The Herfindahl–Hirschman Index is a measure of the size dis-
tribution of firms in an industry that considers the market share of all firms
and gives a disproportionately large weight to larger firms.
The HHI is superior to the concentration ratio in that it not only uses
the market share information of all firms in the industry, but by squaring
individual market shares, gives greater weight to larger firms.Thus the HHI
for industry A in our earlier example is 2,304, while the HHI for the more
concentrated industry B is 8,112. According to the Department of Justice
guidelines, both markets are concentrated.
MODELS OF DUOPOLY AND OLIGOPOLY
As mentioned earlier, the distinctive characteristic of duopolies and oli-
gopolies is the interdependence of firms. It is difficult to formulate models
of duopoly and oligopoly because of the many ways in which firms deal with
this interdependence. Thus, there is no general theory to explain this inter-
dependence. The models presented next are based on specific assumptions
regarding the nature of this interaction.
HHI =
=Æ
Â
S
i
in
2
1
Models of Duopoly and Oligopoly 385
SWEEZY (“KINKED” DEMAND CURVE) MODEL
Although managers of oligopolistic firms are aware of the law of
demand, they are also aware that their pricing and output decisions depend
on the pricing and output decisions of their competitors. More specifically,
such firms know that their pricing and output decisions will provoke pricing
and output adjustments by their competitors. Another notable characteris-
tic of oligopolistic industries is the relative infrequency of price changes.
Paul Sweezy (1939) attempted to explain this price rigidity by suggesting
that oligopolists face a “kinked” demand curve, as illustrated in Figure 10.2.
Definition: Price rigidity is characterized by the tendency of product
prices to change infrequently in oligopolistic industries.
Definition: The “kinked” demand curve is a model of firm behavior that
seeks to explain price rigidities in oligopolistic industries.
Figure 10.2 depicts the situation of a typical firm operating in an oli-
gopolistic industry. The demand curve for the product of the firm really
comprises two demand curves, D
1
and D
2
. Unlike a monopoly or monopo-
listically competitive firm that has a degree of market power along the
length of a single demand curve, the oligopolist faces a demand curve char-
acterized by a “kink,” illustrated in Figure 10.2 as the heavily darkened
portions of demand curves D
1
and D
2
.
Suppose initially that the price of the oligopoly’s product is P*. If the
firm raises the price of its product above P* and its competitors do not
follow the price increase, it will lose some market share. The firm realizes
this and is reluctant to sacrifice its market position to its competitors. On
the other hand, if the firm attempts to capture market share by lowering
price, the price decrease will be matched by its rivals, who are not willing
to cede their market share. The firm whose experience is depicted in Figure
386 Market Structure: Duopoly and Oligopoly
D
1
D
2
MR
2
MR
1
QQ*
P*
MC
1
MC
2
MC
3
$
0
FIGURE 10.2 The “kinked” demand
curve (Sweezy) model.