TỔNG HỢP CÁC BÁO CÁO KHOA HỌC VỀ CAO ÁP VÀ VẬT LIỆU ĐIỆN CỦA BỘ MÔN HỆ THỐNG ĐIỆN (ĐẠI HỌC BÁCH KHOA HÀ NỘI)
Bạn đang xem bản rút gọn của tài liệu. Xem và tải ngay bản đầy đủ của tài liệu tại đây (21.01 MB, 82 trang )
ĐẠI HỌC BÁCH KHOA HÀ NỘI
BỘ MÔN HỆ THỐNG ĐIỆN
eBook for You
PHҪNI
CAOÁPVÀVҰT LIӊU ĈIӊN
Tổng hợp các bài báo khoa học giai đoạn 2007-2012
Bộ môn Hệ thống điện - Đại học Bách Khoa Hà Nội
1
eBook for You
1
NGHIÊN CӬU CÔNG NGHӊ PHÂN TÁCH CÁC PHҪN TӰ CÓ TÍNH
ĈIӊN DҮN KHÁC NHAU BҴNG KӺ THUҰT CAO ÁP TƬNH ĈIӊN
STUDYING THE TECHNOLOGY FOR SEPARATING ELEMENTS WITH DIFFERENT
ELECTRICAL CONDUCTIVITITES USING HV ELECTROSTATIC TECHNIQUE
Nguy͍n Ĉình Th̷ng, Ĉinh Qu͙c Trí
Tr˱ͥng Ĉ̩i h͕c Bách Khoa Hà N͡i
TÓM TҲT
Vi͟c tách các ph̿n t΅ có trͣ sͩ ÿi͟n d̓n khác nhau ÿ́ͻc ng dͽng r̽t rͱng rãi
trong các lƭnh vΉc công nghi͟p, nông nghi͟p, x΅ lý ch̽t th̻i ÿi͟n t΅… Bài báo trình
bày mô hình thi͗t bͣ và k͗t qu̻ nghiên cu s΅ dͽng công ngh͟ phân tách các h̹t
b͉ng kΏ thuͅt cao áp tƭnh ÿi͟n. Công ngh͟ ng dͽng kΏ thuͅt cao áp tƭnh ÿi͟n ÿã
ÿ́ͻc nghiên cu nhi͙u năm t̹i các ńͳc trên th͗ giͳi do có r̽t nhi͙u ́u ÿi͛m nh́
tiêu tͩn ít năng ĺͻng, có hi͟u su̽t cao và không gây ô nhi͝m môi tŕ͵ng. Tuy nhiên
t̹i Vi͟t Nam, vi͟c nghiên cu sâu công ngh͟ và ̻nh h́ͷng cͿa các y͗u tͩ khác
nhau nh́ ÿi͟n tŕ͵ng, môi tŕ͵ng tͳi hi͟u qu̻ thi͗t bͣ còn ch́a ÿ́ͻc ÿ̿u t́ thͧa
ÿáng.
ABSTRACT
The separation of elements with different conductivities is widely applied in
industry, agriculture, e-waste processing technology… This paper presents the
developed device and the research results, implementing the technology of high-
voltage electrostatic technique in particles separation. Application of the technology
has been studied over the world for many years due to its advantages, such as low
power consumption, high separation performance and environment-friendly. However
in Vietnam, the deep research of technology and impact of different factors, such as
the electric field and the environment, has not been invested sufficiently.
Tӯ khóa: phân tách hҥt, xӱ lý chҩt thҧi ÿiӋn tӱ, cao áp tƭnh ÿiӋn.
1. MӜT SӔ ĈҺC TÍNH CӪA CÁC
PHҪN TӰ CҪN PHÂN TÁCH
1.1 ĈiӋn dүn và trӑng lѭӧng riêng
ĈӇ phөc vө cho viӋc nghiên cӭu
công nghӋ và thí nghiӋm, các mүu ÿѭӧc
chӑn chӭa phҫn tӱ cҫn phân tách là sa
khoáng lҩy tӯ mӓ Cҭm hòa (Cҭm xuyên,
Hà Tƭnh). Cѫ sӣ lҩy sa khoáng ÿӇ làm thí
nghiӋm dӵa trên sӵ khác biӋt vӅ trӏ sӕ ÿiӋn
trӣ suҩt cӫa các hҥt phҫn tӱ cҫn phân tách
trong sa khoáng ÿѭӧc thӇ hiӋn trong bҧng 1
nhѭ sau (theo [1]):
B̫ng 1. Ĉ̿c tính cͯa m͡t s͙ h̩t khoáng ch̭t ÿ˱ͫc phân tách
TT Sa khoáng Trӑng lѭӧng riêng, g/cm
3
ĈiӋn trӣ suҩt, ȍ.cm Phân loҥi
1
Ilmenite
4,7 1-10
-3
Dүn ÿiӋn
2
Zircon
4,6-4,7 10
13
-10
15
ĈiӋn môi
Tổng hợp các bài báo khoa học giai đoạn 2007-2012
Bộ môn Hệ thống điện - Đại học Bách Khoa Hà Nội
2
eBook for You
2
3
Rutile
4,2-5,2 1-10
2
Dүn ÿiӋn
4
Thҥch anh
2,5-2,8 10
12
-10
17
ĈiӋn môi
5
Pirit
4,9-5,2 10
-5
-10
-1
Dүn ÿiӋn
1.2 Kích thѭӟc quy ÿәi cӫa các hҥt
Trong thӵc tӃ các hҥt khoáng sҧn có
hình dҥng rҩt ÿa dҥng, ÿӇ thuұn tiӋn cho
tính toán và mô phӓng ngѭӡi ta thѭӡng
quy vӅ hình cҫu, hình elip hoһc bán elip
[2,3]. Bҵng thiӃt bӏ chuyên dөng và
phѭѫng pháp quy hình dҥng các hҥt vӅ
dҥng hình cҫu có thӇ tính ÿѭӧc bán kính
tѭѫng ÿѭѫng cӫa các hҥt theo công thӭc
sau [2,3,4]:
3
0,62
td
rabc
(1)
Trong ÿó a, b và c tѭѫng ӭng là
chiӅu dài, rӝng và cao cӫa hҥt.
Các hҥt ÿӇ ÿo ÿҥc ÿѭӧc lҩy ngүu
nhiên vӟi sӕ lѭӧng mүu là 400 hҥt.
Tӯ kӃt quҧ ÿo ÿҥc và tính toán có thӇ
rút ra kӃt luұn sѫ bӝ: bán kính tѭѫng
ÿѭѫng cӫa các hҥt khoáng sҧn tҥi mӓ Cҭm
hòa dao ÿӝng trong khoҧng tӯ 70 ÿӃn
230ȝm. Kích thѭӟc này rҩt phù hӧp vӟi
viӋc dùng thiӃt bӏ kiӇu máng nghiêng và
cho hiӋu suҩt tách cao [3,5].
2. MÔ HÌNH CӪA THIӂT Bӎ
Mô hình thiӃt bӏ thí nghiӋm do tác
giҧ cùng các ÿӗng nghiӋp thiӃt kӃ, chӃ tҥo
và lҳp ÿһt tҥi phòng thí nghiӋm cao áp và
vұt liӋu cӫa Trѭӡng Ĉҥi hӑc Bách khoa Hà
nӝi. ViӋc lӵa chӑn mô hình thiӃt bӏ kiӇu
này dӵa trên mӝt sӕ cѫ sӣ sau:
Mô hình thiӃt bӏ này hiӋn còn chѭa
ÿѭӧc ӭng dөng tҥi ViӋt N
am.
ThiӃt bӏ ÿѭӧc nghiên cӭu có nhiӅu ѭu
ÿiӇm so vӟi các thiӃt bӏ ÿang ÿѭӧc sӱ
dөng tҥi ViӋt Nam: có công suҩt và
hiӋu suҩt phân tách cao, dӉ dàng lҳp
ÿһt vұn hành hiӋu chӍnh, tiêu hao ít
năng lѭӧng.
ViӋc sӱ dөng mô hình này cho phép
tiӃn hành thí nghiӋm theo các chӃ ÿӝ
vұn hành thӵc tӃ, nhѭng vӟi ѭu ÿiӇm
cҩu tҥo ÿѫn g
iҧn nên dӉ dàng thay ÿәi
các thông sӕ kӻ thuұt (chiӅu dài, hình
dҥng, vӏ trí ÿiӋn cӵc…).
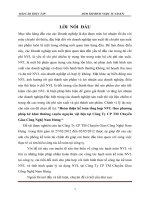
Sѫ ÿӗ mô hình thiӃt bӏ trên hình 1:
Hình 1. S˯ ÿ͛ cͯa mô hình thi͇t b͓ phân
tách ki͋u máng nghiêng
Tổng hợp các bài báo khoa học giai đoạn 2007-2012
Bộ môn Hệ thống điện - Đại học Bách Khoa Hà Nội
3
eBook for You
3
1 - PhӉu chӭa nguyên liӋu; 2 - Máng
nghiêng; 3 - ĈiӋn cӵc trên; 4 - ĈiӋn cӵc
dѭӟi (hình trө); 5 - Khay hӭng sҧn phҭm;
ĈӇ thuұn tiӋn cho viӋc phân tích các
kӃt quҧ thí nghiӋm ӣ ÿây tác giҧ chӑn sӕ
lѭӧng khay hӭng sҧn phҭm là 20, cho phép
thu hӗi sҧn phҭm phân tách ÿѭӧc tҥi nhiӅu
vӏ trí khác nhau.
Các kӃt quҧ thí nghiӋm cho phép
ÿánh giá nhӳng ÿһc tính cӫa các phҫn tӱ
cҫn tách và phân tích nhӳng ҧnh hѭӣng cӫa
ÿiӋn cao áp tƭnh ÿiӋn cNJng nhѭ mӝt sӕ ҧnh
hѭӣng khác ÿӃn hiӋu suҩt cӫa mô hình
thiӃt bӏ, trên cѫ sӣ ÿó có thӇ hiӋu chӍnh
nhҵm hoàn thiӋn mô hình thiӃt bӏ.
Mô t̫ quá trình ho̩t ÿ͡ng cͯa thi͇t b͓:
ɚ. Tr˱ͥng hͫp ch˱a có ÿi͏n tr˱ͥng:
Dѭӟi tác dөng cӫa th
iӃt bӏ rung các
hҥt sӁ chuyӇn ÿӝng tӯ phӉu xuӕng máng
nghiêng. Lúc này các hҥt chuyӇn ÿӝng
hoàn toàn dѭӟi tác dөng cӫa trӑng lӵc và
bay vào các khay hӭng sҧn phҭm.
Quӻ ÿҥo chuyӇn ÿӝng cӫa các hҥt
chӍ chӏu tác ÿӝng cӫa trӑng lӵc, lӵc này
ÿѭӧc tính theo công thӭc (2) nhѭ sau:
3
4
cos
3
gtd
Fmg rg u S J D
(2)
Trong ÿó: m - khӕi lѭӧng cӫa hҥt; r
td
- bán
kính tѭѫng ÿѭѫng cӫa hҥt; J - tӹ trӑng
riêng cӫa hҥt; g - gia tӕc rѫi tӵ do vӟi trӏ
sӕ g = 9,8m/s
2
; D - góc nghiêng cӫa máng.
TiӃn hành nhiӅu thí nghiӋm vӟi viӋc
thay ÿәi trӏ sӕ góc nghiêng cӫa máng ta
cNJng dӉ dàng nhұn thҩy thay ÿәi cӫa sӵ
phân bӕ lѭӧng hҥt trong các khay thu hӗi
sҧn phҭm (hình 2). Nguyên nhân chӫ yӃu
là do ҧnh hѭӣng cӫa tӕc ÿӝ chuyӇn ÿӝng
ban ÿҫu cӫa các hҥt. Có thӇ kӃt luұn trong
trѭӡng hӧp này sӵ phân bӕ các hҥt trong
các khay thu hӗi phө thuӝc v
ào kích thѭӟc
và tӹ trӑng riêng, nhѭng hiӋu suҩt phân
tách không cao (hàm lѭӧng Ilmenite nhұn
ÿѭӧc là 50%, ÿӕi vӟi Zircon là 45%).
Hình 2. Phân b͙ kh͙i l˱ͫng các h̩t trong
các khay theo góc nghiêng cͯa máng.
b. Tr˱ͥng hͫp có ÿi͏n tr˱ͥng: (ÿiӋn cӵc
phía trên ÿѭӧc cҩp ÿiӋn áp cӵc tính âm,
còn ÿiӋn cӵc phía dѭӟi – cӵc tính dѭѫng).
ĈiӋn trѭӡng sӁ xuҩt hiӋn giӳa các
ÿiӋn cӵc vӟi máng nghiêng. Khác vӟi
trѭӡng hӧp ÿҫu, các hҥt chuyӇn ÿӝng theo
máng nghiêng sau ÿó chuyӇn ÿӝng trong
ÿiӋn t
rѭӡng. ĈiӋn trѭӡng tác ÿӝng lên các
hҥt này và làm thay ÿәi quӻ ÿҥo chuyӇn
Tổng hợp các bài báo khoa học giai đoạn 2007-2012
Bộ môn Hệ thống điện - Đại học Bách Khoa Hà Nội
4
eBook for You
4
ÿӝng cӫa chúng tùy theo tính chҩt cӫa hҥt.
Thay ÿәi trӏ sӕ ÿiӋn áp ÿһt lên ÿiӋn cӵc tӭc
là thay ÿәi cѭӡng ÿӝ ÿiӋn trѭӡng, khi ÿó có
thӇ thҩy rҩt rõ và ghi lҥi sӵ thay ÿәi quӻ
ÿҥo cӫa các hҥt.
Phѭѫng trình chuyӇn ÿӝng cӫa các
hҥt sa khoáng theo ÿӏnh luұt 2 Newton
nhѭ sau:
.
dv
mF
dt
¦
G
JG
(3)
m- khӕi lѭӧng cӫa hҥt sa khoáng,
- vecto vұn tӕc chuyӇn ÿӝng cӫa hҥt,
tәng cӫa các lӵc tác ÿӝng lên hҥt, t- thӡi
gian chuyӇn ÿӝng.
Các lӵc tác ÿӝng lên hҥt sa khoáng
bao gӗm nhӳng thành phҫn sau:
- Tr͕ng lc:
3
4
cos
3
gtd
Fmg rg u S J D
- Lc tác ÿ͡ng cͯa ÿi͏n tr˱ͥng:
.
e
FEq
Vӟi E - cѭӡng ÿӝ ÿiӋn trѭӡng, q - ÿiӋn tích
cӫa các hҥt.
- Lc do s phân b͙ ÿi͏n tr˱ͥng không
ÿ͉u:
3
0
1
4. . . . .
2
p
F r E gradE
H
SH
H
Vӟi H
0
- hҵng sӕ ÿiӋn môi tuyӋt ÿӕi và bҵng
8,854.10
-12
F/m, H - hҵng sӕ ÿiӋn môi.
- Lc c̫n cͯa môi tr˱ͥng:
2
0,5. . . .
cx
FcvS J
Vӟi c
x
- HӋ sӕ khí ÿӝng hӑc cӫa môi
trѭӡng, v - vұn tӕc chuyӇn ÿӝng cӫa hҥt, S
- tiӃt diӋn cӫa hҥt.
Ĉһc biӋt khi ta tăng ÿiӋn áp ӣ cӵc
trên vѭӧt quá mӝt trӏ sӕ nào ÿó sӁ xuҩt
hiӋn hiӋn tѭӧng có mӝt sӕ hҥt khi chuyӇn
ÿӝng trong ÿiӋn trѭӡng mҥnh có xu hѭӟng
bay lên và va ÿұp vào ÿiӋn cӵc trên sau ÿó
quay ngѭӧc trӣ lҥi vào máng nghiêng.
Ĉӗng thӡi mӝt sӕ hҥt có xu hѭӟng bӏ hút
vӅ phía cӵc dѭӟi (cӵc tính dѭѫng). ĈiӅu
này chӭng tӓ ÿã xҧy ra hiӋn tѭӧng tích
ÿiӋn vӟi cѭӡng ÿӝ cao cӫa các hҥt. So sánh
vӟi trѭӡng hӧp trѭӟc (khi chѭa có ÿiӋn
trѭӡng), các hҥt sӁ phân bӕ trên sӕ lѭӧng
các khay thu hӗi nhiӅu hѫn (xem hình 3).
Hình 3. Phân b͙ kh͙i l˱ͫng các h̩t trong
các khay theo ÿi͏n áp ÿ̿t lên ÿi͏n cc
3. KӂT LUҰN:
Quan sát khay thu hӗi sҧn phҭm bҵng
mҳt thѭӡng dӉ dàng nhұn thҩy ӣ phía
nhӳng khay nҵm ӣ phía xa ÿiӋn cӵc chӭa
các hҥt có mҫu sүm hѫn (các hҥt Ilmenite)
Tổng hợp các bài báo khoa học giai đoạn 2007-2012
Bộ môn Hệ thống điện - Đại học Bách Khoa Hà Nội
5
eBook for You
5
còn các khay ӣ gҫn phía dѭӟi ÿiӋn cӵc có
mҫu sáng hѫn (Zircon và thҥch anh). Các
mүu sҧn phҭm nhұn ÿѭӧc trong khay thu
hӗi quһng ÿã ÿѭӧc tiӃn hành ÿánh giá
nhҵm hoàn thiӋn thiӃt bӏ.
Căn cӭ vào kӃt quҧ thӱ nghiӋm trên mô
hình thiӃt bӏ vӟi viӋc thay ÿәi nhiӅu thông
sӕ có thӇ nhұn ÿѭӧc kӃt quҧ tách vӟi hiӋu
suҩt cao. Khi lӵa c
hӑn ÿѭӧc thông sӕ tӕi
ѭu nhѭ cѭӡng ÿӝ ÿiӋn trѭӡng, kích thѭӟc,
vӏ trí và góc nghiêng cӫa ÿiӋn cӵc…, kӃt
quҧ phân tách sa khoáng tӯ mӓ Cҭm Hòa
có thӇ ÿҥt ÿѭӧc nhӳng tӹ lӋ nhѭ sau:
Mүu tinh quһng Ilmenite nhұn ÿѭӧc có
chӭa 99,6% Ilmenite;
Mүu tinh quһng Zircon nhұn ÿѭӧc chӭa
99,0% Zircon.
Nhѭ vұy có thӇ thҩy viӋc sӱ dөng mô
hình thiӃt bӏ và công nghӋ cao áp tƭnh ÿiӋn
vӟi viӋc lӵa chӑn ÿúng các thông sӕ kӻ
thuұt liên quan (cѭӡng ÿӝ ÿiӋn trѭӡng, góc
nghiêng cӫa ÿiӋn cӵc, vӏ trí các ÿiӋn
cӵc…) cho phép nâng cao ÿáng kӇ hiӋu
suҩt làm giҫu quһng.
Các kӃt quҧ nghiên cӭu trên khҷng
ÿӏnh lҥi mӝt lҫn nӳa lӧi thӃ cӫa dҥng mô
hình thiӃt bӏ này khi áp dөng ÿӇ tách các
loҥi khoáng sҧn khác có tính chҩt gҫn
giӕng vӟi sa khoáng cӫa mӓ Cҭm Hòa.
TÀI LIӊU THAM KHҦO:
1. Mesenhiashin Ⱥ.I. ɗɥɟɤɬɪɢɱɟɫɤɚɹ ɫɟɩɚɪɚɰɢɹ ɜ ɫɢɥɶɧɵɯ ɩɨɥɹɯ, Ɇ., ɇɟɞɪɚ, 1978.
2.
Vereshagin I.P., Levitov V.I., Mirdabekian G.D., Pashin Ɇ.Ɇ. Ɉɫɧɨɜɵ ɝɚɡɨɞɢɧɚɦɢɤɢ
ɞɢɫɩɟɪɫɧɵɯ ɫɢɫɬɟɦ. Ɇ., ɗɧɟɪɝɢɹ, 1974.
3.
Ĉinh Quӕc Trí, S.Ⱥ. Ʉrivov. Ɉɰɟɧɤɚ ɪɟɠɢɦɚ ɷɥɟɤɬɪɨɫɟɩɚɪɚɰɢɢ ɧɚ ɨɫɧɨɜɟ
ɝɪɚɧɭɥɨɦɟɬɪɢɱɟɫɤɢɯ ɯɚɪɚɤɬɟɪɢɫɬɢɤ ɦɢɧɟɪɚɥɶɧɵɯ ɱɚɫɬɢɰ ɦɟɫɬɨɧɚɯɨɠɞɟɧɢɹ Ʉɚɦɯɨɚ
(ȼɶɟɬɧɚɦ). /ɋɛ. ɞɨɤ. XII ɦɟɠɞɭɧɚɪɨɞɧɚɹ ɧɚɭɱɧɨ-ɬɟɯɧɢɱɟɫɤɚɹ ɤɨɧɮɟɪɟɧɰɢɹ ɫɬɭɞɟɧɬɨɜ
ɢ ɚɫɩɢɪɚɧɬɨɜ. Ɍ.3- ɂɡɞɚɬɟɥɶɫɬɜɨ Ɇɗɂ, 2006 ɝ, ɫ 440-441.
4.
Fraas F. Electrostatic Separation of granular Materials. Bull. U.S Mines, 603,1962.
5.
Berlinxki Ⱥ.I. Ɋɚɡɞɟɥɟɧɢɟ ɦɢɧɟɪɚɥɨɜ, Ɇ., ɇɟɞɪɚ. 1988.
Tổng hợp các bài báo khoa học giai đoạn 2007-2012
Bộ môn Hệ thống điện - Đại học Bách Khoa Hà Nội
6
eBook for You
6
Ĉӏa chӍ liên lҥc: Ĉinh Quӕc Trí, ĈT. (04)38692009
Bӝ môn HӋ thӕng ÿiӋn, trѭӡng Ĉҥi hӑc Bách Khoa Hà Nӝi
Sӕ 1, Ĉҥi Cӗ ViӋt, Hà Nӝi.
Tổng hợp các bài báo khoa học giai đoạn 2007-2012
Bộ môn Hệ thống điện - Đại học Bách Khoa Hà Nội
7
eBook for You
Streamer inception in mineral oil under ac voltage
Influence of electrode geometry, liquid conditioning,
and consequences for test methods of liquids
O. Lesaint
Grenoble Electrical Engineering Laboratory (G2E lab)
CNRS, Grenoble-INP and Joseph Fourier University
Grenoble, France
T.V. Top
now at: Hanoi Polytechnic Institute (IPH)
Hanoi, Vietnam
Abstract—This paper describes an experimental study of
streamer inception in mineral oil under ac voltage, with rod and
point electrodes. Positive and negative streamer inception
frequencies versus voltage are investigated in gaps up to 40 cm
with different electrode shapes and different conditioning of the
oil (filtered oil, addition of cellulose particles, water). Streamer
inception probability increases exponentially versus field, and it
is not possible to simply define an “inception voltage”. A voltage
(or field) value correlated to an inception probability must be
used to properly compare different experiments (comparison
between liquids, influence of pollution, etc.). Under ac, several
effects are superposed to reduce dielectric strength: “scale
effects”, influence of pollution, long time duration. With sharp
points, injected space charges considerably influence
experiments, and the results obtained cannot be extrapolated to
practical applications in which the effect of space charge is
mostly absent.
I. INTRODUCTION
It has been known for a long time that initiation of
breakdown in liquids under ac voltage is a very complex
process. Even in the simplest situation (a liquid between two
metallic electrodes), many parameters are able to influence the
initiation of breakdown:
- the liquid chemical nature;
- “scale” effects. Breakdown voltage in quasi-uniform field
decreases when the stressed liquid volume and/or electrode
surface area are increased [1,2]. "Volume" or "electrode
surface area" effects are usually interpreted in terms of "weak
points” able to trigger breakdown (solid particles in the liquid
volume, or electrode surface defects). The probability to get
large weak points increases with stressed liquid volume, and
electrode surface area;
- pollution: breakdown voltage in quasi-uniform field under
ac decreases when solid particles (metallic, hydrated cellulose
fibers, …) and water are present [3, 4];
- time: breakdown initiation shows a large statistical
variation, and is strongly affected by the time duration of
voltage application (the longer the time, the lower the initiation
voltage);
- injected space charge may also have an influence: field
reduction by homocharges, or increase with heterocharges.
It remains very difficult to model and predict the initiation
of breakdown in practical situations. This study is devoted to
obtain a more comprehensive and quantitative description of
these phenomena under ac voltage. Since breakdown results
from the initiation and propagation of streamers, the study of
initiation can be done with two main types of experiments:
- under moderately divergent field, the average field in the
gap is very high, and all initiated streamers propagate to
breakdown. The measured breakdown voltage is equal to the
voltage required to initiate a streamer;
- under divergent field (point-plane or rod-plane at large
gaps), streamers can appear due to a high local field, but are
unable to propagate to breakdown. It is thus necessary to detect
streamer inception with more sophisticated techniques. The
main practical advantage of these experiments is the absence of
breakdown (no destruction of electrodes, limited degradation of
the oil). On the other hand, experiments with large rod
electrodes impose us to use high voltage and very large gaps to
avoid breakdown.
A previous study of streamer initiation was carried out with
impulse voltage [5] over a wide range of electrode shapes
(from sharp points of μm size to large rounded rods, and with
fixed metallic particles on a flat electrode). This study mainly
highlighted the effect of “electrode surface” under impulse
voltage. Under ac, the problem becomes much more complex,
since the liquid pollution, time, and injected space charges will
have a large influence. With short impulses these parameters
have a small influence: the time duration is too small to allow
motion of particles from the liquid volume up to electrodes,
and space charge development is also very limited. The
experiments carried out here are done with the objective to
separate (as far as possible) the effects of electrode shape, time,
and pollution by solid particles and water.
II. E
XPERIMENTAL TECHNIQUES
The test cell used was a 150 liter transparent PMMA
container (Fig. 1). The high voltage electrode is facing a
grounded aluminum plane, 50x50 cm in size. Steel points (tip
radius of curvature r
p
= 10 to 100 μm), and rods with a
Tổng hợp các bài báo khoa học giai đoạn 2007-2012
Bộ môn Hệ thống điện - Đại học Bách Khoa Hà Nội
8
eBook for You
hemispherical end (radii r
p
= 0.5 to 20 mm) were used. Gap
distances d were investigated up to 40 cm. Both the high
voltage electrode and the distance could be changed without
opening the test cell, and without changing or circulating the
oil, in order to keep exactly the same oil condition. The high
voltage supply was a 300 kV test transformer. To get very
clean oil, the test cell was included in a closed loop including
an oil processing system (1μm filter, degassing and drying). An
insulating tube allowed us to take oil samples in the test cell to
measure particle and water contents. To avoid particle
sedimentation and get an homogeneous and stable particle
content, the oil was continuously stirred with two polyethylene
propellers. Cellulose particles, metallic perticles and water can
be added to clean oil. Table 1 shows typical results of particle
counting when different amounts of cellulose were added to
filtered oil.
Pollution inlet
Drying and
filtration unit
PM
Oil
sampling
stirrers
HV
electrode
Figure 1. Test cell
TABLE I. Typical particle countings.
Particle
size (μm)
Filtered
oil
+ 0,7 mg/l
cellulose
+ 18 mg/l
cellulose
+ 70 mg/l
cellulose
2 -5
252 748 9690 16316
5-10
20 34 6060 806
10-15
4 16 56 76
15-25
2 8 18 18
25-50
1 4 6 6
50-100
0 2 4 5
100-150
0 0 0 0
>150
0 0 0 0
Streamer detection has to fulfill several main requirements.
The size of streamers vary considerably in the experiments:
very small streamers with sharp points at low voltage (charge:
a few pC, duration <1μs), and very large ones at high voltage
with large rods (charge > 1μC, duration > 100μs). Detection
must be very sensitive in order to detect all streamers. During
propagation of a long streamer, a large number a fast current
pulses is detected. Conventional PD measurement systems
based on pulse detection are unable to record properly
streamers: counting of all current pulses leads to considerably
overestimate the streamer number actually generated. The
detection system must also have a very low level of spurious
noise, typically less than 1 shot per hour (in some experiments,
a very low number of streamers can appear, typically 1 per
hour). The system must be able to count properly such rare
events. In this study, inception was detected by the streamer
light emission using a photomultiplier (PM). This provided a
very sensitive detection. A “dead time” of 200 μs was fixed
after each detection to avoid overcounting streamers. The
detection threshold was fixed above the background noise of
the PM, and the test cell was placed in a totally dark room.
III. S
TREAMER INCEPTION FREQUENCY
Fig. 2 shows a typical result obtained with a rod electrode
of medium size (r
p
= 0.5 mm, distance d = 40 cm), in oil of
technical quality without filtration (figures 2 to 4 correspond to
the same oil sample, i.e. without opening the test cell or
circulating the oil).
10
-3
10
-1
10
1
10
3
100 150 200 250
Streamer inception frequency F (minute
-1
)
Crest voltage (kV)
Positive Streamer
Negative Streamer
Figure 2. Inception frequency of positive and negative streamers in oil
without filtration, 20ppm water content. Rod radius r
p
= 0.5mm, gap distance
d = 40 cm.
The average inception frequency F increases exponentially
versus voltage, up to a value ≈ 10
3
streamers / minute
(corresponding to about 1 streamer initiated every half-wave).
The increase of F at higher voltage is then much slower. At
very low voltage, the exponential variation is still observed
down to very low discharge rates (< 10
-2
discharge / minute,
i.e. less than 1 streamer per hour). To obtain significant
measurements at very low rates, total durations up to 2 days
were used in some experiments. In all experiments, no
indication of a “threshold minimum voltage” for streamer
inception could be obtained. The number of positive and
Tổng hợp các bài báo khoa học giai đoạn 2007-2012
Bộ môn Hệ thống điện - Đại học Bách Khoa Hà Nội
9
eBook for You
negative streamers was quite close and varied in a similar way
versus voltage.
From figure 2, it is quite clear that it is impossible to define
an “inception voltage”. In order to make proper comparisons
between experiments (for instance if the liquid nature or
conditioning is changed), only the voltage value corresponding
to an arbitrary discharge frequency (for instance 1
streamer/minute) can be used. Most experiments were carried
out in the frequency range 10
-1
< F< 10
2
in order to limit both
the duration of experiments, and the degradation of oil at very
high discharge rates.
10
-2
10
-1
10
0
10
1
10
2
10
3
10
4
50 150 250 350 450
Crest voltage (kV)
Streamer inception frequency F (minute
-1
)
r
p
=0.5mm
r
p
=1mm r
p
=2.5mm
r
p
=5mm
r
p
=10mm
r
p
=10μm
Figure 3: Streamer inception frequency versus voltage with different electrode
radius r
p
(40 cm gap distance, open dots: negative streamers, full dots: positive
streamers).
10
-2
10
-1
10
0
10
1
10
2
10
3
10
4
10
-1
10
0
10
1
40cm -
30cm -
20cm -
10cm -
5cm -
Streamer inception frequency F (minute
-1
)
calculated tip field (MV/cm)
10μm
40μm
0.3mm
1mm
2.5mm
8mm
Figure 4: Streamer inception frequency versus calculated maximum field, with
different electrode radius r
p
and distances d (open dots: negative streamers, full
dots: positive streamers).
Figure 3 obtained with the same oil sample shows the
variation of discharge frequency when the rod (or point) radius
is changed. All plots show an exponential increase of inception
frequency. With large rods, the number of positive streamers
becomes slightly higher than negatives, whereas the opposite is
seen with sharp points.
Figure 4 shows the same results plotted versus the
maximum field calculated at the extremity of rods (or points)
by finite elements method. It is very interesting to observe that
all measurements carried out with a fixed radius r
p
at different
distances d (5 to 40cm) group together to form a unique plot.
This shows that the maximum field is a good parameter to
describe streamer initiation in such geometry. This figure also
shows an exponential increase with the same slope whatever
the radius r
p
, and this tends to prove that the initiation process
is the same in all cases. However, the plots corresponding to
different radii r
p
do not group together, and this shows that a
single field value does not exist to describe streamer initiation
in all cases. Conversely, plots are widely shifted: at a fixed
inception frequency, calculated fields are nearly x100 higher
with a 10μm point compared to 8mm rod.
IV. I
NFLUENCE OF PARTICLES AND WATER
The influence of cellulose particles was studied by adding
increasing amounts of a concentrated solution to well filtered
oil. This concentrated solution was prepared with particles
obtained by de-structuring transformer pressboard. Fig. 5
shows the measured inception frequency measured with either
a sharp point (r
p
= 40 μm) or large rod (r
p
= 10 mm), versus
cellulose concentration in oil with 35 ppm water.
10
-2
10
-1
10
0
10
1
10
2
0 100 200 300 400 500
Filtered oil
2mg/l cellulose
13mg/l cellulose
25mg/l cellulose
Streamer inception frequency F (minute
-1
)
Crest voltage (kV)
Figure 5: Streamer inception frequency versus voltage with two different
electrodes (r
p
= 40 μm and 10 mm), and different cellulose quantity added to
filtered oil (40 cm gap distance, 35 ppm water).
This figure shows a quite different behavior with both
electrodes. With the large rod, a large increase of streamer
inception frequency is seen. The voltage corresponding to a
fixed frequency (for instance 1 streamer/minute) is nearly
divided by two between filtered oil, and oil with 25mg/liter
Tổng hợp các bài báo khoa học giai đoạn 2007-2012
Bộ môn Hệ thống điện - Đại học Bách Khoa Hà Nội
10
eBook for You
cellulose. The effect is very important in this experiment, since
both the cellulose and water content are large. On the other
hand, nearly no variation is seen with the sharp point. Similar
results are seen on figure 6, were the voltage corresponding to
F = 1 streamer /minute shows a very small variation with r
p
=
10 μm, and much larger with r
p
= 8mm. Figure 6 also shows
the combined effects of cellulose and water. These experiments
show that solid particles (hydrated cellulose) are of primary
importance for the triggering of streamers when the field is low
(large rods), whereas the very high field created by sharp tips is
sufficient to directly induce streamers.
a)
0
100
200
300
400
500
0 5 10 15 20 25 30
voltage (kV) @ 1 streamer/minute
r
p
=8mm
17 ppm
35 ppm
b)
0
50
100
1
5
0
0 5 10 15 20 25 30
g( )@
cellulose content (mg/l)
r
p
=10μm
17 ppm
35 ppm
Figure 6. Voltage @ 1 streamer/minute versus cellulose and water content,
with two different electrodes: a) r
p
= 8 mm , b) r
p
= 10 μm (40 cm gap).
The results are summarized on figure 7, showing the
calculated field at F =10 streamer/minute versus electrode size.
On this figure, we have also plotted initiation fields measured
under impulse voltage in the same mineral oil [5]. The same
overall tendency is observed with ac and impulses: decrease of
initiation field when the electrode size is increased. Two main
zones can be seen on figure 7.
In zone I (large rods, r
p
> 0.5mm), the initiation field under
ac is about half the value measured with impulses. This is quite
logical since the duration of voltage application is much longer
with ac. Adding particles further decrease the value under ac.
When the electrode size is increased, the initiation field under
ac decreases in a similar way as with impulses. With impulses,
this effect was mainly attributed to a “surface” effect, since
particles have a negligible influence. This shows that in this
zone, all mechanisms able to degrade the liquid properties
superpose under ac: time, pollution, electrode size. This is
consistent with observations made for a long time in practical
applications of liquids. In zone II (points, r
p
< 0.5mm), the
slope of the plot changes, and the calculated initiation field
becomes much higher than with impulses. This effect is
certainly due to the large influence of injected space charges
under ac, when the calculated tip field exceeds ≈ 1MV/cm. In
similar conditions, measurements under impulses are not
affected by space charges. Since field calculations are carried
out without space charges in figure 7, this means that the
calculated values with ac are certainly strongly overestimated
compared to the field actually present at the electrode
extremity.
10
-2
10
-1
10
0
10
1
10
-3
10
-2
10
-1
10
0
10
1
Filtered oil (17 ppm)
+ 25 mg/l cellulose
Initiation field @ 10 streamer/minute (MV/cm)
Electrode radius of curvature (mm)
impulse voltage
I
II
Figure 7. Calculated tip field @ 10 streamer/minute versus electrode radius,
for filtered oil and 25mg/l cellulose (17 ppm water).
V. C
ONCLUSIONS
The experiments presented here show the stochastic
character of streamer inception under ac, influenced by the
presence of particles and water. The inception probability
increases exponentially versus voltage, and no “inception
threshold” can be observed. Injected space charges
considerably influence experiments with divergent fields, when
the local field exceeds≈ 1MV/cm. The results obtained in such
conditions are not relevant of practical applications such as
transformers, in which the effect of space charge is mostly
absent. If liquids are compared by measuring partial discharges
with sharp points under ac, it is impossible to know which
property of the liquid (discharge inception properties or ability
to inject space charges) is revealed by the measurement.
R
EFERENCES
[1] W. R. Wilson, A. L. Streater and E. J. Tuohy, "Application of Volume
Theory of Dielectric Strength to Oil Circuit Breakers" AIEE, Trans. on
Power App., 1955, pp 677-688.
[2] N. Giao Trinh, C. Vincent and J. Régis, “Statistical Dielectric
Degradation of Large-Volume Oil-Insulation”, IEEE Trans. PAS,
Vol.101, n°10, 1982, pp 3712-3721.
[3] T.V. Oommen, E.M. Petrie, “Particle Contamination Levels in Oil-Filled
Large Power Transformers” IEEE Trans. PAS, vol. 102, 1983, pp 1459-
1465.
[4] K. Miners, “Particle and Moisture Effect on Dielectric Strength of
Transformer Oil Using VDE Electrodes”, IEEE Trans.PAS, vol.101,
1982, pp 751-756.
[5] O. Lesaint and T.V. Top, "Streamer initiation in mineral oil. Part I:
Electrode surface effect under impulse voltage", IEEE Trans. on DEI,
Vol.9, pp.84-91, 2002. Part II: Influence of a metallic protrusion on a
flat electrode", IEEE Trans. on DEI, Vol.9, pp.92-96, 2002.
Tổng hợp các bài báo khoa học giai đoạn 2007-2012
Bộ môn Hệ thống điện - Đại học Bách Khoa Hà Nội
11
eBook for You
Tổng hợp các bài báo khoa học giai đoạn 2007-2012
Bộ môn Hệ thống điện - Đại học Bách Khoa Hà Nội
12
eBook for You
EMTP Simulation of Induced Overvoltage in Low
Voltage System
Thinh Pham
Institute of Material Science
University of Connecticut
Storrs, CT 06269, USA
Email:
Nhung Pham and Top V. Tran
Department of Power Systems
Hanoi University of Technology
1- Dai Co Viet Street, Hanoi, Vietnam
Email:
Abstract—Shielded by high structure surrounding and with short
length of power line, low voltage system is seldom suffered from
direct strokes. However, this system is especially threatened by
induced voltage due to nearby strokes. The effects of induced
overvoltage may be very harmful to power quality and to low
BIL peculiar to electrical equipment in low voltage system.
In this work, the induced overvoltage in a typical low voltage
system in rural areas of Vietnam will be investigated by
EMTP/ATP simulation. Rusk model is used to simulate the
current source affecting the low voltage system. The influence of
grounding resistance in consumer side and the size of load will be
analyzed. The discussion and results may provide useful
information in insulation coordination of low voltage system.
Keywords-low voltage system; induced lightning; Rusk’s theory,
ATP/EMTP simulation
I. INTRODUCTION
The limited height of low voltage distribution system
makes it more prone to nearby lightning than direct lightning.
Induced lightning causes overvoltage on insulation, which is
usually designed with low BIL, and harms electrical and
electronic devices of such a system. In Vietnam, most of
electricity consumers locate in rural areas where distribution
network mainly uses overhead line. Furthermore, the distance
between distribution transformer and consumer in those areas
may range from several hundred meters up to kilometers. As a
result, low voltage system in the areas is especially threatened
by overvoltage due to induced lightning.
Among other theories involved in calculating induced
voltage [1-4], Rusk model [5] is widely used for its easy
handling by analytical formulations [6,7]. In this paper,
induced overvoltage in a typical TN low voltage system in rural
areas of Vietnam was simulated in the ATP/EMTP transient
program using Rusk method. The effects of grounding
resistance and load size were also analyzed and discussed.
II. R
USK MODEL
Lightning induced voltage on the transmission line
proposed by Rusk is based on the following assumptions:
• The return stroke current has the shape of step-function
with the maximum value I
0
, which propagates along
the lightning channel with a constant velocity ν.
• This return stroke generates an electric field which is
given by:
() ()
tzrA
t
tzrtzre ,,,,),,(
→→→
∂
∂
−∇−=
φ
(1)
where: φ is the scalar potential,
ܣ
Ԧ
is the vector potential, t
is time, r and z are calculated points in cylinder coordinate.
•
This electric field couples with the transmission
line and generates a total induced voltage u(x,t):
dz
h
t
tzx
z
A
txutxu
∂
∂
+=
0
),,(
),(),(
φ
(2)
where: h is the height of the conductor, u
φ
(x,t) is the
induced voltage in the transmission line due to the scalar
potential, A
z
is the vertical component of the vector
potential. Those parameters are derived from the
transmission line equations:
0
),(
).,(
),(
=
∂
∂
++
∂
∂
t
txi
LRtxi
x
txu
φ
(3)
t
thx
C
t
txu
C
x
txi
∂
∂
=
∂
∂
+
∂
∂ ),,(),(),(
φ
φ
(4)
where R, L and C are the corresponding resistance,
inductance and capacitance per unit length of the
transmission line; i(x,t) is the current which goes through
the line.
The induced voltage in the line could be considered as the
injecting of two current sources, the first one I
e
(x,t) is due
induced voltage due to scalar potential u
φ
and the second one
I
v
(x,t) is due to vector potential A. These current sources are
defined as [5,7,9]:
x
t
tx
c
vZ
tx
e
I Δ
∂
∂
=
),(1
),(
φ
(5)
t
txA
ztx
v
I
∂
∂
=
),(
),(
(6)
where Z is the surge impedance of the line, Δx is the line
section to be divided for the computation.
978-1-4244-6301-5/10/$26.00 @2010 IEEE
Tổng hợp các bài báo khoa học giai đoạn 2007-2012
Bộ môn Hệ thống điện - Đại học Bách Khoa Hà Nội
13
eBook for You
As the scalar potential and vector potential are derived from
e(r,z,t) (equation 1), which is originated from the velocity of
return stroke current ν and the charge distribution q
0
of the
lightning channel, after some mathematical manipulations
equation 5 and 6 became:
() ()
x
r
zvt
r
zvt
c
Z
q
txI
e
Δ
++
+
+−
= .
2
2
1
2
2
1
0
4
0
),(
γγ
πε
(7)
() ()
++
+
+−
−=
2
2
1
2
2
1
4
),(
00
γγ
π
νμ
r
zvt
r
zvt
Iz
tx
v
I
(8)
Where r is the distance between the stricken point and the
conductor, İ
0
and μ
0
are dielectric constant and magnetic
constant of the air,
ߛൌ
ଵ
ඥ
ଵି
ሺ
௩Ȁ
ሻ
మ
with c is the speed of light.
The injected current sources are connected to the line as shown
in figure 1 [7].
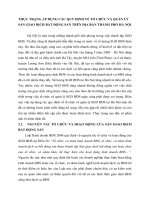
Figure 1. Injected current sources in the EMTP simulation for 1 of
two conductors (phase or neutral) [7]
III. SIMULATION
A. System configuration
A typical section of 0.4kV distribution line in rural area of
Vietnam as shown in figure 2 was chosen to investigate. The
system consists of 3 phase conductors and 1 neutral conductor
which are horizontally held at 6.5m above the ideal conducting
ground plane. The velocity of return stroke current is 100m/μs.
A distribution transformer delta-grounded wye 22/0.4kV
was used. The neutral conductor is commonly grounded with
the neutral point of distribution transformer through a
resistance of 2. In this TN system, the load is typically
grounded through a resistance of 50 (figure 3).
B. Modeling method
• Distribution line: A length of 700m of single
phase of the line was simulated. In order to
simulate the maximum induced overvoltage
across the load (between phase and neutral), the
latter is powered by phase A and N (figure 3).
Coupling effect from other phase conductor was
neglected for the sake of simplicity. The line is
assumed to be lossless for the worst case.
Lighting flashes to a point on the ground in the
vicinity of phase A. The line was divided into 10
sections of 70m.
•
Load: An inductance was used to model the
induced-lightning response of the load, as
recommended in [8] for TN configuration. The
value of this representative inductance depends on
the load size, which varies from 2μH to 10μH.
•
Distribution transformer: As the neutral of low
voltage winding of the transformer is directly
grounded, the transformer is represented by a
small inductance which is empirically determined
by [8]:
ܮ ൌ ʹͷǤͻߤܪ ൈ൬
ܵ
ܷ
ൈ
ʹ͵ͷܸ
ͷͲܸ݇ܣ
൰
ିǤହସଶ
where S and U are the rated power and rated
voltage of the distribution transformer. In this
case, S=160kVA, U=380V and L=17.89μH.
N
P
Flashin
g
p
oint
x
100m
280m
700m
y
1,05
m
P
N
2
R
L
Load
22/0,4
0.35m
C
B
A
N
h = 6.5m
1.05m
Figure 2. Configuration of a typical low voltage system
Figure 3. A phase in low voltage system to be simulated and the
position of the flashing point (right: distribution transformer, left:
load
)
Tổng hợp các bài báo khoa học giai đoạn 2007-2012
Bộ môn Hệ thống điện - Đại học Bách Khoa Hà Nội
14
eBook for You
• Current sources: Integrated simulation language
MODEL was used to simulate the current sources
Ie and Iv as described in section II.
C. Simulation result
1) Voltage profile along the line
Figure 4. Induced voltage in phase and neutral conductors at
transformer side and load side
A very high value of induced voltage (~50kV) was
observed at the position of the load, on the phase conductor and
neutral conductor. Low grounding impedance of the
transformer substantially decreased the induced voltage on
phase and neutral conductor. Although the transformer locates
closer to the flashing point than the load, the induced voltage
on phase and neutral conductors at transformer position
(TRANSP and TRANSN) is much lower than that at the load
position.
Figure 5. Induced voltage across the load and the transformer
However, the low grounding impedance had a serious
influence on the induced voltage across the transformer. With
I
0
=10kA, the peak induced voltage across the transformer
(v:TRANSP-TRANSN) is about 35kV, nearly three times
higher than that across the load (v:LOADP-LOADN) as shown
in figure 5.
2) Influence of grounding resistance of the load
The simulation was performed on the load of small size
(L=10μH) with three values of grounding resistance of the
load: R=20, R=40 and R=60, which correspond to
different value of soil resistivity of rural areas.
Figure 6. Dependency of induced voltage across the load on
grounding resistance of the load
Figure 7. Dependency of induced voltage across the transformer on
grounding resistance of the load
It was observed that the more the value of grounding
impedance is, the less the induced voltage stresses across the
load (figure 6). The voltage behavior is similar to the case of
the transformer, as the low grounding impedance decreased
the induced voltage on neutral phase but gave rise to the
potential difference between phase and neutral conductors.
However, the grounding resistance of the load did not have
any influence on the induced voltage across the transformer
(figure 7)
3) Influence of the size of the load
In order to investigate the influence of the load on the
induced voltage, the load size was changed from small size
(L=10μH) to large size (2μH) according to [8]. The
computation was performed with grounding resistance of the
load R=40 ȍ and plotted in figure 8.
Figure 8. Dependency of induced voltage across the load on the size
of load
Tổng hợp các bài báo khoa học giai đoạn 2007-2012
Bộ môn Hệ thống điện - Đại học Bách Khoa Hà Nội
15
eBook for You
Figure 9. Dependency of induced voltage across the transformer on
the size of load
The same voltage behavior across the transformer was
observed as the previous case in which different grounding
resistances of load were accounted (figure 8). The induced
voltage across the transformer was independent of the load
size, and remained at very high value due to low grounding
impedance of the transformer. Larger size of load decreased
induced voltage on it as increasing the grounding resistance of
the load (figure 9). The effect of load size, which is
comparable to that of grounding resistance of the load,
suggested that co-ordination of those two factors may provide
an optimal protection against hazard and induced lightning.
IV.
CONCLUSION
Lighting induced voltage results in harmful effects low
voltage system, on both sides of distribution transformer and of
load. The induced voltage on phase conductor is estimated to
be about 40kV for a typical value of lightning current 10kA,
this voltage value is well above the BIL of any equipment in
low voltage system. The induced voltage on neutral conductor
greatly depends on the value of grounding resistance.
Therefore, induced voltage across the equipment in question
greatly depends on the value of resistance that it is grounded
through. As the regulation of electric utilities, the grounding
impedance of distribution transformer is maintained at low
value (typically from 2ȍ to 5ȍ) for the purpose of correct
operation, this value increases the harmful effect of induced
lightning on transformer. Overvoltage due to induced lighting
on the load depends on its size and the value of grounding
resistance. Co-ordination between these parameters may fulfill
both requirements of safety and of protection against induced
lightning.
A
CKNOWLEDGMENT
This article was funded in part by a grant from the Vietnam
Education Foundation (VEF). The opinions, findings, and
conclusions stated herein are those of the authors and do not
necessarily reflect those of VEF.
R
EFERENCES
[1] C. Taylor, R. Satterwhite and C. Jr. Harrison, ‘‘The response of a
terminated two-wire transmission line excited by a nonuniform
electromagnetic field’’, IEEE Trans. on Antennas and Propagation,
vol.13, no.6, November 1965.
[2] A. Agrawal, A, H. Price and S. Gurbaxani, ‘‘Transient response of
multiconductor transmission lines excited by a nonuniform
electromagnetic field’’, Antennas and Propagation Society International
Symposium, vol.18, June 1980.
[3] F. Rachidi, ‘‘Formulation of the field-to-transmission line coupling
equations in terms of magnetic excitation field’’, IEEE Transaction of
Electromagnetic Compatibility, Vol. 35.,no. 3, August 1993.
[4] P. Chowduri and E.T.B. Gross, ‘‘Voltage surges induced on overhead
lines by lightning strokes’’, Proc. IEE, Vol. 114, no.12, December 1967.
[5] S. Rusk,
Induced lightning overvoltages on power transmission lines
with special reference to the over-voltage protection of low voltage
networks
, Royal Institute of Technology, PhD Thesis, Stockhom 1957.
[6] H. K. Hoidalen, ‘‘Calculation of lightning overvoltages using
MODELS’’, International Conference on Power Systems Transients
(IPST), Budapest, June 20-24, 1999.
[7] A. E. A. Araujo, J. O. S. Paulino, J. P. Silva, H. W. Dommel,
« Calculation of lightning induced voltages with Rusk’s method in
EMTP. Part I: Comparison with measurements and Agrawal’s coupling
model’’, Electrical Power System Research , vol. 60, 2001.
[8] H. K. Hoidalen, ‘‘Lightning induced voltages systems and its
dependency on overhead line termination’’, Internationl Conference on
Lightning Protection (ICLP), Birmingham, September 14-18, 1998.
[9] J. G. Anderson and T. A. Short, ‘‘Algorithms for calculation of lightning
induced voltages on distribution lines’’, IEEE Trans. on Power Delivery,
vol. 8, no. 3, July 1993.
Tổng hợp các bài báo khoa học giai đoạn 2007-2012
Bộ môn Hệ thống điện - Đại học Bách Khoa Hà Nội
16
eBook for You
Proceedings of 2008 International Symposium on Electrical Insulating
Materials, September 7-11, 2008, Yokkaichi, Mie, Japan
Electrical Field Behavior of Transmission Line Insulators in Polluted Area
T. Pham Hong * and Tran Van Top
Department of Power System, Faculty of Electrical Engineering, Hanoi University of Technology (HUT)
1, Dai Co Viet Street, Hanoi, Vietnam
* E-mail :
Abstract: Finite element method (FEM) was used to
study the electric field distribution along creepage path
of a cap and pin porcelain insulator string of
transmission line. The effect of pollution layer
conductivity and dry band width is considered in order
to investigate electric field behaviors of insulator using
in polluted areas.
INTRODUCTION
Although the use of silicone rubber composite
insulators has been increased significantly in recent
years, porcelain and glass insulators are still
manufactured and remain predominant in distribution
and transmission lines of Vietnam. Except for
hydrophilic property, porcelain and glass insulators are
widely used because they offer many advantages: low
cost, flexible maintenance and high strength. When
energized in polluted area such as coal industry zone
and coastal area, the insulators are easily contaminated
[1], dry band will be formed and leading to flashover
[2].
Pollution
26%
Lightning
71%
Other
3%
Pollution
33%
Lightning
18%
Other
49%
Figure 1: Service interruption of some 110 kV transmission
lines in Vietnam due to pollution flashover in 2004: in Quang
Ninh province (left side), in 12 coastal provinces of the
central Vietnam (right side)
Exploring 7 million tones of coal per year, Quang Ninh-
a northern province of Vietnam faces not only
environment problem arising from coal dust but also the
outages of power distribution and transmission lines.
Field data has recorded about 20% outages in 110kV
transmission line of Quang Ninh province is due to
flashover [3]. Power Company 3 which manages
transmission network of 12 coastal provinces in the
central Vietnam has reported that 33% of service
interruption is also due to flashover [4] (Figure 1).
The paper presents the results of finite element (FE)
calculation of the electrical field distribution along a
string of cap and pin porcelain insulator using in current
transmission lines in Vietnam. Pollution level and dry
band width are varied in order to investigate their
effects on field distribution along the creepage path.
The results will be a good indication for designing
insulator, especially for polluted areas.
INSULATOR TO BE MODELED
Porcelain insulator type ɉɎ-425 in this study is widely
used 35kV distribution networks, 110kV and 220kV
transmission lines in Vietnam. The number of unit per
insulator string depends on rating voltages and
operating environment, e.g: the number of units per
string of 35kV distribution network is varied from 2 to
4 while 7 or more are usually used in 110kV
transmission networks. Figure 2 shows the detailed
geometry dimension of a porcelain insulator. The cap
and pin are made of steel and they are embedded in
mortar layers in order to fix with porcelain shell. The
shell is made porcelain with a relative permittivity of 6
and a conductivity of 2.10
-13
S.m
-1
. The creepage length
of porcelain shell is 280mm. Commercially available FE
software ANSYS are used for calculation. The
modeling is carried out with a typical insulator string
used in a typical 110kV transmission line, which
consists of 7 insulators without corona ring. The unit is
numbered from the line to ground with unit 1
corresponding to that close to live-line-end and the unit
7 is close to ground-fitting-end. Static analysis are
performed at steady state condition at f=50Hz. An AC
voltage of 110kV is applied to the whole string.
Figure 2: Geometry dimension of a typical transmission
line insulator used in the calculation
The conductivity of pollution layers are selected in
accordance with IEC 60815. In this study, the
calculation is performed with pollution conductivity
varying from ı=8ȝS to ı=20ȝS which correspond to
medium and heavy pollution levels. Morever, the effect
of mortar layers is neglected in the model.
RESULTS AND DISCUSSION
Potential and electric field distribution in clean
EB-5
−530−
Tổng hợp các bài báo khoa học giai đoạn 2007-2012
Bộ môn Hệ thống điện - Đại học Bách Khoa Hà Nội
17
eBook for You
insulator string
Figure 3: Equipotential distribution along a clean string
Figure 4: Electric field distribution along a clean string
The calculation is firstly performed with a clean
insulator string. Figure 3 shows the equipotential lines
for the clean string. Potential is distributed along the
string in accordance with the capacitance of each unit
and the stray capacitance to line and to ground. The
potential distribution is found to be maximum in the
unit 1 (near the live-end-fitting) with 18% of total
voltage applied on the string, whereas 13.5% is found in
the unit 7 (near ground-end-fitting) and minimum
potential distribution is found in the unit 5 (12%). These
behaviours are well correlated with the results of
practical field measurements on a test string using a
horizontal sphere gap in the Laboratory for High
Voltage Engineering and Electrotechnical Material at
Department of Power System.
As shown in the figure 4, electric field intensifies as far
from the ground-fitting-end and reaches the highest
Figure 5: Electric field stress along creepage path of unit 1 in
clean string
Figure 6: Electric field stress along creepage path of unit 2 in
clean string
values toward live-line-fitting. Figure 5 depicted the
field strength magnitude along the creepage path of the
unit 1. In reality, field strength along the creepage path
of each unit follows the same trend, high values appear
in the triple junction region (air-cap-porcelain),
live-end-fitting, and near the sections with small radius
of curvature. In the unit 1, the stress in the triple
junction and live-line-fitting take the same value of
2.2kV/mm. However, the highest stress of the string is
reached in the air-cap-porcelain region of the unit 2
(Figure 6). It is observed that the stress in this region is
slitghtly higher that of unit 1 with 2.5kV/mm, but this
value is still beyond that needed for corona discharge.
−531−
Tổng hợp các bài báo khoa học giai đoạn 2007-2012
Bộ môn Hệ thống điện - Đại học Bách Khoa Hà Nội
18
eBook for You
Influence of pollution layer
Figure 7: Modeling of electric field in presence of pollution
layers next to metal cap
A pollution layer with 14.5PS and 25% of upper surface
length (27.5mm) is deposited on each unit (Figure 7). In
this case, the stress distribution is predomenantly
controlled by the conductivity of pollution layer instead
of capacitance distribution like in clean surface case [6].
In this case the electrical stress are “put” from triple
junction region to the pollution layer ends in every unit,
the highest stress is “transferred” from the triple
junction of unit 2 to unit 1 (Figure 8) and remains the
same value as in the clean case (|2.5kV/mm). However
the region in which the highest stress appears is
displayed toward the pollution layer end and this value
is still well beyond that can lead to partial discharge in
the air.
Figure 8: Electric field stress along creepage path of unit 1 in
presence of pollution layer of 14.5PS
For other units, the presence of pollution layer reduced
the maximum stress near the cap and tends to linearize
the field distribution along the creepage path. As an
exemple, the magnitude of electric field strength along
creepage path in the unit 2 is depicted in the figure 9. It
is observed that the electric field is more evenly
distributed along the creepage path in comparison with
the clean case (Figure 6). The highest stress in the unit 2
is reduced from 2.5kV/mm to 1.2kV/mm and is
transferred from air-cap-porcelain to the pollution layer
end and pin-fitting regions. From the point of view of
field distribution, the presence of pollution layer plays a
positive role in linearizing the field along the insulator
string.
Figure 9: Electric field strength magnitude along creepage
path of unit 2 in presence of pollution layer of 14.5PS
Influence of pollution layer conductivity
Because the presence of pollution layer had negligeble
effect on field distribution in others unit, only the unit 1
is analysed to study the influence of pollution layer
conductivity. Using the same geometry of pollution
layer as the previous case (with 25% of upper surface
length), the influence of pollution conductivity is
studied by performing calculation with different
pollution levels: ı=8ȝS, ı=14.5 ȝS and ı=20ȝS. The
electric field magnitudes at air-cap-porcelain (cap),
pollution layer end (PL end) and live-end-fitting (pin)
are plotted in the figure 10. It is clear that the stress in
cap region decreases with the conductivity, while the
electric field in pollution layer ends and live-end-fitting
regions slightly increases versus the conductivity.
However, the stress in these regions is still inferior to
3kV/mm. As a result, the pollution flashover could not
occur even in presence of heavy pollution level.
0
750
1500
2250
3000
0 8 14.5 20
conductivity (ȝS)
E(V/mm)
cap PL end pin
Figure 10: Influence of pollution layer conductivity on
electric field stress
Influence of dry band width
−532−
Tổng hợp các bài báo khoa học giai đoạn 2007-2012
Bộ môn Hệ thống điện - Đại học Bách Khoa Hà Nội
19
eBook for You
As mentionned in introduction paragraph, the flashover
in polluted insulator are initiated by the formation of
one (or more) dry band. In order to study the influence
of dry band on electric field distribution, the calculation
has been performed with a dry band inside pollution
layer of 8PS. A pollution layer with 50% of upper
surface length is deposited on each unit, a dry band
width ranging from 0 to 1mm is created in the middle of
the pollution layer. The stress distribution along
creepage path of unit 1 is depicted in the figure 11 with
a dry band of 0.25mm. It is clear that the maximum
strength of 6.5kV/mm appears near the dry band and
increases threefold in comparison with clean case. The
highest stress value decreases with the dry band length,
but the stress at dry band are always dominant in
comparison with other regions such as pin-fitting or
pollution layer ends (Figure 12). This indicates that
when a dry band forms inside the pollution layer, partial
discharge could begin from these points and leads to
flashover.
Figure 11: Electric field stress along creepage path of unit 1
in presence of a dry band of 0.25mm in the middle of
pollution layer
0
2000
4000
6000
8000
0 0.25 0.5 1
bandgap length (mm)
E(V/mm)
cap bandgap PL end pin
Figure 12: Electric field stress in different position of
creepage path versus dry band length.
Some pictures taken during performing measurement in
the laboratory are shown in the figure 13. Increasing the
applied voltage will lead to flashover which initiates
from the dry band, live-end-fitting and the small
curvature regions. These behaviors are well correlated
with the results predicted by the simulation in the
previous paragraph.
Figure 13: Flashover process from live-end-fitting and
small curvature of a polluted insulator (from left to right)
CONCLUSION
The presence of a pollution layer on upper surface of
insulator strongly modified the field distribution along
creepage path. With a homogenous pollution layer
deposited on each unit, the live-fitting-end region of
unit 1 submits the highest stress, but the magnitude of
electric field is similar to that in clean case. In presence
of a dry band in the middle of pollution layer, the stress
reaches maximum value in the dry band and exceeds the
breakdown strength of air. Flashover can occur from
this points and were observed by field measurements.
ACKNOWLEDGMENT
Center for Development and Application of Software
for Industry (DASI) at HUT is gratefully acknowledged
for its help during this study.
REFERENCES
[1] J. S. T. Looms, Insulators for high voltages, Peter
Peregrinus Ltd, 1988
[2] David D. Jolly, "Contamination Flashover Theory and
Insulator Design", Journal of The Franklin Institute,Vol. 294,
No.6, December 1972.
[3] Do Khanh Ninh, “Influence of polluted environment on
the performance of glass insulators using in 110kV network of
Quang Ninh province”, Master thesis of Hanoi University of
Technology, 2006
[4] Le Thanh Giang and Nguyen Quoc Viet, “Modeling of
field distribution along a set of insulators”, Conference on
student research, Hanoi University of Technology, 2007
[5] Vosloo W. L. and Holtzhausen J. P., “The electric field of
polluted insulators”, Africon
−533−
Tổng hợp các bài báo khoa học giai đoạn 2007-2012
Bộ môn Hệ thống điện - Đại học Bách Khoa Hà Nội
20
eBook for You
Tổng hợp các bài báo khoa học giai đoạn 2007-2012
Bộ môn Hệ thống điện - Đại học Bách Khoa Hà Nội
21
eBook for You
Tổng hợp các bài báo khoa học giai đoạn 2007-2012
Bộ môn Hệ thống điện - Đại học Bách Khoa Hà Nội
22
eBook for You
Tổng hợp các bài báo khoa học giai đoạn 2007-2012
Bộ môn Hệ thống điện - Đại học Bách Khoa Hà Nội
23
eBook for You
Tổng hợp các bài báo khoa học giai đoạn 2007-2012
Bộ môn Hệ thống điện - Đại học Bách Khoa Hà Nội
24
eBook for You