phát triển năng lực suy luận thống kê cho sinh viên cao đẳng chuyên nghiệp bản tóm tắt tiếng anh
Bạn đang xem bản rút gọn của tài liệu. Xem và tải ngay bản đầy đủ của tài liệu tại đây (265.31 KB, 24 trang )
1
INTRODUCTION
1. The reason for selecting topics
1.1 The role of statistics
Statistics is becoming increasingly important in the social life. Statistics provides
information on the development of economy and society in future of the country and in
relation to the outside world. The statistical information is extremely necessary, is the
premise to help state lead and direct the economy, making basis to plan policies of
developing the economy and society. Moreover, it is also a sharp and effective tool to
know the society.
Statistical science not only is a tool to manage, reflect the having things but also
the tool to predict, forecast situation, development trend of economic - social phenomena
in future. This is one of the important characteristics of the information of economy and
society, it both ensures high reliability, great persuasion helping managers solve practical
problems effectively.
1.2 Characteristic of professional college students
1.3 The position, role and meaning of the statistics course in training professional
college students
Statistics have a position, an important role in training professional college
students. It not only provides, equip for students initial skills of collecting and processing
of statistical data but also the knowledge base to help students learn speciality basic
subjects better and really useful for them to finish professional tasks later.
On the other hand, any parts of college training curriculum have a function to go
through the characteristics of each module, coordinate with the other modules, and other
activities to educate the all - sided development for students. So, the statistic module
besides the purposes of equipping statistical knowledge has important task to develop
intellectual capability for students.
1.4 The requires of real life
We are living in the age of "information explosion", we can say that statistical
information is "surrounding" us from many directions and becoming "overflowing" in
every citizen’s life. To be able to receive and process a huge volume of information,
every citizen needs to have choosing capabilities, judgment, analysis to draw useful
conclusions for the needs of the job of himself as well as the business. In 1991, Raja Roy
Singh asserted: "To meet the new requirements set out for the explosion of knowledge
and the creation of new knowledge, it needs to develop the capability of thinking,
problem-solving capability and creativity The capabilities can be brief about the
problem-solving capability" [99].
Many businesses now require their employees to have quantitative reasoning skills,
statistical reasoning skills to solve flexibly problems in life, in the process of labor and
in the production and business. This demand is gradually becoming a trend, a criteria to
appreciate students’ competence when graduating, it has put forward important and
heavy tasks for the education in the way of reforming methods of teaching and learning ,
2
to contribute the improvement of the quality of training, and tend to train
learners’capabilities .
1.5 Trends of renovation in teaching statistics
In recent years, many math educators in the world have called for innovation in
teaching statistics. They say that teaching statistics should focus on understanding of
statistics, statistical reasoning and statistical thinking, and it is considered as the purpose
of entire education, and necessary innovation in teaching statistics.
1.6 Identifying the topic of the thesis
To develop statistical reasoning capabilities, many maths educators have found the
ways to develop statistical reasoning, statistical thinking instead of teaching knowledge
alone. The purpose of modern mathematics education is to pay attention to the use more
data and concepts, reducing theory, and techniques to foster active learning aiming for
statistical reasoning. The research of the Thesis relies on teaching and learning statistics
in the College of Transport No II, Duy Tan University, Dong A University, Duc Tri
College in Danang city, which do not accelerate to be suitable for the situations as well as
the actual requirements. People know very little about professional college students how
to learn statistics how concepts are misunderstood, what is taught and how evaluation
has shown. The students who are able to apply statistical reasoning to resolve situations
related to future career are not noticed.
From the above reasons, we choose research topics: Developing statistical reasoning
capabilities for professional college students.
2. Research objectives
The purpose of the thesis is to find methods to develop statistical reasoning capability for
professional college students, thereby contributing to improve the quality of teaching
statistics and the quality of professional college workforce.
3. Research Tasks
To achieve the purpose of research, thesis perform the following tasks:
- Research on the theoretical basis of statistical reasoning, the characteristics and the
basic elements of statistical reasoning.
- Research some kinds of statistics reasoning that professional college students often use
to process data sets.
- Research on the theoretical basis of statistical reasoning capability of professional
colleges students.
- Research assessment methods of statistical reasoning capability of professional college
students in a reliable way.
- Research the approach in the teaching and some pedagogical methods to develope
statistical reasoning capability for professional college students.
- Pedagogical experiments to evaluate feasibility and results of the pedagogical measures
proposed.
4. Hypothesis
3
If clarifying the scientific basis of statistical science and statistical reasoning capacity,
we can propose pedagogical methods and use them suitably to develop statistical
reasoning capacity for students in professional colleges.
5. Object and scope of research
5.1 Research objects
- The process of teaching mathematics in the professional colleges.
- The task of developing intellectual capability for professional college students in
teaching mathematics.
5.2 Scope of research
- Thesis focuses on researching the process of teaching statistics in professional colleges
in economics and engineering.
- Thesis focuses on researching the task of developing statistical reasoning capability for
college students in economics and engineering.
- Object of practical survey is in some professional colleges in Danang city.
6. Research Methodology
6.1 Research theory
6.2 Investigate, observe
6.3 Pedagogical Experiment
7. The new features of the thesis and arguments given to support
7.1 New Features of the thesis
In terms of theory
- Clarifying the concept of statistical reasoning, the types of statistical reasoning that
college students need to be taught.
- Proposing the elements of statistical reasoning of professional college students .
- Proposing the frame of evaluating statistical reasoning capability of professional college
students.
- Building a number of measures to develop pedagogical statistical reasoning capability
for professional college students.
On a practical level
The results of research of the thesis will set up the basis to give out pedagogical
measures developing statistical reasoning capability for professional college students.
Students are able to apply the types of statistical reasoning to serve the basic and
specialized subjects, then resolving situations related to their careers after graduation as
well as the ability to deal with the problems they encounter in their real life. Thereby,
fostering critical thinking, judgment ability, critical as they face the data.
7.2 The arguments given to support
- It is necessary to develop statistical reasoning capability for professional college
students.
- The nature of the concept of statistical reasoning; characteristics of statistical reasoning;
the types of statistical reasoning that professional students need to be equipped and
developing; the elements of statistical reasoning capability and the frame of evaluating
statistical reasoning capability for professional college students.
4
- A number of pedagogical measures to to develop statistical reasoning capability for
professional college students.
8. Structure of thesis
Besides the introduction, conclusion and references, the lay-out of thesis is 4 chapters as
following:
Chapter 1 Overview of Research Issues
Chapter 2 Statistical reasoning and statistical reasoning capability of professional college
students
Chapter 3 A number of pedagogical measures to contribute to the development of
statistical reasoning capability for professional college students.
Chapter 4 Results pedagogical experiments.
Chapter 1 OVERVIEW OF RESEARCH ISSUES
1.1 About statistical science
1.1.1Development history of statistics
1.1.2 Statistical activities
1.2 A brief history of research problems
1.2.1 History of research on statistics literacy
1.2.2 History of research on statistical reasoning
1.2.3 History of research on statistical thinking
1.3 Conclusion chapter 1
Chapter 2 STATISTICAL REASONING AND STATISTICS REASONING
CAPABILITY OF PROFESSIONAL COLLEGE STUDENTS
2.1 The general concept of reasoning
2.2 The concept of statistical reasoning
Combining with the research and analysis in Section 1.1.2, we think that:
Statistical reasoning is reasoning based on statistical data to identify, explain, analyze
and make conclusions with significance statistical as well as to find out statistical rule
for the majority of the same type.
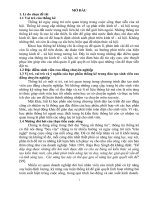
In our point of view, statistical reasoning is a multi-stage process, the connecting
stages having mutual relationships can be illustrated by the diagram 2.1.
Statistical situation thống
Reading and
understanding
tables, charts
Campare,
analysis
explain
Model of
Statistical
infomation
Take out conclusion
Solve problem
Check
Build hypothesis
5
2.3 Characteristics of statistical reasoning
Statistical reasoning always occurs in the context of the real world, depending on the
context and is affected opposite by the context to statistical reasoning.
Statistical reasoning has general in nature, broad language and occurs daily in all areas of
life activities. It is really necessary in state administration, the working life of all citizens
and businesses.
Based on rules of the majority, the results of statistical reasoning are exact. However,
these results are still meaningful in practical activities, if applied in certain conditions,
they can be still acceptable to give out correct actions.
2.4 The relationship between literacy, reasoning and statistical thinking
The diagram 2.2 following shows the relation between statistical literacy, statistical
reasoning and statistical thinking:
Diagram 2.2 The relationship between literacy, reasoning and statistical thinking
2.5 Some mathematical reasoning involved in the process of statistical reasoning
2.5.1 Deductive reasoning
2.5.2 Inductive reasoning
2.5.3 Reasoning rational, reasonable reasoning
2.6 Comparison of statistical reasoning and mathematical reasoning
In summary, there are many similar aspects of statistical reasoning and
mathematical reasoning. However, the requirements of each subject can create different
sources of errors in reasoning. Teaching both subjects can be led and facilitated by
context. In the practice of statistics, it depends on a lot of contexts of real-world but
practice of maths tends to be away from the real world context. The dependence on the
context of statistical reasoning can lead to mistakes in reasoning. Those mistakes are
difficult to overcome even for the good and experienced experts.
2.7 The model of developing statistical reasoning
2.7.1 The basis of modeling statistical reasoning development
Building the model of developing statistical reasoning, we base on the following basis: -
The process of statistics activity. - From cognitive development model of Biggs and
Collis [55], [63]. - From the basis of psychology and education.
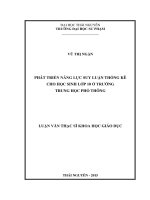
2.7.2 Model of developing statistical reasoning
Statistical calculating skill
Statisticalreasoning
Statistical
thinking
Statistical literacy
6
Among them:
2.7.2.1 Collect and describe data
There are two types of reasoning formation and developing through collection and
description of statistical data. We believe that reasoning from the data collection is
statistical reasoning relating to the preparation of tools, manpower and time appropriate
for each type of separate data collection activities. As about reasoning from a
representative sample is statistical reasoning that gives the way how to get the sample in
accordance with the probability and what can affect a sample; how to select a
representative sample or nonrepresentative for research objects, how to skepticize with
the conclusions drawn from small samples or bias.
2.7.2.2 Data Organization
Data collected through the survey is often raw. If we want to use the data, we must
rearrange the data. If students want to sort, categorize or summarize data, they must
distinguish whether the data is qualitative or quantitative, discrete or continuous, so that
it is possible to select the form of arrangement and suitable classification. Moreover,
students must understand the meaning of the statistics in the assessment of product
quality, in controlling experiments. This reasoning process appears in students’ data
activities , it relates directly to the raw data collected. We call this kind of reasoning
reasoning from data. Thus, the reasoning from the data is the statistical reasoning
concerning identification of the type of data of qualitative, discrete or continuous, and
the significance of the statistics gathered in estimating product quality or control.
2.7.2.3 Data Presentation
The process of presenting data includes the data display in the form of tables or graphs.
Showing data relating to the choice of representation for statistical data, this is tool to
structure the data. Statistical data presented in graphical form provide a visual image,
facinating the viewers and showing clear trends of phenomena. To do this, students must
know what type of data should be used with the most suitable type of chart. When
looking at the statistics graphs, students can understand and explain the statistical
significance, can determine the characteristic parameters This process reasoning is
Analysis data
Statistical reasoning
Describe data
Data Presentation
Data
Organization
Conclusions
Collect data
7
called reasoning from statistical data representation. So in our opinion, reasoning from
the statistical representation of data is the statistical reasoning concerning the meaning
of statistical graphs; choosing an appropriate type of graph to represent a kind of data,
understanding the way how to read and interpret a statistical graph; inferring the
random elements in a distribution to identify parameters with characteristic patterns.
The process of organizing and presenting data also form and develop aother kind of
reasoning. That is reasoning from characteristic parameters. Reasoning from the
characteristic parameters is a kind of statistical reasoning relating to understanding the
specific parameters and their implications for data collection; understanding the use of
the characteristic of large samples to predict more accurately than small samples;
knowing the specific parameters of the data set – it will be useful to compare with other
data sets.
2.7.2.4 Analysis, interpretation of data and conclusions
The process of analysis and interpretation of data is the most important and essential to
form statistical reasoning for subjects. This process includes the recognition of patterns,
trends of data and reasoning to give out predictions and conclusions from statistical data.
In the process of analyzing and interpreting data, it forms the kind of reasoning when
students test, evaluate and explain the relationship between two variables, know how to
define and explain the relationships, explain a two-way table when considering bilateral
relationship, grasp cause and effect relationship, reciprocal between two variables. The
reasoning process we call reasoning from combination of data. We believe that
reasoning from combination of data is the statistical reasoning concerning the
examination, evaluation and explaining the relationship between two variables; defining
and explaining the relationship, interpreting a two-way data table when considering the
causal relationship between the two variables.
All the process statistics from collecting, describing the data to analysing, interpreting to
conclusion, confirming the significance, students will realize that the conclusions are
probabilistic and uncertainty. From the sample, the representativeness of the sample, the
sample size, sampling method to analyze the overall conclusions. All this uncertainty
will directly affect the analysis to propose hypotheses, leading to statistical conclusions.
This process directly impacts on students' reasoning. We call this kind of reasoning
forming in an environment of uncertainty reasoning from the uncertainty. Reasoning
from the uncertainty is the statistical reasoning concerning understanding and use of the
ideas of chance, random, chance and uncertainty, giving out the assessment of the
uncertain facts; knowing all possibilities aren’t equal, using suitable methods to
consider the similarity of the various events .
2.7.3 The significance of the cognitive development models statistical
reasoning in teaching statistics
2.7.4 Some types of statistical reasoning that students need to be equipped
through teaching Statistics
2.7.4.1 Prediction statistics
a.The general concept of prediction
8
in our opinion, predicting is a form of thinking to reflect the thing, the phenomenon in the
future on the basis of the knowledge and experience.
b. Prediction method
We believe that there are many ways to predict, although whatever method is used, the
prediction will follow a common method described by the following diagram 2.4:
c. Statistical prediction:
In our research basing on professional students, they are learning maths statistics, as well
as in a number of majors learning statistical principles, sociological statistics, so we
consider statistical prediction is a form of thinking to reflect the thing, the phenomenon
in the future based on the statistics data and past experience.
Example 2.9 A company plans to introduce a new product to consumers in a residential
area with the population of 2.5 million people. Researching the market shows that in
1500 per 3500 people are willing to buy that product.
a. With 95% confidence, please predict the potential of the business.
b. Predict how many potential customers that the business will hope to get in new
markets are ?
2.7.4.2 Statistical deductive, statistical inductive
We know that the "law of the probability distribution of the sample statistics
reflects tight relationship between the parameters of the model with the corresponding
parameters of the overall studied" [46] so those statistical reasonings include the
participation of deductive reasoning and inductive reasoning. We call these two types of
statistical reasoning statistical deductive and statistical inductive. Thus, statistical
deductive is deducing about a part of the overall set of data based on the statistics of that
overall. In contrast, statistical inductive is deducing the whole based on the overall data
set, statistical indicate of a part of that overall.
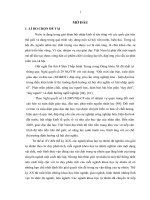
2.7.4.3 Some types of statistical reasoning need to equip for professional
college students
Ten types of statistical reasoning described by the following diagram 2.6:
1. Induction of the
individual case
Quy nạp từ những trường
2. To form a
hypothesis
3. Proof
hypothesis
4. New
Knowledge
9
2.7.5 Impact of statistical reasoning to professional college students
2.8 Statistical reasoning capability of professional students
2.8.1 The groups of statistical reasoning skills of professional students
Psychologists believe that, skills are understood in different ways. On the action side,
the skills are to understand the way of acting a certain action and achieve results. On the
second aspect, the skills are to understood to apply the knowledge, skill and experience to
proceed with certain actions. Since then, we believe that the statistical reasoning skills
are the ability to infer or perform an action resulting by selecting, applying statistical
knowledge and past experience to identify, explain, apply and draw statistical
conclusions from statistical data.
Based on the basis of psychology, education, and models developed statistical reasoning,
we split the statistical reasoning skills into skill groups corresponding to each type of
statistical reasoning needing to use in each stage of the development model of statistical
reasoning as following:
2.8.1.1 Group of statistical reasoning skills from data collection and describing
statistical data
Skill 1: Understanding what data can be collected andsuitable data collection forms
Skill 2: Identifying and making the decision which tools to use , manpower and time for
data collection.
Skill 3: Knowing how to take a representative sample and the influence on the overall
sample.
Skill 4: Reading raw data obtained through data collection
2.8.1.2 Group of statistical reasoning skills from organizational activities and
presentation of statistical data
CONCLUSION
Reasoning from
the uncertainty
ANALYSIS
DATA
COLLECT
DATA
DERCRIBE
DATA
PRESENTATION
DATA
ORGNIZATION
DATA
Reasoning from a
representative
sample
Reasoning
from data
Reasoning from
the resentation
Reasoning from
the characteristic
parameters
Reasoning
from
combination
of data
Reasoning
from the data
collection
Statistical
deductive
Statistical prediction
Statistical
inductive
10
Skill 5: Identifying data is qualitative or quantitative, discrete or continuous to choose
forms sorted, categorized appropriately.
Skill 6: Recognizing and understanding the significance of the statistics figures.
Skill 7: Modeling of statistical data to look for relationships and trends of the phenomena
studied.
Skill 8: Understanding and explaining appropriately the tables and statistical charts.
2.8.1.3 Group of statistical reasoning skills from the analysis, interpretation
and conclusion
Skill 9: Using inductive reasoning, deductive reasoning to draw conclusions.
Skill 10: Using of electronic devices to analyze data to draw conclusions with high
reliability.
Skill 11: Using basic statistical techniques to interpret or draw conclusions for the
whole.
Skill 12: Evaluating and drawing the correct, logical conclusions, from models of
statistical data.
Skill 13: Testing hypotheses based on controlling or statistical procedures.
Skill 14: Predicting statistics from the statistical data presented in the form of tables or
statistics graphs.
2.8.1.4 Group of skills to apply statistical reasoning in real life
Skill 15: Checking the validity of the issues related to statistics on the media or in the
practical activities.
Skill 16: Applying statistical reasoning and statistical knowledge to solve practical
problems of life related to statistics data.
2.8.2 Statistical reasoning capability
Capability in general and capability of the students in particular are often expressed
through the following features:
- The existing and developing capability through activities.
- Capability revealed through skills in action.
- The different individuals will have different capabilities.
- Capability completely can foster to develop through education and training.
So we think: Statistical reasoning capability is the integration of statistical reasoning
skills, impact naturally on the statistical content in the practical context related
statistical data to solve the problems that that context set the scene.
2.8.2.1 Model developing statistical reasoning capability
2.8.2.1.1 The basis to model
2.8.2.1.2 Model developing statistical reasoning capability
11
2.8.2.2 Group of statistical reasoning capability from collection and data
description
a. Capability 1: Capability reasoning from preparation for data collection.
B. Capability 2: Capability reasoning from representative sample.
2.8.2.3 Group of statistical reasoning capability from organization and
presentation of data
a. Capability 3: Modelling the statistical information through formulas, tables and
statistics in charts.
Example 2:18 Returning the example 2.11 with the question: Create a chart to confirm
that this is a stable and effective investment channel ? What is mathematical basis of the
technique ?
b. Capability 4: Reading statistical information from the mathematical models showing
statistical information such as formulas, tables and statistical charts.
- The concept of reading statistical information
- The capability of reading information from tables, charts
2.8.2.4 Group of statistical reasoning capability from the analysis,
interpretation and conclusion
a.Capability 5: Observing statistical information to draw statistical conclusions.
Example 2:20 Survey hydrology to report for the feasibility study of an investment
project to build statistical tables we have average rainfall (mm) per month and year in the
Danang area as following:
Table 2.9 Distribution of rainfall in Danang
Month
Location
1 2 3 4 5 6 7 8 9 10 11 12
Year
Bana
(1963-1966)
377 194 71 99 204 211 164 405 454 869 1378 759 5185
Camle
(1975-1988)
57 17 17 33 97 110 54 92 362 622 417 154 2032
COMCLUSION
ANALYSIS
DATA
COLLECT
DATA
DERCRIBE
DATA
PRESENTATION
DATA
ORGNIZATION
DATA
Skill 1
Skill 2
Skill 3
Skill 4
Skill 5
Skill 6
Skill 7
Skill 8
Skill 15
Skill 16
SkillS 9
Skill 10
Skill 11
Skill 12
Skill 13
Skill 14
12
Danang
(1931-1998)
91 33 22 29 72 86 85 109 338 608 382 194 2049
Tiensa
(1975-1988)
81 27 21 29 87 99 64 101 372 760 546 269 2456
Question 1: Comment annual rainfall in the Da Nang area, with the increasing trend of
rainfall?
Question 2: If knowing the limit of total monthly rainfall is 100 mm, What month does
the rainy season in the Danang area start? What month is the highest?
Question 3: What is the distribution of rainfall over time in the Danang areas like?
b. Capability 6: Evaluate the limitations of the study, such as the reliability and efficiency
of measurement, the relevance of experimental forms, sample size and sample
characteristics.
Example 2.21 In one country, we conduct an opinion poll to find the level of support for
the presidential candidates in the next election. Four newspapers carry out independent
exploration nationwide. Four exploration results are announced as following:
The first newspaper : 36.5% support (exploration is conducted on 7 of March, with a
random sample of 500 residents with the right to vote).
The 2nd paper: 41% support (exploration is conducted on 23 of March, with a random
sample of 500 residents having the right to vote).
The 3rd paper: 39% support (exploration is conducted on 23 of March, with a random
sample of 1,000 residents having the right to vote).
The 4th newspaper : 44.5% support (exploration is conducted on 23 of March, 1000
readers called to vote).
What newspaper has the best result of exploration to predict the level of support if the
presidential election was held on 28 March? Please explain for your answer.
c. Capacity 7: Intuition statistics.
d. Capacity 8: Find predict, detect problems.
e. Capability 9: Analysis of prediction.
g. Capacity 10: Experimental statistics to predict.
Example 2:22 Before the car tire produced by DRC company took 42% market share.
At present, with the fierce competition of product market, the board of directors fear that
the company's market share is hard to be kept on. With the 0.01 significance level, you
make conclusions about the fear of the board.
2.8.2.5 Group of capacity use statistical reasoning in real life
a. Capacity 11: Estimating and checking answers for real life problems related
statistically to determine reasonability and identify a lot of capabilities, from that
choosing the most reasonable optimal option.
Example 2.23 Anh’s mother wants to buy a motorcycle 20 million VND, but hesitates
between two options:
- Gradual payment plan: prepaying 30% the remaining paid through a finance company
within 9 months, the monthly repayment amount is 2,044 million.
13
- The second option: Borrowing from the banks with consumer interest of 4% per month
to buy a motorcycle right.
You advice to help her choose the best option
b. Capacity 12: Analyzing, explaining and completing the professional task as well as
society concerned about the statistics.
Example 2.24 In the “secret doorway game” on television, Dung team won in round 1
and have the opportunity to open “the secret door” to receive the award. There are three
doorways, knowing that behind one of 3 prizes doorway has a high quality fridge, and the
two boxes left have small gifts.
Question 1: How many percents does Dung team have the opportunity to get the fridge?
Question 2: Dung team chose the doorway No. 1. The program conductor open the third
doorway and that's not the refrigerator. How many percents does Dung team have the
chance to get the fridge.
2.9 Assessment of statistical reasoning capability of professional college students
Table 2:10 Frame of statistical reasoning capability of students
Process Level Describing the level of statistical reasoning capability
Level
1
The inability of the analysis to clarify the information relating
data or incorrect comparison between the data or the
irrelevant data .
Level
2
Restrictions on the ability to analyze to clarify statistical
information, correct comparison between the data.
Level
3
Knowing analysis to clarify the statistical information,
including the correlation and causal relationships inside and
between data sets together.
Level
4
Perfect analysis in clarifying the statistical information,
including the correlation and causal relationships within and
outside the scope of the data set.
Analysis
Level
5
Analyzing like experts to clarify the statistical information,
including the correlation and causal relations and integration
into meaningful structures. Using excellent reasoning,
prediction from context much useful information outside the
scope of the data set.
Level
1
Inability to explain, to clarify issues related to statistical data
or incorrect interpretation.
Level
2
Restrictions on the ability to explain, to clarify issues related
to statistical data or incomplete explanations.
Level
3
Knowing to explain, to clarify issues within the statistic data
set including statistical significance and statistic descriptive
(average, median, mode).
Interpretation
Level
4
Explaining perfectly the issues related to statistical data,
including statistical significance and statistic description
14
(average, median, mode). Appropriate interpretation of a
number of issues outside the scope of the data set.
Level
5
Explaining skillfully issues related to statistical information,
including statistical significance and statistic description
(average, median, mode). Explaining excellently the issues
from contexts related inside and outside the scope of the data
set.
Level
1
Inability to apply and make decisions with an understanding
of the different scenarios or improper use.
Level
2
Restrictions on the ability to manipulate and difficulty in
making decisions with an understanding of the different
scenarios or use incomplete.
Level
3
Knowing application and deciding with an understanding
different scenarios related directly to the statistic data
collection
Level
4
Proficient in use and make rational decisions outside the
scope of the data set. Use in quality, completely and validity
the statistical reasoning.
Application
Level
5
Skill in the application and make a logical decision from the
contexts outside the scope of the data set. Applying perfectly
statistical reasoning to solve the problems from the context.
2.10 Assessment of the status of the teaching of development statistical reasoning
capability in professional colleges and business needs
2.10.1 The purpose of the survey
2.10.2 Object survey
2.10.3 Content survey
2.10.4 Survey methods
2.10.5 Analysis of survey results
2.10.5.1 About textbooks
2.10.5.2 Lecturers’ perceptions of developing statistical reasoning capability
2.10.5.3 About the students
2.10.5.4 Assessment social needs of statistical reasoning capability
2.11 Applying some theories of teaching in teaching statistics
2.11.1 Tectonic theory
2.11.1.1 Concept of tectonic
2.11.1.2 View of tectonic theory in teaching
2.11.1.3 Model of teaching and learning in view of tectonic theory
2.11.1.4 Applying tectonic theory in teaching statistics
2.11.2 Theory of operation
2.11.3 Theory of situations
2.12 A number of approaches in teaching statistics in professional colleges
15
Approach 1: The data taught in colleges should be based on the actual data in
accordance with practical production activities, the ages of students and the majors.
Approach 2: Establishing methods for collecting and processing data for students
through teaching statistics.
Approach 3: Teaching statistics should focus on improving the capability of reading
tables, charts.
Approach 4: Focusing on understanding statistics and developing statistical reasoning
capability for students through teaching statistics.
Approach 5: Enhancing the exploitation of practical applications in teaching statistics in
professional colleges.
2.13 Conclusion for chapter 2
Chapter 2 of the thesis has achieved some results as follows:
- Contributing to clarify the connotation of definition of statistical reasoning.
- Proposing 10 types of statistical reasoning integrated in models developing statistical
reasoning that students often use in analysis and processing of statistical data.
- We propose definition of statistical reasoning skills is that human’s reasoning ability
or perform an activity having results by selecting, applying statistical knowledge and
past experience to identify, explain, apply and draw meaningful conclusions from
statistical data; Based on the model of developing statistical reasoning, we propose four
groups of statistical reasoning skill integrated in models of developing statistical
reasoning.
- On the basis of considering statistical reasoning capability, that is an individual ability
to master the statistical reasoning skill, we propose a definition: Statistical reasoning
capability. From the above concepts, the model of developing statistical reasoning, from
the distributing group of statistical reasoning skills, we divide the elements of statistical
reasoning capability of students into 4 groups of statistical reasoning capability.
- We propose a framework of assessing the statistical reasoning capability of professional
college students.
- To assess the status of teaching statistical development statistical reasoning capability in
professional colleges, we have conducted a survey. From the results we obtained, we
have processed the data and analyzed, assessed the initial qualitative, quantitative .
- From practical teaching, from demands innovation of teaching in recent years, from
teaching statistical trends in the world, we suggest five approaches in teaching statistics
at the high and professional schools should focus on statistical literacy, statistical
reasoning and statistical thinking.
Chapter 3 SOME PEDAGOGY MEASURES TO DEVELOP STATISTICAL
REASONING CAPABILITY FOR PROFESSIONAL COLLEGE STUDENTS
3.1 A number of orientation of building and performing pedagogical measures to
develop statistical reasoning capability
16
3.1.1 Orientation 1: System pedagogical measures are built on the basis of
ensuring the program of teaching statistics for professional college students and follow
the principles of teaching.
3.1.2 Orientation 2: System pedagogical measures must have a positive impact to
the mission of developing statistical reasoning capability for professional college
students.
3.1.3 Orientation 3: System pedagogical measures must be feasible, can be
applied to the process of teaching in general and teaching process in particular statistic.
3.1.4 Orientation 4: The system pedagogical measures designed on approaches of
statistical learning and teaching to contribute innovation of teaching statistical methods in
professional colleges.
3.1.5 Orientation 5: The pedagogical measures must be directed to the students in
studying in the statistical activities to gradually create and dominate statistical
knowledge, contribute to the formation of new human in creative work and achieve high
effect in real life.
3.2 A number of pedagogical measures contribute to the development of statistical
reasoning capability for professional college students
3.2.1 Measure 1: Organizing for students to practise statistical reasoning
capability from activities of collecting and describing data.
3.2.1.1 The purpose of the measure
This measure affects to groups of skill and statistical reasoning capability from activities
of collection and data description.
3.2.1.2 Basis and role of measures
3.2.1.3 Content and guiding to perform
First, students need to understand that to collect data for research purposes, they must
master the following procedures:
- Defining which data need to be collected, the order of their priority. If this is not
specified, the collected data is less significant in the analysis and drawing statistical
conclusions.
- Methods of collecting primary data:
+ Collect directly as observed; live interview.
+ Collect indirectly as exchanging via telephones, emails, via vouchers and books
available.
- Develop a plan for statistical surveys: Describe the purpose of the investigation; objects
and investigation units; the content, time, the period of investigation, the investigation
tables.
To practise statistical reasoning capability from collecting activities and describing data,
teachers must practise students with the following reasonings:
- Depending on the purpose and the content of the study to reason the form of data
collection, selection of equipment, manpower and proper time to investigate.
- Practising students to identify representative sample, the sample size, the way to solve,
the way of presentation and calculation of the characteristic patterns to draw conclusions
17
overall are completely reliable. But they also have to understand that there is sampling
error, how to limit bias, the sample size selection will affect the reasoning results.
Example 3.1 Topic: "Investigation of the level of satisfaction of students in the canteen
of the dormitory".
3.2.2 Measure 2: Modeling of data in the form of tables, charts statistics to
draw conclusions and finding development trend of the phenomenon of study
3.2.2.1 The purpose of the measure
This measure impact positively on group of skills and statistical reasoning capability
from organizing activities and presenting statistical data.
3.2.2.2 Basis and role of measures
3.2.2.3 Content and guiding
a. Some charts used to show statistics data
b. Modeling the statistics data in the form of tables and statistical charts
Modeling statistical data focus on establing and pesenting data, model and find
relationships. The form of data representation through graphics, attract students to
participate enthusiastically in statistical reasoning in decision making, reasoning and
prediction. The process of modeling the statistical data to highlight trends, statistical laws
of phenomena studied. To model data, they must know what data is to use what type of
graph is most reasonable. In addition, students must know how to use technology to draw
graphs of statistics.
c. The way of performing
- Training students to make reasoned and logical conclusions from tables and statistical
charts.
- Training for students to find relationships and discover trends of the phenomenon
through tables of statistical data.
- Training for students to find relationships and discover trends of the phenomenon
through statistical graphs.
- Training for students to make decisions of performing from modeling statistical data.
Example 3.2 Phone subscribers in 2009 as following:
Table 3.2 phone subscribers in 2009
Month 1 2 3 4 5 6 7 8 9 10 11 12
Milion of
subscribers
82,52
86,6
89,19 89,5 92,92
101,7
107,84 110,3 113,5 106,4 107,5 130,4
Source:
Question 1: Select the appropriate form of diagrams to represent data in the abpve table?
Explain your choice.
Question 2: Telcos wants to emphasize that the amount of subscribers in 2009 increased
rapidly each month. You help them provide a solution. Draw the chart aiming at
achieving that purpose? What is this mathematical basis of the technique?
3.2.3 Measure 3: Developing reading capability of tables and statistical charts
as a precondition for statistical reasoning
3.2.3.1 The purpose of the measure
18
This measure impact positively on groups of skills and statistical reasoning capability
from organizing activities and presentation of statistical data.
3.2.3.2 Basis and role of measures
3.2.3.3 Content and guiding
a. Reading information from statistical tables
b. Reading information from statistical charts
Example 3.4 We return to example 2.7 on page 61, with the following two new
questions:
Question 1: How much is the total number of students in Vietnam in year the 2008-2009?
How many percents does the number of High School students take?
Question 2: How many high school students are there in the 2008-2009? Present the
calculation.
3.2.4 Measure 4: Increasing to practise and enhance statistical capability for
students to have a solid foundation for statistical reasoning
3.2.4.1 The purpose of the measure
Pedagogical measure 4 will develop groups of skills and statistical reasoning capability
from the analysis, interpretation and conclusion.
3.2.4.2 Basis and role of measures
3.2.4.3 Content and guiding
To obtain that, it is to practise the students with the following activities:
- Mastering the art of every kind of statistical problem
Train students to master the techniques of statistical calculations, statistical formulas,
procedures and some statistical algorithms of statistical problems. For example, the
process of solving a problem of statistical hypothesis testing when know before level
of significance including the following steps:
- Step 1 Develop statistical hypothesis pair H
0
, the set H
1
.
- Step 2 Make a random sample of size n: (X
1
, X
2
, , X
n
).
- Step 3 Choose standards of checking.
- Step 4 Find the rejection region W.
- Step 5 Find the value of observation, comparing with W to make conclusions.
- Step 6 Evaluation of mistakes.
Example 3.5: Packaging weight of sacks of rice in stock are normally distributed random
variable with an average weight of 50 kg. Suspect rice is balanced incorrectly,
storekeeper balances random 25 sacks and have results:
Table 3.4 Packaged weight of sacks of rice
Weight of rice Nember
48,0 – 48,5 2
48,5 – 49,0 5
49,0 – 49,5 10
49,5 – 50,0 6
50,0 – 50,5 2
19
Sum 25
With = 0.01 significance level, make conclusions about the suspect.
- To establish formulas to calculate the statistics through problem situations.
- Develop systems themed exercises to practice the ability to memorize formulas,
statistical calculation process for students.
3.2.5 Measure 5: Fostering for students the capability of detecting statistical
rules
3.2.5.1 The purpose of the measure
Pedagogical measures that we propose not only help develop capability of detecting
statistical rules hidden in data, but also contribute to the development groups of skills,
statistical reasoning capability from analysis, expression and making conclusion and
group of ability of applying statistical reasoning in real life.
3.2.5.2 Basis and role of measures
3.2.5.3 Content and way of performing
Thus, to build the capacity of detecting statistical rules for professional students, teachers
have to design, create problematic situations related to statistics data in which students
can be positive, active in detecting statistical rules. The problematic situations related
statistics data can create in the following ways:
- A problem related to the statistical data in practice need to be solved. For example,
sewing uniforms for students, why don’t people take the measurements of each student?
In equiping military necessities for the army, why they don’t take measurements of each
soldier?
- Observe a sufficiently large number of observational results to detect statistical rules.
- Generalizing from the observed phenomena related to statistics data.
The process of detecting statistical rules requires skills and statistical reasoning capability
of students. If we want to foster the capability of detecting statistical rules, we have to:
- Train students thinking ways such as specializing, generalizing, integratedly
analyzing to draw the signs of nature, the overall trend of the research from results
obtained by analyzing a sufficiently large sample.
- Visualizing activities to discover the laws of statistics.
- Control students to choose intellectual activities, math activities by the way of statistics
induction , modeling statistical data to draw general features, the laws of the phenomena
studied.
- Through practical survey to detect statistical rules.
- Train students to model statistical data to highlight trends, laws of statistics.
- Consider the causal relationships to detect statistical rules.
Example 3.7 A footwear company intends to produce 10.000 pairs of shoes for male
students in the new school year 2012. As head of planning department, Help our
company determine how many shoes for each size do we have to produce so that the
power consumption is highest. Knowing the need to buy shoes of everyone is the same.
3.2.6 Measure 6: Design methods of statistical prediction through teaching
statistics
20
3.2.6.1 The purpose of the measure
The measure 6 will develop group of skills and statistical reasoning capability from the
analysis, interpretation and making conclusions and group of ability of applying
statistical reasoning in real life.
3.2.6.2 Basis and role of measures
3.2.6.3 Content and guiding
In the process of teaching statistics to train students statistical prediction, the teacher
must keep in mind:
- Selection of predicting activities compatible with statistical content that should be
conveyed in the program.
- Predicting must be feasible and consistent with the level and awareness of students.
- Predicting activity must enhance the activeness, creative exploration and help students
step by step create and dominate knowledge.
To foster predicting statistics capability for professional students through teaching
statistics, the teacher should organize to train students statistical predicting methods as
following:
a. Statistical predicting method through observing statistics information .
b. Statistical predicting method through proposing statistical hypothesis, prediction.
Example 3.9: The teacher gives the class a situation to study: "The rate of Nokia product
customers was 60% before. After improving product quality, marketing research
department has made a advertising campaign for that product and surveyed 400 random
customers and finding that there were 250 people using that new product. With 95%
confidence, according to you, Is advertising campaign really effective? "
c.Statistical predicting method through generalizing activities, spealizing,
similaritifying visualizing activities
Example 3.10 To train students in road and bridge major to have the ability to collect,
process statistical data and predict the future, we can design a situation having
pedagogical intention as folloing:
To determine the level of the land roads to build in the future, it must be based on several
factors, including factors of vehicle traffic flow in the future. How to predict traffic flow
of vehicles in the future?
d. Statistical predicting method through the path through experiment, reconstruction.
3.2.7 Measures 7: Enhancing the exploitation of statistical problems with
practical contents related to statistical reasoning suitable with the major to train
students.
3.2.7.1 The purpose of the measure
Measure 7 would impact positively on group of capability appying statistical reasoning to
real life.
3.2.7.2 Basis and role of measures
3.2.7.3 Content and guiding
To exploit the statistical problems with practical contents related to statistical reasoning
suitable with the training major of students, teachers should pay attention to:
21
- Exploiting the statistical situations in practice to help students create concepts, new
statistical formulas.
- Exploiting the statistics data in practice, consistent with each major of students to bring
joy, excitement and encourage students to participate excitingly in learning statistics.
- Trying to exploit the practical problems relating to statistics to make examples, train
students to develop statistical reasoning capability.
3.2.8 Measure 8: Constructing learning environment to bring up and develop
statistical reasoning capability
3.2.8.1 The purpose of the measure
This pedagogical measure impacts positively to the entire groups of skills and groups of
statistical reasoning capability.
3.2.8.2 Basis and role of measures
3.2.8.3 Content and way of performing
We think that, to build learning environments to develop statistical reasoning capability
for students, we have to carry out a number of following tasks:
a. Focusing on developing a number of important statistical concepts
b. Enhancing to exploit data from real life appropriate for each age and each major of
students
c. Enhancing to exploit technology supporting teaching to develop statistical reasoning
capability
d. Enhancing to organize learning activities to develop statistical reasoning capability
for students
e. Building systems of exercises being suitable with the development of statistical
reasoning capability
g. Use alternative methods of assessment
Example 3.14 Project "Evaluation of traffic accidents in the first three months of 2013".
3.3 Conclusion chapter 3: On the basis of statistical approach of teaching and 5
orientations, we buil 8 pedagogical measures to impact on each group of capability to
contribute development of statistical reasoning capability for professional students.
Especially, we propose 4 statistical predicting methods needing development for
professional students.
Chapter 4 EXPERIMENTAL RESULTS
4.1 Purpose, requirement of pedagogical experiment: Evaluation of the effectiveness
and feasibility of pedagogical measures to develop statistical reasoning capability for
economics and engineering students, in teaching statistics at professional colleges.
4.2 Experimental pedagogical content
4.2.1 A number of basis to choose experimental pedagogical content
4.2.2 Pedagogical pedagogical experimental content
4.3 Organization of pedagogical experiment
Pedagogical experiment has been conducted in two phases. The first phase was
conducted in the period from march 2012 to the mid of May 2012, on the 11th college
22
class (students entered the school in september 2011), at the College of Transport II in
Danang. CD11K3 was the class of experiment taught by lecturer Hoang Nam Hai.
CD11K2 was the class of control, taught by lecturer Tran Thi Huong.
The second phase of experiments was conducted in the period of mid May 2012 to the
end of 06 June 2012, on the banking courses from Duy Tan University in Danang.
Experimental class is K17QCD5.6 taught by lecturer Hoang Nam Hai. Control class is
K17 QCD1,2.
4.4 Process of pedagogical experimental data
From the data collected through the survey process and organization of pedagogical
experiments, we use statistical methods to process statistical data.
4.5 Empirical Evaluation
4.5.1 Contents of the tests
4.5.2 Preliminary analysis of the tests
4.5.3 Analysis of experimental results
4.5.3.1 Qualitative Analysis
a. Qualitative analysis through questionnaires From summary we see, clearly over 80%
students are satisfied with the data that we put into teaching taken from real data, in
accordance with physiology training majors of students. Over 90% students are satisfied
with learning environment of statistics developing reasoning capability, predict that we
designed with the pedagogical measure 8. In the environment in which the students
study in mutual interaction, with the support of technology. There are 70% students
agreeing with traditional teaching methods not very exciting, but 80% of the students are
exciting to new pedagogical measure our. Thus, it can be said, Applying and coordinating
and 8 pedagogical measures in statistics teaching have brought the joy and excitement of
learning statistics for students, made the passive learning process into active learning
one, they themselves construct their own statistics knowledge.
b. Qualitative analysis through tests Observation of control classes in both waves we see
clearly the surprise of students when they received the test from teachers. Although the
problem was not difficult to their levels, but it seems a bit strange, it required them to
apply the knowledge of statistics, statistical reasoning capability to solve problems, draw
judgments, conclusions from different contexts of life. For the experimental class,
because of training and regular exercise of statistical reasoning capability in the learning
process, so they did not surprise with the test. They were a bit confident when facing with
problems taken from real life. Through these pedagogy measures integrated in teaching
statistics, teacher gradually train, develop statistical reasoning capability for students.
Problem-solving capabilities, ability to draw conclusions from statistical data helped
them more confident when facing the problems appearing in the context of life. That is a
powerful demonstration of the scientific hypothesis, the pedagogy measures proposed.
4.5.3.2 Quantitative analysis From treated results, we think that: the average score;
satisfactory rate; percentage of pretty and good points of the experimental class higher
than the control class. The results of the second round test of experimental class 5.6 and
class K17QCD5,6 and control K17 QCD1,2. From processing the results, we find that:
23
the average score; satisfactory rate, average rate, percentage of pretty and good points of
the experimental class higher than the control class. Two experimental results make a
question for us: Does pedagogical measure that we have designed to teach the
experimental class better statistical teaching methods in class control ? Or just so
random? Conducting to check the given hypothesis, we build statistical hypothesis pairs
as following: Suppose H
0
: "The results of the test from experimental class are not higher
than the examination results for control class,” For setting H
1
: "The examniation results
from experimental class is higher than the examination results for the control class." Get
5% significance level. We have:
Table 4.8 General Results
Experiment
Phase 1 Phase 2
Parameters
Experiment Control Experiment Control
Total number of
students 54 53 75 76
Average scores 6,2 4,77 5,96 5,01
The standard deviation 1,82 2,08 1,96 3,7
u
ob
3,78 1,98
The meaning 0,05 0,05
Critical value 1,96 1,96
Compare 3,78 > 1,96 1,98 > 1,96
Conclusion Reject H
0
, H
1
admits Reject H
0
, H
1
admits
The results of verification demonstrate proposed pedagogical measures applied on the
experimental class give results higher than the control class.
4.6 Conclusion for Chapter 4 Purpose of experiments has been achieved, the proposed
pedagogical measures really give high effects and can be applied in the teaching process
to develop the capability of statistical reasoning for students in professional colleges.
CONCLUSION OF THE THESIS
In terms of theory
1. Consensus with researchers in the world of education, teaching statistics should
innovate towards reducing calculating, focus on developing capability of statistics
literacy, statistical reasoning and statistical thinking.
2. From the objective developing statistical reasoning capability for professional college
students, the thesis has contributed to clarify: Explicit definition for statistical reasoning;
propose 10 types of statistical reasoning that professional college students often use in
the process they engage in the process of a statistical activity.
3. We have proposed definition of statistical reasoning capability. We consider statistical
reasoning capability proficiency level of statistical reasoning skills. From that, we
propose four groups of statistical reasoning skills, 4 groups of statistical reasoning
capability and 4 methods to predict statistics which professional students often use.
24
4. We research the way how to design lessons, the way of organizing learning activities
to develop statistical reasoning capability for professional students.
5. We haved proposed 8 pedagogical measures to practice, foster development of
statistical reasoning capability for professional college students.
Through pedagogical experiment, proposed pedagogical measures are highly effective
in fostering and developing the capability of statistical reasoning for professional college
students.
On a practical level
1. We have clearly contributed to the colorful picture in the teaching and learning of
statistics in colleges and universities today.
2. We contribute to the movement reforming the contents of the currriculum, editing the
lessons and the methods of statistical teaching in professional colleges.
3. Some proposed pedagogical measures in the thesis has been tested the effectiveness,
and feasibility through pedagogical experiments, can apply to renew the teaching and
learning of statistics in the current context.
4. Teaching methods focusing on developing statistical reasoning capability which we
study contribute much to students’ learning activities. Development of statistical
reasoning capability for professional college students through teaching statistics to help
students not ony practise students basic statistics skills and develop problem-solving
ability in life and in professional careers but also contribute to improve the quality of
college education workforce for the country.