nghiên cứu hiệu quả phương pháp tiêm tinh trùng vào bào tương noãn bằng tinh trùng lấy từ mào tinh trong điều trị vô sinh bản tóm tắt tiếng anh
Bạn đang xem bản rút gọn của tài liệu. Xem và tải ngay bản đầy đủ của tài liệu tại đây (365.04 KB, 37 trang )
BACKGROUND
Estimate that, one per 20 men related to infertility. The diagnosis techniques and treatmentsfor female
infertility is highly developed, but treatment techniques for male infertility arelimited.
“Azoospermia” is defined as the absence of sperms in acentrifuged semen sample, the incidence of
azoospermia in infertile men is between 5%-13,8% while in the general population, it is about 2%. The causes are
obstructive or non-obstructive azoospermia characterized by absent of sperm production. The advance of intra-
cytoplasmic sperm injection (ICSI) have made it possible to circumvent some case of male factor infertility,
especially azoospermia.
Objectives:
1. Describe features and factors related azoospermia men who were performed percutaneous epididymal sperms
aspiration in Assissted Reproductive Technology Center.
2. Evaluate the effectiveness and factors affect outcomes of percutaneous epididymal sperm aspiration/intra-
cytoplasmic sperm injection/in-vitro fertilization treatment of obstructive azoospermia cases.
Practical significance and contributions of the thesis
The thesis has found a cut-off of testicular volume, FSH and LH concentration in azoospermia patients in
order to rely on that thresholds to offer or not recommendation of PESA for these patients.
Thesis has humanities when help infertile azoospermia couples have their own sons, before these case were
untreated. The thesis also demonstrates that PESA is simple,efficient method to retrieve sperms from the
epididymis to perform ICSI. Epididymal sperms can be frozen, pregnancy rates from frozen semen and fresh semen
was equivalent.
THESIS STRUCTRURE
This thesis included 128 pages, 4 chapters, 31 tables, 14 figures, 11 pictures and 181 references. Background: 2
pages; Chapter 1: Literature, 38 pages; Chapter 2: materials and method: 11 pages; Chapter 3: Results: 28 pages;
1
1
Chapter 4: Discussion, 45 pages; Conclussion: 2 pages; Recommendations: 1 page; Further research: 1 page; Related
articles; References; Appendix; List of study patients.
CHAPTER I: LITERATURE
1.1. Difinition of infertility
Infertility is commonly defined as the failure of conception after atleast 12 months of unprotected intercourse.
Primary infertility (infertility I) is woman has never been pregnant before, secondary infertility (infertility II) is
the woman has been pregnant at least once before.
1.2. Prevalence of infertility in Vietnam and worldwide
Oakley (2008-England) survey on 60.000 UK women, 16% have been consulted for infertility, 8% need the
treatment to be pregnant. Karl(2008), prevalence of infertility in developing countries is between 5% -25.7%.
In Vietnam, population census in1982, prevalence of infertility was 13%. Nguyen Khac Lieu (1993-1997),
female infertility was 55,4%, male was 35.6% and unknown was 10%. Nguyen Viet Tien (2010) investigated
14.396 couples: incidence of infertility was 7.7%, in which infertility I was 3.9% and II was 3,8%.
1.2.1. Obstructive Azoospermia (OA)
Intra-testicular obtruction account of 15%, epididymal occupies 30-67%, ejaculate account for 1-3% of cases.
Epididymis is most common location. It may be congenital (CABVD) or acquired (gonorrhea, chlamydia).
1.3. PESA/ICSI/ procedure.
1.3.1. Ovarian stimulation, oocyte retrival and oocyte preparation
Ovarian stimulation multiple follicular development and maturation. Monitor follicular development. Oocytes
maturation by injecting hCG. oocyte retrieval performance 34-36 hours after, oocyte collectionunder
stereoscopicmicroscope. Denuding preparation for ICSI performance.
1.3.2.Percutaneous epididymal sperm aspiration and sperm preparation.
2
2
PESA performed on the oocyte retrival day. Washing sperm sample by gradient method or centrifuge if poor
concentration.
1.3.3. Intra-cytoplasmic sperm injection (ICSI)
Palermo, first introduced ICSI in 1992, now this technique are widely used and extended it’s indication to
male infertility. ICSI performed on stereomicroscope equipped with micromanipulator. Fix oocyte by holding
pipette inferior pole of oocyte touching bottom of dish, polar body is at 6 or 12 hour to ovoid injury spindle.
Injecting sperm into oolemma of oocyte.
1.3.4. Evaluation of fertilization, embryo transfer and monitoring
Evaluation of fertilization 18hours after ICSI. Evaluation number and size of blastomere. Embryo transfer
(ET) on day 2 or 3. βhCG dosage > 50 iu > pregnant. Clinical pregnancy (CP) if gestational sac or embryo or heart
movement in ultrasound.
CHAPTER 2: MATERIALS AND METHOD
Cross-sectional descriptive study and prospective intervention study with sample size and selection criteria are
used in this study.
2.1. Subjects
2.1.1. Selection criteria
2.1.1.1. For cross-sectional descriptive study
Azoospermia (spermogram twice 3 - 5 days, seperated).
Agreed to participate in research.
2.1.1.2. For prospective interventional study
Infertile couples due to azoospermia, PESA diagnosis with sperm.
Agreed to be treated by PESA/ICSI
3
3
Wives under or equal 40 year olds
Agreed to participate in research.
2.1.2. Exclusion criteria
For prospective interventional study
Infertile wives due to one of following causes:
+ Infertility due to poor ovarian responder.
+ Ovulation disorder due to hyperprolactinemia.
+ Infertility due to uterus, uterine cavity (fibroid, intra-cavity polype…)
+ Wives above 40 year olds
2.2. Setting and study time: research covers period 12/2009 to 12/2012, at ART Center of National Hospital of
Obstetric and Gynecology .
2.3. Sample size.
2.3.1. Sample size for cross-sectional descriptive study.
2
2
)2/1(
).(
.
p
qp
Zn
ε
α
−
=
n: sample size, p: incidence of azoospermia in infertile men (15% according to Jarow). q = 1-p; Z
(1-
α
/2)
= 1,96:
reliability coefficient of probability 95% with α = 0,05.ε.p : desired accuracy; ε: relative deviation ranging from
0,1-0,4.ε = 0,3. n= 245, in fact 249 enrolled.
2.3.2. Sample size for prospective interventional study.
4
4
( )
pp
m
N
−
≥
1
96,1
2
N: sample size; p: success rate (pregnancy rate). m: constant = 0,1 and p was 34% (Godwin), N =90, in fact 170
enrolled.
2.4. Method
Cross-sectional descriptive study: study features and factors related to azoospermia
Prospective interventional study: evaluation effectiveness of PESA/ICSI for infertile azoospermia couples.
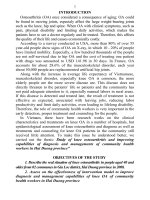
2.4.2. Study process
Azoospermia men
(n = 249)
Agreed to participate in research
Clinical history
Examinations
Laboratory Evaluation
Percutaneous epididymal sperm aspiration/diagnosis (PESA)
Sperm(n = 170)
No sperm (n = 79)
PESA/ICSI
(N =226 ovarian stimualation cycles: 223 embryo transfer cycles + 29 frozen embryo transfer cycles)
Evaluation outcomes and affecting factors
Finish
Results
86 pregnant
84 non-pregnant
Freeze (n=26)
5
5
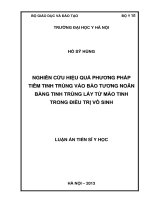
Figure2.1. Study process
2.6. Data proccessing and analizing.
Data manipulation and analysis was performed using SPSS 16.0 software. Compare % by χ
2
test, the average value
by T-test. ROC curve find threshold of FSH, LH level and testicular volume to predict possibility of sperms
aspiration from epididymis.
CHAPTER 3: RESULTS
3.1. Features and factors related azoospermia men.
3.1.1.Features of azoospermia men
Figure 3.1. PESA diagnosis
249 azoospermia men were performed PESA. 170 cases with sperm (obstructive azoospermia) (68,27%), 79 cases
without sperm (non-obstructive azoospermia) (31,73%).
Table 3.1. Distribution of age group of azoospermia men
Age (year)
Obstructive
Azoospermia (n;
%)
Non-Obstructive
Azoospermia (n,%)
Total (n,%)
< 25 13 (7,6%) 7 (8,9%) 20 (8%)
26 - 30 59 (34,7%) 27 (34,2%) 86 (34,5%)
31- 35 63 (37,1%) 25 (31,6%) 88 (35,3%)
36 - 40 17(10,0%) 13 (16,5%) 30 (12,0%)
> 40 18 (10,6%) 7 (8,9%) 25 (10,0%)
Total 170 (100%) 79 (100%) 249 (100%)
6
Trữ lạnh mẫu
tinh trùng
(n=26)
6
Mean age 32,41 + 5,7 32,28 + 5,7 32,37 + 5,6
Mean age of azoospermia men: 32.37 + 5,6,mean age of OA group was 32.41 + 5.7 and NOA group was 32.28 + 5.7.
The difference of age between two groups is not statistically significant, p = 0.869.
3.1.2.Factors related azoospermia men
Table 3.5. The clinical and laboratoryfeatures of azoospermia men
Factors
Obstructive
Azoospermia (n =
170)
Non-Obstructive
Azoospermia (n =
79)
p
Right testicular size(ml) 16,86 + 2,1 10,57 + 4,5 0,000
Left testicular size (ml) 16,69 + 2,3 10,46 + 4,3 0,000
FSH (IU/L) 4,76 + 2,7 16,23 + 10,5 0,000
LH (IU/L) 4,69 + 2,7 11,35 + 7,6 0,000
Testosterone (nmol/L) 19,59 + 6,2 15,33 + 8,3 0,000
Testicular volume in OA group greater than that in NOA group. The difference is statistically significant; p <
0,001.FSH, LH levels in OA group were lower than that in NOA group, the difference is statistically significant; p <
0,001.
Table 3.6. Testicular volume and outcomes of PESA in infertile patients
Testicular
volume (ml)
Obstructive Azoospermia (n,
%)
Non-Obstructive Azoospermia
(n,%)
Right Left Right Left
< 10 0 (0) 0 (0) 29 (36,7) 29 (36,7)
10 – 14,9 17 (10,1) 26 (15,3) 34 (43,0) 33 (41,8)
7
7
15 – 19,9 126 (74,6) 121 (71,2) 12 (15,2) 13 (16,5)
> 20 26 (15,3) 23 (13,5) 4 (5,1) 4 (5,2)
Total 169 (100) 170 (100) 79 (100) 79 (100)
89,9% of right testes and 84,7% of left testes in OA group > 15ml. 79,7% of right testes and 78,5% of left testes in
NOA group < 15 ml.
3.1.3. Threshold of FSH, LH level and testicular volume predict possibility of sperms aspiration
3.1.3.1. Threshold of FSH level predicts possibility of sperms aspiration
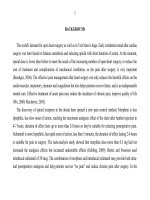
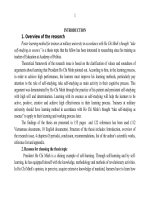
Figure 3.2. ROC curve of FSH concentration predict possibility of sperms aspiration from epididymis
8
8
The area under the ROC curve of FSH was 0,866 + 0,02 (with a 95% confidence interval for the area beingbetween
0,811 – 0,921). FSH > 12,4IU/L predicts failure ofsperms retrieval from epididymis with a sensitivity of 62% and a
specificity of 100%.
3.1.3.2. Threshold of left testicular volume predicts possibility of sperms aspiration
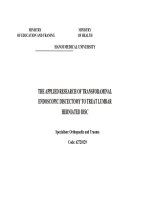
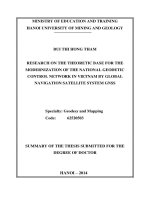
Figure 3.3. ROC curve of left testicular volume predicts possibility of sperms aspirationfrom epididymis
The area under the ROC curve of left testis was 0,899 ± 0,03 (with a 95% confidence interval for the area being
between 0,849 - 0,949). Left testis > 12,5 ml, success of sperms retrieval from epididymis with a sensitivity of
97,6% and a specificity of 72,2%.
3.1.3.3. Threshold of right testicular volume predicts possibility of sperms aspiration
9
9
Figure 3.4. ROC curve of right testicular volume predicts possibility of sperms aspirationfrom epididymis
The area under the ROC curve of right testis was 0,906 ± 0,03 (with a 95% confidence interval for the area being
between 0,855 - 0,956). Right testis > 13,5 ml, success of sperms retrieval from epididymis with a sensitivity of 97%
and a specificity of 75,9%.
3.1.3.4. Threshold of LH level predicts possibility sperms aspiration
10
10
Figure 3.5. ROC curve of LH concentration predicts possibility of sperms aspiration from epididymis
The area under the ROC curve of LH was 0,781 + 0,04 (with a 95% confidence interval for the area being between
0,781 - 0,851). LH > 16,2IU/L, failure of sperms retrieval from epididymis with a sensitivity of 30,4% and a
specificity of 100%.
3.1.4. Characteristic’s wife whose obstructive azoospermia husband treated by PESA/ICSI
Table 3.7. The indicators of ovarian reserve
Protocol
Indicators
Agonist protocol
Antagonist(
n=27)
Total p
Short (n=
37)
Long (n= 162)
FSH (IU/L) 5,91 + 2,5 6,42 + 1,6 6,10 + 1,6 6,30 + 1,8 0,2
2
*
11
11
0,7
2
**
0,3
3
***
LH (IU/L) 3,39 + 2,5 4,68 + 2,2 5,59 + 3,8 4,58 + 2,5
0,0
2
*
0,0
06
**
0,2
3
***
Estradiol
(pmol/L)
42,32 + 24,9 36,77 + 16,4 46,11 + 51,5 38,79 + 24,6
0,2
0
*
0,6
9
**
0,0
7
***
AFC 9,27 + 4,1 11,54 + 4,8 11,30 + 3,5 11,14 + 4,6
0,0
08
*
0,0
4
**
0,8
*
**
BMI 20,09 + 2,4 19,97 + 2,3 19,46 + 2,8 19,94 + 2,3 0,8
*
0,4
4
**
0,4
12
12
1
***
Female age
(year)
31,59 + 6,2 27,87 + 3,7 27,56 + 3,8 28,44 + 4,5
0,0
0
*
0,0
2
**
0,7
5
***
Notes: (
*
): between short and long protocol; (
**
): short and antagonist protocol; (
***
): long and antagonist protocol
FSH, LH, Estradiol concentration, AFC were in normal range. LH concentration, AFC and age of the wives were
significant difference between short and long protocol; p < 0,05.
3.2. Effectiveness and fators affecting outcomes of PESA/ICSI
3.2.1.Effectiveness of PESA/ICSI
3.2.1.1. Effectiveness of PESA
Figure 3.8. Number of PESA
13 patients were done PESA 1 time.117 patients were done PESA 2 times (68,8%), 30 patients were done PESA 3
times(17,6%), 10 patients were done PESA 4 times(5,9%). All had sperms.
13
13
Table 3.8. Outcomes of PESA for ICSI
Results Numbers of cycle Rate %
Thawed sperms 19 8,4
+ 45 19,9
++ 129 57,1
+++ 33 14,6
Total 226 100
19 PESA with frozen sample(8,4%), 45 PESA (19,9%) with (+), 129 PESA (57,1%) with (++) and 33 PESA (14,6%)
with (+++).
Table 3.9. Outcomes and pregnancy rate from frozen sperm sample
Freeze Pregnant Non-pregnant Total
Sufficient thawed sperm 7 (26,9%) 12 (46,2%) 19 (73,1%)
Incomplete degeneration 1 (3,8%) 1 (3,8%) 2 (7,7%)
Complete degeneration 3 (11,5%) 2 (7,7%) 5 (19,2%)
Total 11 (42,3%) 15 (57,7%) 26 (100)
26 samples frozen, to 19 sufficient thawed sperm for ICSI (73,1%), 5 thawed complete degenerated samples
(19,2%) and 2 Incomplete degenerated samples (7,7%). 7 pregnancies from thawed sperms (26,9%).
3.2.1.2. Effectiveness of ovarian stimulation
Table 3.10. Number of ovarian stimulation cycle
Numbers of cycles Number of Cycles Rate %
14
14
patient
1 cycle 125 125 55,3
2 cycle 34 68 30,1
3 cycle 11 33 14,6
Total 170 226 100
125 patients treated 1 cycle (55,3%), 34 patients treated 2 cycles (30,1%) and 11 patients treated 3 cycles
(14,6%).
Table 3.11. Characters and results of ovarian stimulation
Protocol
Index
Agonist protocol
Antagoni
st (n=27)
Total p
Short (n=
37)
Long(n= 162)
Average day of
FSH (day)
8,78 + 0,9 9,91 + 0,9 9,26 + 0,9
9,65 +
0,9
0,000
*
0,04
**
0,001
***
Mean total FSH
dosages (IU)
2227,03 +
830,6
1917,75 +
592,9
1710,19 +
403,2
1943,58
+ 633,3
0,03
*
0,004
**
0,02
***
Total oocyte 254 1468 225 1947
Mean oocyte 6,86 + 4,4 9,06 + 4,3 8,33 + 3,7
8,62 +
4,3
0,006
*
0,16
**
0,41
***
Endometrium
(mm)
10,87 + 2,6 12,36 + 2,2 12,05 + 2,3
12,08 +
2,3
0,000
*
0,06
**
0,49
***
Notes: (
*
): between short and long protocol; (
**
): short and antagonist protocol; (
***
): long and antagonist protocol
15
15
Average day of FSH was 9,65 + 0,9 days, total dose of FSH was 1943,58 + 633,3IU, average number of oocyte was
8,62 + 4,3. Average endometrial thickness was 12,08 + 2,3mm.
Table 3.12. Progesterone concentration on hCG day related to pregnancy outcomes
Progesterone
Result
Progesterone concentration
Total
<3,2nmol/L > 3,2nmol/L
Pregnant 64 (41,6%) 18 (26,1%) 82 (36,8%)
Non-pregnant 90 (58,4%) 51 (73,9%) 141 (63,2%)
Total 154 (100%) 69 (100%) 223 (100%)
41,6% patients with progesterone <3,2nmol/L were pregnant. 26,1% with progesterone >3,2nmol/L were
pregnant. Difference of pregnancy rates between progesterone concentration groups is statistically significant; χ
2
= 4,906, p = 0,027.
3.2.1.3. Effectiveness of ICSI and embryo culture
Table 3.14. Results of ICSI
Protocol
Index
Agonist protocol
Antagonist
(n=27)
Total
p
Short (n= 37)
Long (n=
162)
Total embryo 157 1021 159 1337
Fertilization
rate (%)
63,24 + 24,4 70,59 + 21,8 68,72 + 22,3
69,16 +
22,4
0,07
*
0,361
**
0,68
***
Mean embryo 4,24 + 2,7 6,30 + 3,4 5,89 + 3,5
5,92 +
3,4
0,001
*
0,04
**
0,56
***
16
16
Notes: (
*
): between short and long protocol; (
**
): short and antagonist protocol; (
***
): long and antagonist protocol
Average number of oocytes was 5,92 + 3,4. Fertilization rate was 69,16%, fertilization rate in short protocol group
was 63,24%, long protocol group was 70,59% and antagonist group was 68,72%. Difference of fertilization rate
between groups is not statistically significant with p > 0.05.
Table 3.15. Compare outcomes of ICSI between fresh and frozen/thawed sperms from epididymis
Index Fresh sperm Thawd sperm p
Average oocyte 8,5 + 4,2 9,84 + 5,2 0,288
Average embryo 5,85 + 3,4 6,63 + 3,2 0,340
Fertilization rate (%) 68,86 + 22,3 72,45 + 23,4 0,505
Implantation rate (%) 15,44 +24,9 13,16 + 18,7 0,698
Number of ET 3,48 + 1,2 3,68 + 0,8 0,328
CP rate % 36,2 36,8
Difference of average number of oocytes, average number of embryos and embryos transferred between
epididymal freshand cryopreserved sperm groups was not statistically significant with p> 0,05. Fertilization,
implantation and pregnancy rate in fresh sperm group was 68,86%, 15,4% and 36,2%, respectively and in
cryopreserved sperm group was 72,45%, 13,16% and 36,8%. The difference is not statistically significant with p >
0.05.
3.2.1.4. Embryo transfer results
Table 3.16. Embryo transfer results
Protocol
Index
Agonist protocol
Antagon
ist
(n=27)
Total
p
Short (n= 37)
Long (n=
162)
Total ET 116 576 91 783
17
17
Mean ET 3,14 + 1,4 3,6 + 1,1
3,37 +
1,4
3,5 +
1,2
0,02
*
0,5
**
0,34
***
No of gestational sac 11 104 6 121
Implatation rate (%) 9,48 18,05 6,59 15,45
0,04
*
0,316
**
0,00
***
Notes: (
*
): between short and long protocol; (
**
): short and antagonist protocol; (
***
): long and antagonist protocol
Implatation rate was 15,45%. Avarage transfered embryos were 3,5 + 1,2.
3.2.1.5. Pregnancy outcomes
Table 3.17. Pregnancy rate after each ovarian stimulation cycle
Clinical pregnancy (n ;%) Total
Fresh embryo
transfer(n =
226)
1
st
cycle(n = 170)
66 (38,8%)
82
(36,28%)
2
nd
cycle(n=45)
13 (28,9%)
3
rd
cycle(n=11)
3 (27,3%)
Frozen embryo transfer(n=29) 4 (13,79%)
Cumulative pregnancy 86 (38,05%)
1
st
cycle: 170 couples treated, 66 pregancy (38,8%). 2
nd
: 45 continued treatment, 13 pregnancy (28,9%). 3
rd
: 11
continued treatment, 3 pregnancy (27,3%).After 3 cycles: 82 clinical pregnancy (36,28%). 29 thawed/embryo
transfer, 4 clinical pregnancy (13,79%). Comulative pregnancy rate was 38,05%.
Figure 3.11. Cumulative pregnancy rate/patients after 3 cycles
1
st
cycle: 66 pregnancies (38,8%/total patient). 2
nd
cycle: 79 pregnancies (46,47%/total patient). 3
rd
cycle: 82
pregnancies (48,24%/total patient).
18
18
Table 3.18. Evolution of pregnancy
Results Numbers (n = 170) Rate (%)
Ongoing pregnancy 52 60,5
Live birth 22 25,6
Abortion, preterm delivery 12 13,9
Total 86 100
52 ongoing pregnancies (60,5%), 22 live births (25,6%), 12 abortions (13,9%).
3.2.2. Factors affecting outcomes of PESA/ICSI
3.2.2.1. Male factors
Table 3.19. Male fators affecting pregnancy outcome
Factors
Pregnant (n =
82)
Non-pregnant (n =
141)
p
Age (year) 31,67 + 5,5 32,81+ 5,8 0,151
FSH (IU/L) 4,57 + 2,7 4,92+ 2,5 0,337
LH (IU/L) 4,57+ 2,7 4,92+ 2,5 0,367
Testosterone 20,93+5,9 19,46+5,8 0,074
Right testicular volume (ml) 16,43+ 1,8 17,12+ 2,3 0,120
Left testicular volume (ml) 16,30+ 1,8 17,08+ 2,4 0,155
No significant difference of mean age, FSH, LH and testosteronbetween pregnant and non-pregnant groups; p >
0,05.
3.2.2.2. Female factors
Table 3.20. Female fators affecting pregnancy outcome
19
19
Factors Pregnant(n = 82)
Non-pregnant(n =
141)
p
Age (year) 27,96 + 4,1 28,72 + 4,7 0,229
Duration of infertility 3,63 + 2,9 4,48 + 4,0 0,097
Endometrium 12,47 + 1,9 11,86 + 2,5 0,041
Number of ET 3,80 + 0,9 3,34 + 1,3 0,002
Fertilization rate 69,41% 67,78%
No significant difference of female mean age, infertility duration between pregnant and non-pregnant groups; p >
0,05. Differences of endometrial thickness and numbers of embryo transfered between pregnant and non-pregnant
groups are statistically significant with p < 0,05.
3.2.2.2.3. Relation between endometrium and pregnancy rate
Table 3.24. Relation between endometrial features and pregnancy rate
Results
Endometrium
Pregnant Non-pregnant Total
Hyperechoic 18 (19,1%) 76 (80,9%) 94 (100%)
Heterogeneous 0 (0%) 7 (100%) 7 (100%)
Triple-layer 64 (52,5%) 58 (47,5%) 122(100%)
Total 82 (36,8%) 141 (63,2%) 223 (100%)
Pregnancy rate in triple-layer endometrium was 52,5%, hyperechoic endometrium was 19,1% and 4 patients in
heterogeneous endometrium was non-pregnant. Difference is statistically significant with χ
2
= 29,54; p = 0,000.
3.2.2.2.4. Relation between quantity and quality of embryos and pregnancy rate
Table 3.25. Relation between quantity and quality of embryos and pregnancy outcomes
20
20
Number of ET PR(%)
χ
2
; OR, CI
0 good quality embryo 2,5 (1/40)
1 good quality embryo 32,3 (10/31)
2 good quality embryo 31,8 (14/44)
> 3 good quality embryo 52,8 (57/108)
Notes:
*
:compare 0 good quality embryo with 1 good quality embryo;
**
:1good quality embryo with 2good quality embryos;
***
:2good quality embryos with > 3
good quality embryos.
Difference of pregnancy rate between 1 good quality embryo transfer group and 0 good quality embryo transfer
group is statistically significant with χ
2
= 11,81; OR = 18,57; CI (2,2-155,2). Difference of pregnancy rate between >
3 good quality embryo transfer group and 2 good quality embryo transfer group with χ
2
= 5,52; OR = 2,4; CI (1,1 –
5,0).
CHAPTER 4: DISSCUSSION
249 azoospermia men were performed PESA. 170/249obstructive azoospermia (68,27%). 79 non-obstructive
azoospermia (31,73%) (figure 3.1). 170 obstructive azoospermiacouples were treated by PESA/ICSI. Total 226
PESA/ICSI cycles, in which 125 couples treated 1 cycle, 34 couples were treated 2 cycles and 11 couples were
treated 3 cycles (table 3.10). 82 clinical pregnant cases after 223 fresh embryo transfer cycles and 4 clinical
pregnant cases after 29 frozen embryo transfer cycles.
4.1. Discussion of features and laboratory indicators of azoospermia patients.
4.1.1.Outcomes of diagnosis PESA
Percutaneous epididymal sperm aspirationprocedure to identify sperm in epididymis (PESA diagnosis) is an
important step before PESA/ICSI cycle for sure having available sperm before deciding ovarian stimulation. If
21
χ
2
=11,81; OR = 18,57; CI (2,2-55,2)
*
χ
2
=0,002; OR = 0,98; CI (0,4-2,6)
**
χ
2
=5,52;OR = 2,4; CI (1,1 – 5,0)
***
21
sperm is not available after oocyte aspiration, that oocyte must to be frozen, but it is easy to degrade due to large
cytoplasm.
170/249 cases PESA with sperm (68,27%), is the obstructive azoospermia-OA, testes still produce sperm, but
was obstructive in epididymis. This rate is lower than Godwin's research (1998) was 82,8%, but higher than
Tang’s study (2007) was 50,84%. Both authors concluded that PESA is fast, effective helping distinguish
obstructive azoospermia and non-obstructive azoospermia-NOA.
Sperm density in epididymal aspirated sample much less than ejaculate sample so it can not be fertilized by
conventional methods (IUI, conventional IVF) but it is required ICSI.
79 cases PESA without sperm (31.73%), similar to study of Garcia (2002) was 31%, but lower than that of
Jarow (1989) was 60%.
4.1.2.Age of azoospermia patients
The average age of azoospermia men was 32,37 + 5,6 years (table 3.1). The average age of obstructive
azoospermia group was 32,41 + 5,7 years and non-obstructive group was 32,28 + 5,7 years. The difference of
average age between the OA and NOA groups was not statistically significant with p = 0,869. Average age in our
study is lower than that in Glina study (2003), Buffat study (2006), Godwin study (1998) and Mai Quang Trung
study (2010) and equivalent of Shyh study (2010) was 30,1 ± 4,2 years in OA group and 29,8 ± 4,5 in NOA group, of
Seyed study (2006) was 33,2 ± 6,1 years in OA group and 34,5 ± 5,8 years in NOA group.
4.1.3.Factors relatied to azoospermia.
4.1.3.1. Testicular size of azoospermia patients.
99% of testicular tissue is germinal epithelium, 1% is the interstitial tissue, thereforeinjury (mumps,
testicular trauma) primarily affects germinal epithelium, testicular shrinkage, impacts spermatogenesis function .
22
22
Assess testicular size by comparing testicular with standard samples available from 1 to 25ml. According to
table 3.6, in OA group, 89,9% of right testis and 84,7% left testis > 15ml, no cases of testis size less than 10ml. NOA
group, 79,7% of right and 78,5% of left testes<15 mL, 36,7% of cases testes size < 10ml.
Table 3.5 showed, the average volume of right and left testes in OA group were respectively 16,86 + 2,1ml and
16,69 +2,3ml. Average right and left testicular volume in NOA groups were 10,57 + 4,5ml and 10,46 + 4,3ml. Thus,
testicular size in OA group larger than NOA group. The difference is statistically significant with p <0,01, similar to
results of Goran (1999), Tournaye (1997). This findings indicated, an azoospermia patient having small testicles is
very difficult to aspirate sperm from epididymis.
4.1.3.2. FSH, LH and testosterone concentrations related to azoospermia.
In testes, there are Leydig and Sertoli cells interact with each other through the LH and FSH receptors. FSH
stimulates Sertoli cells secret Androgen Binding Protein. LH stimulates Leydig cells secret testosterone, binding
with ABP, only about 2% in the form of free testosterone and have biological effects.
When testes do not produce sperm, pituitary gland increased secretion of FSH. Table 3.5, FSH concentration
in PESA without sperm group was 16,23 + 10,5IU/L higher than PESA with sperm group was 4,76 + 2,7IU/L, the
difference is statistically significant with p < 0.05. This result is similar to study of Seyed, Goran, Shyh and Trinh
The Son (2013).
Table4.1.Compare FSH concentration between obstructive and non obstructive azoospermia
Type
Authors
Obstructive azoo Non-obstructive azoo p
Tournaye (1997) 8,2 + 1,0 17,0 + 1,9 0,0001
Goran (1999) 3,8 + 2,0 23,9 + 13,6
Seyed (2006) 5,83 ± 3,51 20,82 ± 5,85
Shyh (2010) 7,94 ± 4,95 28,03 ± 14,56 0,01
23
23
Ho Sy Hung (2013) 4,76 + 2,7 16,23 + 10,5 0,000
Low testosterone levels will stimulate pituitary secret LH. Table 3.5, LH level in NOA group was 11,35 +
7,6IU/L, higher than OA group was 4,69 + 2,6 IU/L. Difference of LH level between two groups was not as large as
difference of FSH. This may be due to when testes were injury, not only germinal epithelium but also interstitial
tissue (Leydig cell in this tissue) would be injury but less severe than germinal epithelium. Therefore endocrine
function was not reduced as much as exocrine function, testosterone concentrations in OA group compared with
that in NOA group was not much different (table 3.5).
4.1.3.3. Threshold FSH level predicts possibility of sperms aspiration
When nospermatogenesis proccess in testes, it stimulates pituitary gland increase secretion of FSH. Many
studies concluded FSH levels increase in NOA patients, but normal in OA patients.
Before IVF cycle, sperm must be available at time of oocyte pick-up. The process need much of gonadotropin,
prolonge duration, high cost, so make sure available sperm before conducte ovarian stimulation.
Figure 3.2 shows, the area under the ROC curve of FSH was 0,866 + 0,02 (with a 95% confidence interval for
the area being between 0,811 – 0,921). Thus, FSH level is valuable to predict possibility sperm aspiration from
epididymis. FSH > 10,71 IU/L failure of sperm retrieval from testis with a sensitivity of67,1% and specificity of
98,2%. FSH > 12,4IU/L, failure of sperm retrieval from testis with a sensitivity of 62% and a specificity of 100%.
This threshold was lower than Shyh’s study (2010) was 19,4 IU/L.
4.1.3.4. Testicular volume predicts possibility of sperm aspiration
Figure 3.3 shows, the area under the ROC curve of left testicular volume was 0,899 + 0,03 (with a 95%
confidence interval for the area being between 0,849 – 0,949) and ROC curve of right testicular volume was 0,906
+ 0,03 (with a 95% confidence interval for the area being between0,855 – 0,956). Thus, testicular volume can
predict ability of sperms aspiration from epididymis. Left testicle > 12,5ml predict epididymal sperms aspiration,
24
24
sensitivity of 97,6% and specificity of 72,2%. Right testis > 13,5ml predict ability of sperms aspiration with
sensitivity of 97,0% and specificity of 75,9% (figure 3.4). Seyed (2006), testicular volume threshold predict ability
sperm aspiration was 9,5 ml.
4.1.3.5. LH level predicts possibility sperm aspiration
The area under the ROC curve of LH was 0,781 + 0,04 (with a 95% confidence interval for the area being
between 0,781 – 0,851). (figure 3.5). Thus, LH level is valuable to predict possibility sperm aspiration from
epididymis. LH > 9,47IU/L predict possibility sperm aspiration with sensitivity of 58,2% and specificity of 96,5%.
LH > 16,2IU/L predict possibility sperm aspiration with sensitivity of30,4% and specificity of 100%.
Small testes, high gonadotropin levels, specially high FSH level in azoospermia patients will predict difficulty
of sperms aspiration from epididymis.
4.2. Characteristics of wivies treated by PESA/ICSI
We discuss characteristics of 170 wives of OA husbands. These patients will be stimulated for PESA/ICSI. Table
3.7 shows average age was 28,44 + 4,5 years, at this age, ovarian reserve is favorable for ovarian stimulation. Age
is lower than Mai Quang Trung's study (2010) was 33,1 + 4,95 years and Han Manh Cuong’s was 34,36 +5,5 years.
The indicators of ovarian reserve include FSH, LH, estradiol was, respectively 6,30 + 1,8IU/L, 4,58 +2,5IU/L
and 38,79+ 24,6pmol/ml and antral follicles count was 11,14 + 4,6 follicles (table 3.4), allwere in normal range
meaning good ovarian response. BMI was 19,94+ 2.3, normal weight so it will get good results when ovaries
stimulation. (table 3.7).
4.3. Effectiveness and factors affect outcomes of PESA/ICSI
4.3.1. Effectiveness of PESA/ICSI
226 PESA/ICSI cycles, including 125 couples treated 1 cycle, 34 couples treated 2 cycles and 11 couples
treated 3cycles (table 3.10). PESA/ICSI is consecutive procedures including PESA, (freeze sperm sample), ovarian
25
25