Map indus zones user interface
Bạn đang xem bản rút gọn của tài liệu. Xem và tải ngay bản đầy đủ của tài liệu tại đây (1.28 MB, 15 trang )
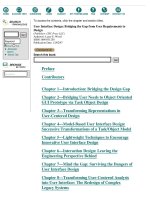
Contents
1 Introduction 1
2 Setting-Up the Extension 2
2.1 Installation 2
2.2 Testing the Installation 3
3 Using the Extension 5
3.1 General 5
3.2 Toxicity View 6
3.3 Analysis Toxicity Indexes 7
3.4 Database Management 9
3.5 Getting Coordinates of Industrial Zones 12
3.6 Help System 13
4 Recommendations for Further Developments 14
1 Introduction
The IER Map Display Extension to ESRI ArcView V3.2 is designed to enable
users of the toxicity assessment to visualize analysis of toxicity indexes of the
HCMC industrial zones. This image processing and manipulation is designed
exclusively for ESRI ArcView Version 3.2. The interface helps users in numerically
and graphically displaying toxicity indexes for wastes discharged by all industrial
establishments located within HCMC metropolis region. The interface is available
to all users with a minimum of operator ArcView GIS status. It is aimed primarily
at providing non-expert GIS users, i.e. users unfamiliar with the ESRI ArcView
software.
When a model is loaded into the ArcView it is possible to perform importing map
data for viewing, comparison of extension maps both visually and numerically and
to exporting analysis results into readily printing layouts. The extension is intended
to equip DSF users with the tools they need to exploit DeltaMapper binary raster
data for creating and maintaining their GIS content within the ESRI ArcView
system. With the release of the IER Map Display GIS Extension for ArcView
V3.2, additional graphical and database functionalities are available to users to
improve their workflows.
The IER Map Display Extension also provides a way to organize storing the user’s
binary raster data sets into databases. It is the best not only for the software to
perform data analysis but it is also an excellent recommendation to affectively later
data processing performed by the other environmental software users.
Doc No Rev: 1 Date: December 2005 1
wlg1413863270.docToxcicity Analysis
2 Setting-Up the Extension
The following section describes the procedures for preparing and loading the IER
Map Display Extension into ESRI ArcView and then running a sample session.
The documentation assumes the user has some knowledge of the ESRI ArcView
package as the different basic ArcView operations are referred to without
explanation. The user can find a full explanation of the ESRI ArcView operations
in the ESRI ArcView software guide.
In some cases the user may have to import additianl ESRI Extensions for ArcView
(Spatial Analysis, Database, etc.) which are normally available together with the
ESRI ArcView installation
2.1 Installation
The setup process comprises only one running of the installation file (Setup-
MapToxicity.exe). The user can use either the run command in WinXP Start-up
menu or by double-click the set-up file in Window Explorer. A familiar welcoming
window of IER Map Display installation process will be displayed and the user will
have to follow all instructions apearing on the computer screen.
If the installation file is not available, the user has an alternative to unzip intalation
file “Steup.zip” into C drive.
2.1.1 System Requirements
The user’s computer hardware and software should meet the following minimum
requirements.
(a) Hardware – PCU 1.2 MHz; RAM 256 MB; HD 20 GB. CD-ROM
Drive.
(d) Software – Window XP Home/Professional; ESRI ArcView GIS
v.3.2 with Spatial Analysis, Database extensions
The more powerful PC will enable the IER Map Display run faster and with better
performance.
Doc No Rev: 1 Date: December 2005 2
wlg1413863270.docToxcicity Analysis
2.1.2 Data Requirements
Data used by the IER Map Display are toxicity indexes obtained from chemical
and biological analysis of wastes discharged by 12 industrial zones located in
HCMC metropolis area
2.1.3 Layout of Folders
The organization of folders should
be in hierarchical order as follows.
o MapDisplay as parental level.
o Map-IndZones, ToxicityData and Help as secondary level folders.
A visual organization of the folders is presented in Figure 2.2.
2.2 Testing the Installation
If the installation of the IER Map Display Extension was successfully, the menus
and tools system of the ArcView will look like in Figure 2.3 when the user loads
the extension into a ArvView project map (the user is advised to refer to ArcView
User Guide for manage extensions in ArcView).
Figure 2-3 Pull-down menus and tools created by the extension.
Doc No Rev: 1 Date: December 2005 3
wlg1413863270.docToxcicity Analysis
Figure 2.2 Folder organization
The user has to follows every step described in the present report to make map
analysis using standard data provided in the Installation CD-ROM.
Doc No Rev: 1 Date: December 2005 4
wlg1413863270.docToxcicity Analysis
3 Using the Extension
3.1 General
The IER Map Display Extension is accessed by selecting the appropriate name
from the ArcView File pulldown menu and then clicking the ‘IER Map Display’
checkbox. When the extension starts up the user is presented with the display
shown in Figure 3-1. This consists of new tool item and e new button in addition
to default menus and tools of ESRI ArcView.
Figure 3-1 IER Map Display Extension start-up screen
Doc No Rev: 1 Date: December 2005 5
wlg1413863270.docToxcicity Analysis
3.2 Toxicity View
The IER Map Display Extension enables user to visualise the toxicity data
previously stored in a database file
Figure 3-2 Accessing IER Toxicity tool
When the toxicity tool is activated, by clicking the button , the user can press
left-mouse button at any of 12 industrial zones (green cycles on the map) to get
access to dialog window for examinning toxicity idexes as shown in Figure 3-3.
Figure 3-3 Window for starting displaying toxicity values.
Doc No Rev: 1 Date: December 2005 6
wlg1413863270.docToxcicity Analysis
Figure 3-4 Pull-down combo box for showing toxicity at other IZ.
The user can use this dialog window to brow to other IZ (Figure 3-4) for
examinning their toxicity parameter values or to displaying graphs to compare
toxicity levels from different IZs.
3.3 Analysis Toxicity Indexes
As stated in the previous section, by using graph button in the dialog window the
user can draw graphs to visually compare toxicity data sets. The user is also
provided with the facilities to locate what IZ wastes are at critical toxicity levels or
to display a variety of additional information and to change the configuration of
the view.
3.3.1 Displaying Critical Values of Toxcicity Indexes
A “X” sign is displayed closely to a value of index means that index has value
greater than allowed value (standard value or tolerance). An example of an IZ with
many critical toxicity levels is presented in Figure 3-5.
Doc No Rev: 1 Date: December 2005 7
wlg1413863270.docToxcicity Analysis
Figure 3-5 Critical values were identified by an “X” sign.
3.3.2 Graphically Comparison of Toxicity Indexes
The process to get graphs for comparison values of toxicity from different IZ is
started by pressing button “Do thi” located in the lower-left corner of the dialog
window (Figure 3.6).
Figure 3-6 Button “Do thi” for starting graph session.
Figure 3-7 Selection of index to be analysed.
Doc No Rev: 1 Date: December 2005 8
wlg1413863270.docToxcicity Analysis
Once the desired index is selected, the tool will draw a graph as shown in Figure 3-
8. The user then can use ESRI ArcView tools either to modify or to print the
graph.
Figure 3-8 Graph for toxicity comparison.
The user is expected to save the selected graphs to new names because all these
graphs will be removed in case the button “OK” is pressed.
3.4 Database Management
The IER Map Display Extension provides users with the facilities to manage the
toxicity databases including standard values by using the pull-doen menu (Figure 3-
9.
Doc No Rev: 1 Date: December 2005 9
wlg1413863270.docToxcicity Analysis
Figure 3-9 Pull-down menu for database management.
3.4.1 Update Tools
A summary of updating toxicity databases is as follows:
• Selection of item “Update Database” from the pull-down menu. The
dialog for updating DB will be displayed on the computer screen
• Browse to desired IZ by using the combo box “Khu Cong nghiep Khac”.
• Enter new data values wherever necessary.
• Press the button “Save” to replace old values with the new ones .
Figure 3-10 Dialog window for database management.
Doc No Rev: 1 Date: December 2005 10
wlg1413863270.docToxcicity Analysis
Figure 3-11 Dialog window for database management.
3.4.2 Tool for Updating Tolerance Database
The process to update standard values is similarly with the procedure for storing
new toxicity values. The only difference is the apperance of the dialog window
(Figure 3-12).
Figure 3-12 Dialog window for tolerance database management.
Doc No Rev: 1 Date: December 2005 11
wlg1413863270.docToxcicity Analysis
3.5 Getting Coordinates of Industrial Zones
The MRCS-IER Map Display Extension includes also a popup tool for manually
getting Cartesian coordinates of industrial zones. This tool will be available (Figure
3-13) when the user point the mouse to an IZ location on the map and right-click
the mouse. help.
Figure 3-13 The popup menu after pressing the right-button of the mouse.
The “Get Point Coordinate” item on the menu allows users to save the current
location’s X-Y coordinates into the toxicity database in a friendly procedure as
shown in Figures 3-14 and 3-15.
Doc No Rev: 1 Date: December 2005 12
wlg1413863270.docToxcicity Analysis
Figure 3-14 The list of IZ locations.
Figure 3-15 The popup menu confirmation window for updating coordinates.
3.6 Help System
In addition to the above mentioned tools, the MRCS-IER Map Display Extension
also provides help tools for improving users’ convenience. The help system can be
accessed at different locations and stages of the software using process.
Doc No Rev: 1 Date: December 2005 13
wlg1413863270.docToxcicity Analysis
4 Recommendations for Further
Developments
The present user guide was composed with the purpose to provide users of the
IER Map Display Series as detailed as possible the procedure to successfully
carrying out GIS analysis of toxicity data obtained previously from chemically,
mechanical and biological analysis of wastes discharged by HCMC industrial zones.
The user should have a minimum level of ESRI ArcView V3.20 user knowledge
and a sound acquaintance of file and folder management. A higher level of ESRI
ArcView and its extension such as Spatial Analysis, Geoprocessing, and Imagery
Data Format is desired.
Due to limited available time for the development, the present version of the
software is obviously still lacking a number of useful features. The future releases
of the package will rectify the following shortages.
• Vietnamese text in every interfaces, e.g. dialogs, labels, which will make
the software expectedly to be more user-friendly with Vietnamese;
• More statistical analysis of toxicity data;
• Development of wider toxicity databases which contains not only
physical, chemical and biological wastes analysis data but also other spatial
and temporal feature data related to the industrial zones, e.g. addresses,
industrial characteristics, population, etc.;
• Further development of the package in the direction of representation of
real environmental data of IZ in an advanced GIS technological package.
Doc No Rev: 1 Date: December 2005 14
wlg1413863270.docToxcicity Analysis