defond et al - 2002 - do non–audit service fees impair auditor independence - evidence from going concern audit opinions
Bạn đang xem bản rút gọn của tài liệu. Xem và tải ngay bản đầy đủ của tài liệu tại đây (163.07 KB, 28 trang )
Journal of Accounting Research
Vol. 40 No. 4 September 2002
Printed in U.S.A.
Do Non-Audit Service Fees Impair
Auditor Independence? Evidence
from Going Concern Audit
Opinions
M A R K L . D e F O N D ,∗ K . R A G H U N A N D A N ,†
A N D K . R . S U B R A M A N Y A M∗
Received 2 July 2002; accepted 15 July 2002
ABSTRACT
We find no significant association between non-audit service fees and impaired auditor independence, where auditor independence is surrogated by
auditors’ propensity to issue going concern audit opinions. We also find no
association between going concern opinions and either total fees or audit
fees. In addition, our findings are robust to controlling for unexpected fees,
to controlling for endogeneity among our variables, and to several alternative
research design specifications. Our results are consistent with market-based
incentives, such as loss of reputation and litigation costs, dominating the expected benefits from compromising auditor independence.
1. Introduction
Independent auditing is an essential feature of efficient capital markets
and regulators have long been concerned with potential threats to auditor
∗ University of Southern California, Los Angeles; † Texas A&M International University.
The authors appreciate helpful suggestions from Ray Ball, Julia D’Souza, Ken Gaver, Scott
Whisenant, Jerry Zimmerman, and participants at the University of Colorado-Boulder Winter
Conference and the 2002 International Symposium on Auditing Research. We also thank Liu
Zheng for research assistance.
1247
Copyright
C
, University of Chicago on behalf of the Institute of Professional Accounting, 2002
1248
M . L . D e F ond, K . RAGHUNANDAN, AND K . R . SUBRAMANYAM
independence.1 In the wake of the Enron bankruptcy, concerns about auditor independence have prompted Congress to enact legislation that bans
most auditor-provided non-audit services.2 Regulators’ concerns about nonaudit services are based on the assumption that auditors are willing to sacrifice their independence in exchange for retaining clients that pay large
non-audit fees. A problem with this assumption, however, is that it ignores
auditors’ expected costs of compromising their independence. In particular,
loss of reputation and litigation costs are likely to provide strong incentives
for auditors to maintain their independence. Therefore, the purpose of
this article is to investigate the veracity of regulators’ concerns by empirically examining the association between non-audit (and audit) fees paid
to incumbent auditors and auditor independence, where auditor independence is surrogated by the propensity of auditors to issue going concern
audit opinions.3
Before the recently enacted legislation, the Securities and Exchange Commission (SEC) attempted to curtail auditors from providing non-audit services by requiring listed companies to publicly disclose non-audit (and audit)
fees in proxy statements filed on or after February 5, 2001 (SEC [2000]). Although the SEC originally sought to ban non-audit services, it agreed to the
compromise solution of public disclosure in the belief that such disclosures
would attract the scrutiny of shareholders. Several recent research papers
use the newly available auditor fee data to empirically investigate whether
non-audit services threaten auditor independence (e.g., Chung and Kallapur [2001], Francis and Ke [2002], Frankel, Johnson, and Nelson [2002],
and Reynolds, Deis, and Francis [2002]). This line of research uses factors
commonly associated with earnings management, such as discretionary accruals and managers’ propensity to meet earnings targets, as indicators of
auditor independence. The results from this research, however, yield mixed
support for the contention that non-audit services impair auditor independence. We attempt to provide additional evidence on this issue by investigating another indicator of auditor independence—the auditor’s willingness
to issue a going concern audit opinion.
The audit report communicates the auditor’s findings to market participants and plays a crucial role in warning financial statement users of
impending going concern problems. Issuing a going concern opinion, however, means that the auditor must be able to objectively evaluate firm performance and withstand any client pressure to issue a clean opinion. This
1
For example, institutional incentives to maintain auditor independence have existed since
the times of the English Merchant Guilds, nearly 800 years ago (Watts and Zimmerman [1983]).
2 In April 2002 the U.S. House of Representatives passed a bill that prohibits auditors from
performing internal auditing and systems work, and in July 2002, the Senate approved a compromise version that that bans most non-audit services except tax work that is first approved by
the audit committee. The final legislation was signed into law by President Bush in July 2002.
3 Henceforth we use “non-audit services” to mean all non-audit services provided by the
incumbent auditor.
NON - AUDIT SERVICE FEES
1249
suggests that, ceteris paribus, the auditor’s propensity to issue a going concern
opinion is positively correlated with the auditor’s level of independence.
Thus, if regulators’ concerns are justified, non-audit service fees will be inversely related to the probability of auditors’ issuing going concern audit
reports. We test this hypothesis.
We also recognize that the cost-benefit trade-off implied by regulators’
concerns about non-audit fees extends to total fees. Implicitly, regulators are
concerned that auditors find the benefits of retaining clients who purchase
non-audit services exceed the costs of sacrificing auditor independence.4
Because the benefits of retaining these clients consist of the higher fees
they generate, this implies that higher total fees, regardless of their origin,
threaten auditor independence. Therefore, if regulators’ concerns are justified, total fees will be inversely related to the probability of auditors’ issuing
going concern audit reports. We test this hypothesis, also.
We perform our analysis on 1,158 distressed firms with proxy statements
that include audit fee disclosures, including 96 firms receiving first-time
going concern audit reports. As in prior research, we focus on distressed
firms because the going concern problem is a more salient decision among
this group. We test the hypotheses by including measures of non-audit service fees and total fees in logistic regressions that explain the issuance of
going concern opinions. We investigate the first hypothesis by examining
regressions that include two measures of non-audit fees: the log of non-audit
service fees and the ratio of non-audit service fees to total fees (henceforth,
the fee ratio). We also include fee ratio because the language in the SEC’s
disclosure regulations suggests that the SEC is concerned with the proportion
of non-audit fees to total client fees. Observing a negative relation between
our measures of non-audit service fees and going concern opinions would
provide support for our first hypothesis.
Similarly, we test the second hypothesis by examining regressions that either include the log of total fees or that disaggregate total fees into its two
components (the log of audit fees and the log of non-audit fees). We examine a disaggregated measure of total fees for two reasons. First, the second
hypothesis is predicated on the assumption that both audit and non-audit
fees are likely to impair auditor independence, and this assumption can only
be tested by looking separately at these components. Second, a regression
that examines the disaggregated components of total fees essentially tests
both of our hypotheses simultaneously. That is, we are able to see both the
association with total fees and the association with non-audit service fees
(after controlling for audit fees) in a single regression.5
4 To be plausible, these arguments must assume that the auditor receives economic rents
from the non-audit services they provide; otherwise, the auditor will be indifferent between
keeping or losing clients that pay higher fees. Simunic [1984] suggests that such rents may
come from “knowledge spillovers” that reduce auditors’ audit-related costs.
5 Another advantage of separately analyzing the components of total fees is that the signs
of the associations with going concern opinions could be different across the two measures. A
regression that includes the disaggregated measures would thus be better specified.
1250
M . L . D e F ond, K . RAGHUNANDAN, AND K . R . SUBRAMANYAM
Our results provide no support for either hypothesis. That is, we find no
evidence of a significant association between the auditor’s propensity to issue a going concern opinion and any of our fee measures. This finding is
robust to replacing all fee variables by their respective unexpected components, and after controlling for the simultaneity bias induced by endogeneity
among non-audit fees, audit fees, and going concern opinions.
We contribute to the current debate on auditor independence by finding no evidence that non-audit service fees adversely affect the auditor’s
opinion-formulation process. These findings are consistent with marketbased institutional incentives, such as costly shareholder litigation and loss
of reputation, dominating the expected benefits to auditors of compromising their independence. Thus, we find no support for regulators’ concerns
that non-audit services impair auditor independence.
We derive our conclusions from a research design that uses the auditor’s
propensity to issue a going concern opinion to proxy for auditor independence. In contrast to studies that use earnings management surrogates to
proxy for auditor independence, we argue that our proxy is more direct and
less noisy. Specifically, although studies investigating earnings management
assume that various earnings characteristics (e.g., discretionary accruals and
propensity to meet earnings targets) are evidence of auditor independence,
the auditor’s influence on client’s earnings characteristics is likely to be indirect, and there are empirical problems in measuring discretionary accruals
(Guay, Kothari, and Watts [1996], Dechow, Sloan, and Sweeney [1995],
Hribar and Collins [2002]).6 In contrast, the auditor clearly influences the
type of audit opinion, and measuring the audit opinion is unambiguous.
We acknowledge, however, that a potential limitation of our research design is that our tests may lack the power to reject our null hypotheses. For
example, it is conceivable that auditors who perform non-audit services are
more tolerant of earnings management, but draw the line at compromising the integrity of the audit opinion. It is also possible that the costs and
benefits to the auditor are stacked in favor of issuing the going concern
opinion. Thus, because we draw our conclusions based on the lack of finding a statistical association, we cannot rule out lack of power as an alternative
explanation for our findings.
The next section discusses the motivation for our analysis, section 3 describes our tests, section 4 presents our results, and section 5 summarizes
our findings.
2. Non-Audit Services and Auditor Independence
2.1
INCENTIVES FOR AUDITOR INDEPENDENCE
Auditor independence is often defined as the probability that the auditor will report a discovered breach in the financial reports (Watts and
6 We note that this limitation applies to other studies that also link discretionary accruals to
auditor behavior, such as Becker, DeFond, Jiambalvo, and Subramanyam [1998].
NON - AUDIT SERVICE FEES
1251
Zimmerman [1983, 1986]).This suggests that auditor independence is synonymous with auditor objectivity and the ability to withstand client pressure to acquiesce to substandard reporting. Jensen and Meckling [1976]
conclude that managers have incentives to reduce agency costs by hiring
independent auditors. Supporting this conclusion, Watts and Zimmerman
[1983] find evidence that 84% of New York Stock Exchange (NYSE) companies voluntarily engaged independent auditors in 1926, several years before
the Securities Acts that mandated external auditing. Thus, there is both theoretical and empirical evidence that managers find it in their best interests
to engage independent auditors.
A large body of theoretical and empirical research also suggests that auditors have market-based institutional incentives to act independently. For
example, Benston [1975] conjectures that reputation concerns are likely
to create incentives for independence, and Watts and Zimmerman [1983]
document several historical examples of auditors taking costly actions to
protect their reputation capital.7 More recently, reputation concerns are
consistent with Arthur Andersen’s client losses in the months following the
Enron collapse, as discussed in the following BusinessWeek quote (Weber,
Little, Henry, and Lavelle [2001], p. 32):
The Enron meltdown gives present and prospective clients an excuse to flee.
They may want to avoid the heightened attention an Andersen audit might
get in shareholder litigation or fear their financial reports could draw more
scrutiny from regulators if they’re handled by Andersen.
The threat of class action lawsuits provides another incentive for auditor
independence, particularly in U.S. capital markets, where Big 5 auditors
incurred more than $1 billion in litigation-related costs in 1993 alone (Antle, Griffen, Teece, and Williamson [1997]).8 Palmrose [1988], drawing on
theory from DeAngelo [1981], presents evidence consistent with Big 5 auditors’ reducing litigation exposure by increasing their independence. This
evidence is also consistent with Francis, Maydew, and Sparks [1996] and
Becker, DeFond, Jiambalvo, and Subramanyam [1998], who find that Big 5
auditors appear to constrain managers’ ability to exercise accounting discretion. Shu [2000] finds that auditors resign from clients (and hence forego
fee revenues) in response to both increases in litigation risk and emerging
mismatches with the clients. In summary, a large body of research finds that
outside auditors have market-based institutional incentives—particularly related to reputation and litigation costs—to remain independent of their
publicly held clients.
2.2
NON-AUDIT SERVICES AND AUDITOR INDEPENDENCE
Although there are market-based incentives for auditors to remain
independent, there are also forces that potentially threaten auditor
7 Also, Antle [1984] indicates that reputation is a likely enforcement mechanism for auditor
independence.
8 For expositional convenience, we use “Big 5” to refer to Big 5, Big 6, and Big 8 auditors.
1252
M . L . D e F ond, K . RAGHUNANDAN, AND K . R . SUBRAMANYAM
independence. Specifically, regulators are concerned about two effects of
non-audit services. One is a fear that non-audit service fees make auditors
financially dependent on their clients, and hence less willing to stand up to
management pressure for fear of losing their business.9 The other is that the
consulting nature of many non-audit services puts auditors in managerial
roles, potentially threatening their objectivity about the transactions they
audit. These concerns are summarized in the following quote from the SEC
regulations mandating fee disclosures (SEC [2000]):
An auditor’s interest in establishing or preserving a non-audit services relationship raises two types of independence concerns. First, the more the auditor
has at stake in its dealings with the audit client, the greater the cost to the
auditor should he or she displease the client, particularly when the non-audit
services relationship has the potential to generate significant revenues on top
of the audit relationship. Second, certain types of non-audit services, when
provided by the auditor, create inherent conflicts that are incompatible with
objectivity.10
Regulators’ concerns that auditors become financially dependent on their
clients are based on an intuitive cost-benefit trade-off. Regulators fear that
auditors will perceive that the benefits from retaining clients that pay large
non-audit service fees outweigh the expected costs of sacrificing their independence. As discussed earlier, the expected costs of sacrificed independence include the reputation loss and litigation costs associated with audit
failures. Although not explicitly stated, this argument is based on the assumption that non-audit service fees include economic rents. Otherwise,
auditors will be indifferent between keeping and losing their non-audit service clients. Simunic [1984] argues that auditor-provided management advisory services can generate economic rents because of “knowledge spillovers.”
Knowledge spillovers refer to information generated while performing management consulting services that can produce economic rents by reducing
auditing costs.
Simunic [1984] investigates whether spillovers exist by examining audit
fees. Although he finds evidence that audit fees are higher in the presence of
non-audit services—consistent with the existence of knowledge spillovers—
a later study by Palmrose [1986] provides evidence that audit fees are higher
even when clients engage consultants who are not incumbent auditors. Even
if the existence of spillovers is established, however, it is impossible to directly quantify the costs and benefits in the previously described trade-off.
9 However, Watts and Zimmerman [1983] report that requiring auditors to be financially
independent of their clients is, in historical terms, relatively new. As recently as 1844 the U.K.
Companies Act actually required auditors to be shareholders. Thus, financial dependence, per
se, does not necessarily threaten auditor independence.
10 The timing of the fee disclosure regulations is partially a response to a recent increase in
the amount of non-audit services provided by the Big 5. Levitt [2000] asserts that consulting
services of the Big 5 now represent more than 50% of their revenues, up from just 12% in
1977.
NON - AUDIT SERVICE FEES
1253
Therefore, it is ultimately an empirical question whether auditors compromise their independence to retain non-audit service clients.
One source of such empirical evidence is litigation against auditors. Supporting the contention that auditor-supplied consulting services do not result in substandard reporting, Palmrose [1999] finds no instances of lawsuits
against auditors that allege non-audit services impair independence. Similarly, of 610 cases of litigation against auditors examined in Antle, Griffen,
Teece, and Williamson [1997], only 24 mention that the auditors also provide non-audit services, and only 3 of those 24 allege that the non-audit
services impaired auditor independence. Thus, the evidence from class action lawsuits suggests that non-audit services are not an important source of
litigation against auditors.
In addition to the evidence from class action lawsuits, several recent studies examine the association between non-audit service fees and evidence
of earnings management (e.g., Chung and Kallapur [2001], Francis and
Ke [2002], Frankel, Johnson, and Nelson [2002], and Reynolds, Deis, and
Francis [2002]). Specifically, this line of research investigates whether companies that report higher levels of non-audit service fees are more likely to
report larger discretionary accruals and meet analysts’ earnings forecasts.
The results from these investigations, however, are ambiguous. For example,
although Frankel, Johnson, and Nelson [2002] find a positive association
between non-audit service fees and the magnitude of discretionary accruals, Chung and Kallapur [2001] do not find this association, and Francis
and Ke [2002] find that this relation is weakly significant, but only among
non–Big 5 auditors. Similarly, although Frankel, Johnson, and Nelson find
a positive association between non-audit service fees and managements’
propensity to meet analysts’ earnings forecasts, Reynolds, Deis, and Francis
[2002] fail to find such a relation.11 Thus, the evidence on whether nonaudit services is associated with increased levels of earnings management is
mixed.
Contrary to the concerns that fee dependency impairs auditor independence, Reynolds and Francis [2000] find evidence consistent with auditors increasing their independence in response to greater financial dependence. Specifically, they find that relatively larger audit clients—those for
which the auditor is expected to have the greatest financial dependence—
tend to report significantly lower discretionary accruals when compared
with smaller clients. The authors conjecture that this is because the reputation and litigation damages associated with audit failure are likely to be
greater for larger clients, providing incentives for auditors to be more conservative. In addition, they also find no evidence that auditors are more
lenient in issuing going concern reports to larger clients. Thus, Reynolds
11 Using a sample of U.K. companies, Gore, Pope, and Singh [2001] find a positive association between non-audit fees and earnings management for non-Big 5 auditors’ clients but not
for Big 5 auditors’ clients.
1254
M . L . D e F ond, K . RAGHUNANDAN, AND K . R . SUBRAMANYAM
and Francis find no evidence that financial dependency impairs auditor
independence.12
In summary, theory and evidence suggests that although auditors have
market-based incentives to remain independent, auditor independence may
be threatened when auditors provide non-audit services to their clients.
The evidence on whether non-audit services actually impair independence,
however, is inconclusive. In the next section, we argue that examining the
relation between non-audit service fees and the auditor’s propensity to issue
a going concern opinion is likely to provide additional evidence on this issue.
2.3
NON-AUDIT SERVICES AND GOING CONCERN AUDIT OPINIONS
The auditor’s report plays a critical role in warning market participants
of impending going concern problems. Indeed, the term audit failure typically refers to cases in which auditors fail to issue going concern opinions
to clients that subsequently file for bankruptcy (Blacconiere and DeFond
[1997], Weil [2001]). Statement of Auditing Standard (SAS) No. 59 (AICPA
[1988]) requires auditors to issue going concern modified audit opinions
when substantial doubt exists regarding the client’s ability to continue as a
going concern for one year beyond the financial statement date.13 Because
auditor independence is defined as the probability that the auditor will report a discovered breach in the financial reports (Watts and Zimmerman
[1983]), auditors with impaired independence are less likely to issue going concern opinions when such opinions are warranted. Thus, we test the
following hypothesis (in the alternative form):
H1: Ceteris paribus, non-audit service fees are inversely related to auditors’
propensity to issue going concern audit opinions.
Regulators are concerned that large non-audit service fees create incentives for auditors to reduce their independence. However, auditors also receive audit fees, and DeAngelo [1981] argues that the bilateral monopoly
created by nonzero auditor switching costs results in auditors’ receiving
economic rents from providing audit services. Thus, a logical extension of
regulators’ concerns about high non-audit service fees is that high total fees
potentially threaten auditor independence. Therefore, we also test the following hypothesis (in the alternative form):
H2: Ceteris paribus, total fees are inversely related to auditors’ propensity
to issue going concern audit opinions.
12 Further evidence that auditors tend to be conservative in response to client characteristics
is provided by Francis and Krishnan [1999], who find that that auditors are more likely to issue
going concern opinions for clients reporting larger total accruals. This finding is consistent
with auditor conservatism because there is more management judgment, and hence a greater
chance of financial statement error, in the presence of larger accruals.
13 SAS No. 59 (AICPA [1988]) became effective for periods beginning after January 1, 1989,
and provides specific guidance regarding the issuance of a going concern opinion.
NON - AUDIT SERVICE FEES
1255
3. Research Design
3.1
SAMPLE
We obtain our sample by first identifying all available proxy statements
filed with the SEC between February 5, 2001, and June 30, 2001, using the
search phrase “audit fees” in the Edgar Online database. To increase our
sample of going concern observations, we extend this date to October 31,
2001, for firms listed in the Compact Disclosure-SEC database as receiving first-time going concern opinions.14 This process results in a sample of
4,105 firms with fee information, including 160 with going concern opinions for fiscal-year 2000 financial statements but not for prior-year financial
statements.15 We then require the sample firms to have the necessary financial statement variables on the Compustat (industrial, full coverage, and
research) databases, stock return variables on the Center for Research in
Security Prices (CRSP) database, mergers and new issues variables on the
SDC database, and institutional ownership variables on the Wharton WRDS
14F database. After deleting financial institutions and all firms that change
year-end, these procedures yield a preliminary sample of 2,428 firms, including 100 with first-time going concern opinions.
As in prior research, we limit our analysis to a sample of financially distressed firms in evaluating the auditor’s probability of issuing a first-time going concern opinion (Hopwood, McKeown, and Mutchler [1994], Mutchler,
Hopwood, and McKeown [1997], Reynolds and Francis [2000]). This is because the going concern opinion decision is most salient among distressed
firms. As in Reynolds and Francis [2000], we define financially distressed
firms as firms that report either negative earnings or operating cash flows
during the current fiscal year. After restricting the analysis to distressed firms
(as defined earlier), we have a usable sample of 1,158 firms, including 96
with first-time going concern opinions.
3.2
GOING CONCERN MODEL
We test our hypotheses by estimating the coefficients in the following
logistic regression that models the auditor’s probability of issuing a firsttime going concern opinion to a financially distressed client:
OPINION = β0 + β1 (PROBANKZ) + β2 (log(ASSETS)) + β3 (log(AGE ))
+ β4 (BETA) + β5 (RETURN) + β6 (VOLATILITY ) + β7 (LEV )
+ β8 (CLEV) + β9 (LLOSS) + β10 (INVESTMENTS )
+ β11 (FUTURE FINANCE) + β12 (BIG 5 )
+ β13 (OP CASH FLOW ) + β14 (REPORT LAG )
14
15
In general, distressed firms tend to file their proxies later in the year.
Some of our sample firms have fiscal year-ends occurring in early 2001.
1256
M . L . D e F ond, K . RAGHUNANDAN, AND K . R . SUBRAMANYAM
+ β15 (FEERATIO) + β16 (log(TOTAL FEE ))
+ β17 (log(AUDIT FEE)) + β18 (log(NON-AUDIT FEE )) + ε
(1)
where:
OPINION
= an indicator variable equal to 1 for firms with
going concern audit opinions, and 0 otherwise
PROBANKZ
= probability of bankruptcy score (Zmijewski
[1984])
log(ASSETS)
= natural logarithm of total assets at the end of
the year measured in millions of dollars
log(AGE)
= natural logarithm of the number of years since
the company was listed on a stock exchange
BETA
= the firm’s beta estimated using a market model
over the fiscal year
RETURN
= the firm’s stock return over the fiscal year
VOLATILITY
= the variance of the residual from the market
model over the fiscal year
LEV
= total liabilities over total assets at the end of the
fiscal year
CLEV
= change in LEV during the year
LLOSS
= an indicator variable equal to 1 when the firm
reports a bottom-line loss for the previous year,
and 0 otherwise
INVESTMENTS
= short- and long-term investment securities (including cash and cash equivalents) deflated by
total assets at year-end
FUTURE FINANCE
= an indicator variable equal to 1 when the firm
issues equity or debt in the subsequent year
(through October 31, 2001)
BIG 5
= an indicator variable equal to 1 when the auditor is a member of the Big 5, and 0 otherwise
OP CASH FLOW
= operating cash flows divided by total assets at
fiscal year end
REPORT LAG
= number of days between fiscal year-end and
earnings announcement date
FEERATIO
= the ratio of non-audit fees to total fees paid to
the incumbent auditor
log(TOTAL FEE)
= the natural logarithm of the sum of audit and
non-audit fees paid to the incumbent auditor
log(AUDIT FEE)
= the natural logarithm of the audit fee paid to
the incumbent auditor
log(NON-AUDIT FEE) = the natural logarithm of the sum total of all nonaudit fees paid to the incumbent auditor.
NON - AUDIT SERVICE FEES
1257
The last four variables in the model—FEERATIO, log(TOTAL FEE),
log(AUDIT FEE) and log(NON-AUDIT FEE)—are added to the model in
various combinations to test the two hypotheses. If non-audit service fees
impair auditor independence, we expect a negative coefficient on FEERATIO and log(NON-AUDIT FEE). If total fees impair auditor independence,
we expect a negative coefficient on log(TOTAL FEE) and on its separate
components, log(AUDIT FEE) and log(NON-AUDIT FEE).
The choice of independent variables in the going concern model is motivated by the “contrary” and “mitigating” factors identified in SAS No.
59 (AICPA [1988]) and includes many variables used in prior research
(e.g., Dopuch, Holthausen, and Leftwich [1987], Mutchler, Hopwood, and
McKeown [1997], Reynolds and Francis [2000]). SAS No. 59 defines “contrary” factors as those suggesting a going concern opinion is appropriate and
“mitigating” factors as those mitigating the circumstances that suggest a going concern opinion. Financial distress is an important contrary factor mentioned in SAS No. 59, and we capture financial distress using several financial
statement and market variables. PROBANKZ is the probability of bankruptcy
score from Zmijewski [1984], with higher values indicating a higher probability of bankruptcy. The log(AGE) variable is the log of the number of years
the company has been publicly traded and is included because younger firms
are more prone to failure (Dopuch, Holthausen, and Leftwich [1987]). We
also include the following three market-based measures following Dopuch,
Holthausen, and Leftwich, [1987]: BETA, which is the systematic risk of the
firm’s stock return; RETURN, which is the stock return over the fiscal year;
and VOLATILITY, which is the return volatility of the company’s stock. We
predict that RETURN is negatively associated with OPINION, and we predict
that BETA and VOLATILITY are positively associated with OPINION.
Other contrary factors in our model include LEV and CLEV because
Mutchler, Hopwood, and McKeown [1997] find that debt covenant violations are positively associated with the probability of issuing a going concern
opinion. We include LEV to capture proximity to covenant violation because
firms close to violation are likely to have high leverage (Beneish and Press
[1993]), and we include CLEV because increases in leverage are likely to
move firms closer to covenant violation (Reynolds and Francis [2000]). As
in Reynolds and Francis [2000], we also include LLOSS (a dummy indicating a loss in the prior year) because firms with multiple-year losses are more
likely to fail.16 We include OP CASH FLOW (operating cash flows divided by
total assets) because poor operating cash flows are often associated with the
probability of bankruptcy, and the Zmijewski [1984] bankruptcy score does
not include a cash-flow measure.17 In addition, we include REPORT LAG
16 We do not include a dummy for current-year loss because our sample-selection criterion
is based on the firm incurring a loss (or negative operating cash flow) during the current year.
17 An alternative measure of the probability of bankruptcy that considers cash flows is that
in Ohlson [1980]. However, the Ohlson measure yields an extremely narrow distribution of
high bankruptcy probabilities in our sample of distressed firms. Therefore, we use the score
1258
M . L . D e F ond, K . RAGHUNANDAN, AND K . R . SUBRAMANYAM
(number of days between the fiscal year-end and the earnings announcement date) because prior research finds that going concern opinions are
associated with longer reporting delays (Raghunandan and Rama [1995],
Carcello, Hermanson, and Huss [1995]).
In addition, we include several factors that are likely to mitigate the
probability of receiving a going concern opinion. The log of total assets
(log(ASSETS)) is included because large firms have more negotiating power
in the event of financial difficulties and hence are more likely to avoid
bankruptcy (Reynolds and Francis [2000]). INVESTMENTS is the sum of
the firm’s cash and investment securities (long and short term), scaled by
total assets, and is a liquidity measure that captures the ability to quickly
raise cash. It is included because firms with large cash and investment securities have more resources to stave off bankruptcy in the event of financial
difficulties.18 FUTURE FINANCE captures firms in our sample that issue new
debt or equity securities (public or private) through October 31, 2001 (the
last day of available information for our sample firms at the time of our analysis). This variable is included because Mutchler, Hopwood, and McKeown
[1997] find that new financing (and refinancing) is a mitigating factor that
reduces the probability of bankruptcy. We also include BIG 5, an indicator
variable equal to 1 if the auditor is a member of the Big 5, and 0 otherwise.
This variable is included because prior research argues that Big 5 auditors
are more likely to issue going concern audit opinions (Mutchler, Hopwood,
and McKeown [1997]).
4. Results
4.1
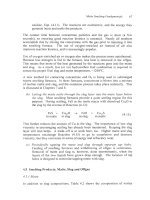
DESCRIPTIVE STATISTICS FOR FULL SAMPLE
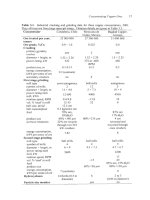
Table 1 presents descriptive statistics on the full sample for the variables
used in our going concern model in equation (1). We winsorize all continuous variables at the 99th percentile of their absolute values prior to limiting
the sample to distressed firms. The first four rows present the measures of
audit and non-audit fees used in our analysis. Row 1 indicates that the mean
and median values of FEERATIO are 49% and 51%, respectively. These ratios are comparable to the mean and median fee ratios reported in Frankel,
Johnson, and Nelson [2002]. Row 2 reports that the mean and median
values of TOTAL FEE are $920,000 and $380,000, respectively. Our sample
from Zmijewski [1984], which yields a wider distribution of scores and thus appears better at
distinguishing the relative degree of distress among our sample firms.
18 Because the 2001 Compustat database is still unavailable, we do not have financial statement data to measure the magnitude of subsequent asset sales, a mitigating factor suggested in
Mutchler, Hopwood, and McKeown [1997] and used in Reynolds and Francis [2000]. However,
we believe that INVESTMENTS is a variable that captures the underlying economics of the “sales
of fixed assets.” That is, our INVESTMENTS variable captures the ability of the firm to quickly
raise cash in the event of financial difficulties. In addition, an advantage of INVESTMENTS
over assets sales is that INVESTMENTS is an ex ante measure and thus likely to be more relevant
to the auditor’s opinion-formulation decision.
NON - AUDIT SERVICE FEES
1259
TABLE 1
Descriptive Statistics for 1,158 Financially Distressed Firms (Including 96 Firms with Going Concern
Opinions) with Available Auditor Fee Information for Fiscal Year 2000 a
Full Sample (n = 1,158)
Variables
Mean
Med.
SD
Max.
Min.
1. FEERATIO
2. TOTAL FEE ($ thousands)
3. NON-AUDIT FEE ($ thousands)
4. AUDIT FEE ($ thousands)
5. OPINION
6. PROBANKZ
7. ASSETS ($ millions)
8. AGE (years listed)
9. BETA
10. RETURN
11. VOLATILITY
12. LEV
13. CLEV
14. LLOSS
15. INVESTMENTS
16. FUTURE FINANCE
17. BIG 5
18. OP CASH FLOW
19. REPORT LAG
0.49
920
616
302
0.08
0.22
813
7
1.1
−0.35
0.01
0.48
−0.12
0.68
0.31
0.08
0.91
−0.14
53.50
0.51
380
183
160
0.00
0.03
110
4
1.0
−0.53
0.00
0.44
0.02
1
0.22
0.00
1.00
−0.05
46
0.25
2,133
1,732
472
0.28
0.34
2,982
9
0.9
0.63
0.00
0.34
0.58
0.46
0.29
0.27
0.29
0.27
24.13
0.98
29,400
24,200
4,900
1
1.00
31,691
38
3.3
3.13
0.02
1.92
2.19
1
0.94
1
1
0.52
108
0.00
10
0
5
0
0.00
2
1
−1.0
−0.99
0.00
0.01
−2.60
0
0.00
0
0
−1.22
10
a
Financial distress is defined as a loss or negative operating cash flow in the current year. Variables are
defined as follows:
FEERATIO = the ratio of non-audit fees to total fees paid to the incumbent auditor
TOTAL FEE = the sum of audit and non-audit fees paid to the incumbent auditor
NON-AUDIT FEE = the sum total of all non-audit fees paid to the incumbent auditor
AUDIT FEE = the audit fee paid to the incumbent auditor
OPINION = an indicator variable equal to 1 for firms with going concern audit opinions, and 0 otherwise
PROBANKZ = probability of bankruptcy score (Zmijewski [1984])
ASSETS = total assets at the end of the year measured in millions of dollars
AGE = number of years since the company was listed in a stock exchange
BETA = the firm’s beta estimated using a market model over the fiscal year
RETURN = the firm’s stock return over the fiscal year
VOLATILITY = the variance of the residual from the market model over the fiscal year
LEV = total liabilities over total assets at the end of the fiscal year
CLEV = change in LEV during the year
LLOSS = an indicator variable equal to 1 when the firm reports a bottom-line loss for the previous year,
and 0 otherwise
INVESTMENTS = short- and long-term investment securities (including cash and cash equivalents)
deflated by total assets at the end of the fiscal year
FUTURE FINANCE = an indicator variable equal to 1 when the firm issues equity or debt in the subsequent
year (as of October 31, 2001)
BIG 5 = an indicator variable equal to 1 when the auditor is a member of the Big 5, and 0 otherwise
OP CASH FLOW = operating cash flows divided by total assets at fiscal year end
REPORT LAG = number of days between fiscal year-end and earnings announcement date.
firms report smaller total fees compared with those reported in Frankel,
Johnson, and Nelson, consistent with the distressed nature of our sample
firms. Rows 3 and 4 report mean and median values of NON-AUDIT FEE
of $616,000 and $183,000, and mean and median values of AUDIT FEE of
$302,000 and $160,000, respectively. As with total fees, the means and medians of the fee variables in our sample tend to be lower than those found
in Frankel, Johnson, and Nelson.
1260
M . L . D e F ond, K . RAGHUNANDAN, AND K . R . SUBRAMANYAM
Row 5 in table 1 shows that 8% of our sample receives going concern opinions, which is comparable to Reynolds and Francis [2000], who find that 9%
of their financially distressed sample receives going concern opinions. Row
6 indicates that the mean and median bankruptcy probability scores in our
sample are .22 and .03, respectively. Row 7 indicates that mean and median
firm sizes, measured in total assets, are $813 million and $110 million, indicating a skewed distribution and justifying our decision to log assets in
our logit analysis. Row 8 indicates that our sample firms have been listed
for 1 to 38 years. Row 9 reports that the mean and median values for BETA
are close to 1.0. Row 10 indicates that the mean and median stock returns
during the prior year are –35% and –53%, respectively, indicating that our
sample firms recently experienced significant loss of market value. Row 11
reports that VOLATILITY is comparable to that reported in earlier research
for distressed firms.
Rows 12 and 13 indicate that mean and median values of leverage are 0.48
and 0.44, respectively, and that the median change in leverage is relatively
small. It is not surprising that row 14 reports that prior-period losses are
relatively frequent among our distressed sample. Row 15 reports that mean
and median values for INVESTMENTS are 31% and 22%, respectively, and
row 16 indicates that an average of 8% of our sample firms obtain additional
outside financing in the future. Row 17 reports that 91% of our sample has
a Big 5 auditor. Row 18 reports that mean and median operating cash flows
divided by total assets (OP CASH FLOW ) are negative, which reflects our
sample-selection criteria. Finally, REPORT LAG averages 53.5 days, which
is larger than average, consistent with the preponderance of losses in our
sample (Chambers and Penman [1984]).
4.2
DESCRIPTIVE STATISTICS BY OPINION TYPE
Table 2 classifies the variables from Table 1 by opinion type, along with
p-values from t-tests and median tests of differences across the two groups.
Comparing the fee variables in the first four rows represents univariate tests
of our hypotheses. Row 1 indicates that the mean and median values for
FEERATIO are 38% and 40%, respectively, for the going concern sample,
compared with 50% and 53% for the clean opinion sample, with the differences significant at p < 1% (two-tailed). Row 2 shows that the mean and
median values for TOTAL FEE are $540,000 and $234,000, respectively, for
the going concern sample, and $954,000 and $393,000 for the clean opinion sample. The difference between the means is significant at p < 10%
(two-tailed), and the difference between the medians is significant at p <
1% (two-tailed). Row 3 indicates that the mean and median values of NONAUDIT FEE are $274,000 and $83,000, respectively, for the going concern
sample, and $646,000 and $198,000 for the clean opinion sample. The difference between the means is significant at p < 5% (two-tailed), and the
difference between the medians is significant at p < 1% (two-tailed). Row 4
indicates that both the mean and median values of AUDIT FEE are not significantly different between the two opinion types. Thus, univariate tests
NON - AUDIT SERVICE FEES
1261
TABLE 2
Comparison of Going Concern and Clean Opinion Samples for 1,158 Financially Distressed Firms
(Including 96 Firms with Going Concern Opinions) with Available Auditor Fee Information for Fiscal
Year 2000 a
Mean
Variables
1. FEERATIO
2. TOTAL FEE ($ thousands)
3. NON-AUDIT FEE ($ thousands)
4. AUDIT FEE ($ thousands)
5. OPINION
6. PROBANKZ
7. ASSETS ($ millions)
8. AGE (years listed)
9. BETA
10. RETURN
11. VOLATILITY
12. LEV
13. CLEV
14. LLOSS
15. INVESTMENTS
16. FUTURE FINANCE
17. BIG 5
18. OP CASH FLOW
19. REPORT LAG
Median
GC
Sample
No GC
Sample
p-value
GC
Sample
No GC
Sample
p-value
0.38
540
274
266
1
0.66
178
7
1.13
−0.68
0.01
0.75
0.20
0.82
0.20
0.06
0.88
−0.37
76
0.50
954
646
305
0
0.18
870
5
0.94
−0.32
0.01
0.46
−0.15
0.67
0.32
0.08
0.91
−0.12
51
.00
.06
.04
.44
N/A
.00
.00
.47
.03
.00
.00
.00
.00
.00
.00
.52
.24
.00
.00
0.40
234
83
138
1
0.84
43
4
0.99
−0.78
0.01
0.71
0.13
1
0.13
0.00
1
−0.23
89
0.53
393
198
164
0
0.02
118
5
0.97
−0.51
0.00
0.41
0.02
1
0.23
0.00
1
−0.05
46
.00
.00
.00
.12
N/A
.00
.00
.31
.09
.00
.00
.00
.00
.00
.00
.52
.23
.00
.00
a
Financial distress is defined as a loss or negative operating cash flow in the current year. All p-values
are two-tailed. See table 1 for variable descriptions.
are consistent with regulators’ concerns that non-audit service fees impair
auditor independence, and they provide some evidence that total fees also
threaten independence. A problem with drawing conclusions from univariate tests, however, is that they fail to control for the numerous contrary
and mitigating factors associated with the auditor’s decision to issue a going
concern opinion. Thus, we rely on the multivariate tests to formally test our
hypotheses.
It is not surprising that row 6 in table 2 indicates that the mean and median
bankruptcy scores are significantly higher among the going concern sample
at p < 1% (two-tailed). Row 7 indicates that mean and median total assets are
significantly smaller among the going concern sample at p < 1% (two-tailed),
and row 8 shows that there is no significant difference in age across the two
opinion types. Rows 9–11 indicate that mean and median values of BETA are
higher among the going concern sample at p < 5% and p < 10% (two-tailed),
respectively, and that mean and median values for RETURN are significantly
lower and that mean and median values for VOLATILITY are significantly
higher, among the going concern firms at p < 1% (two-tailed). This suggests
that the going concern firms have lower stock returns and higher volatility
than firms with clean opinions. Consistent with expectations, rows 12 and 13
find that the going concern firms have higher leverage (LEV ) and a larger
1262
M . L . D e F ond, K . RAGHUNANDAN, AND K . R . SUBRAMANYAM
increase in leverage (CLEV ), both significant at p < 1% (two-tailed) for both
the t-tests and the median tests.
Row 14 indicates that the mean relative frequency of prior-year losses is
significantly higher among the going concern firms at p < 1% (two-tailed).
Consistent with expectations, row 15 shows that INVESTMENTS is significantly lower at p < 1% (two-tailed) among the going concern firms, suggesting that firms with less liquidity are more likely to receive going concern
opinions. Rows 16 and 17 reveal that the likelihood of obtaining future financing (FUTURE FINANCE) and the relative frequency of Big 5 auditors
(BIG 5) is not different across the two groups. As expected, rows 18 and 19
indicate that mean and median values of OP CASH FLOW are significantly
lower and that REPORT LAG is significantly longer among the sample with
going concern opinions at p < 1% (two-tailed).
In summary, the descriptive statistics presented in tables 1 and 2 are consistent with the distressed nature of our total sample and with the going concern sample being even more distressed. In addition, although univariate
tests provide some support for our hypotheses, these results are unreliable
because they do not control for other factors affecting the auditor’s decision
to issue a going concern opinion.
4.3
MULTIVARIATE TEST RESULTS
Table 3 presents the results of estimating the logistic model in equation (1)
using alternative fee measures to test our hypotheses. Model 1 presents a
baseline case of our going concern model without including the fee variables, and models 2–5 sequentially introduce various combinations of our
fee variables, with model 5 simultaneously testing both of our hypotheses.
The Marginal Effect columns in table 3 provide some evidence on the economic significance of each of the coefficients. These statistics represent the
change in probability of a going concern opinion in response to a onestandard-deviation change in each of the respective independent variables,
evaluated at the base-rate probability of the going concern opinion (8%).
The results indicate that model 1 does a reasonably good job of explaining
the going concern decision. The pseudo R2 is 41%, and we find significance
in the predicted direction at p < 10% (two-tailed) for the coefficients on
PROBANKZ, RETURN, VOLATILITY, LLOSS, INVESTMENTS, BIG 5, and REPORT LAG. Consistent with prior research, we do not find significance in
the predicted direction for the coefficients on BETA (Dopuch, Holthausen,
and Leftwich [1987]) and CLEV (Reynolds and Francis [2000]). In addition,
we do not find significance for the coefficients on log(ASSETS), log(AGE),
LEV, FUTURE FINANCE, or OP CASH FLOW. The marginal effects suggest
that PROBANKZ, RETURN, INVESTMENTS, and REPORT LAG are the most
economically significant variables in the model.
Models 2–5 introduce the following combinations of our fee ratios to
the model: FEERATIO alone, log(TOTAL FEE) alone, both FEE RATIO and
log(TOTAL FEE), and both log(AUDIT FEE) and log(NON-AUDIT FEE), respectively. The results in models 2–5 indicate that the estimated coefficients
TABLE 3
Going Concern Opinion Models, with Auditor Fee Variables Included as Independent Variables, for a Sample of 1,158 Financially Distressed Firms (Including 96 Firms with
Going Concern Opinions) with Available Auditor Fee Information for Fiscal Year 2000 a
Model 1
Predicted
Sign
PseudoR2 %
+
−
−
+
−
+
+
+
+
−
−
+
−
+
−
−
−
−
Model 3
Marginal
Effect
Coefficient
( p-value)
Marginal
Effect
−6.304 (.00)
1.773 (.00)
−0.141 (.24)
0.075 (.64)
0.017 (.93)
−1.209 (.00)
84.466 (.02)
−0.194 (.71)
0.471 (.24)
0.567 (.09)
−2.052 (.00)
0.222 (.68)
0.932 (.03)
−0.710 (.18)
0.026 (.00)
4.6%
−1.9%
0.6%
0.1%
−5.8%
2.4%
−0.5%
2.1%
2.0%
−4.6%
0.5%
2.1%
−1.4%
4.8%
−6.212 (.00)
1.791 (.00)
−0.113 (.37)
0.051 (.76)
0.020 (.92)
−1.215 (.00)
82.947 (.02)
−0.212 (.68)
0.460 (.26)
0.553 (.11)
−2.033 (.00)
0.213 (.69)
0.962 (.03)
−0.745 (.16)
0.025 (.00)
−0.438 (.49)
4.6%
−1.5%
0.4%
0.1%
−5.7%
2.3%
−0.5%
2.0%
1.9%
−4.5%
0.4%
2.1%
−1.5%
4.7%
−0.7%
Model 4
Model 5
Coefficient
( p-value)
Marginal
Effect
−6.314 (.00)
1.772 (.00)
−0.144 (.38)
0.075 (.64)
0.016 (.94)
−1.208 (.00)
84.462 (.02)
−0.194 (.71)
0.471 (.24)
0.567 (.09)
−2.052 (.00)
0.223 (.67)
0.932 (.03)
−0.708 (.19)
0.026 (.00)
4.6%
−1.8%
0.6%
0.1%
−5.7%
2.4%
−0.5%
2.1%
2.0%
−4.6%
0.5%
2.0%
−1.4%
4.8%
0.0%
−6.363 (.00)
1.782 (.00)
−0.145 (.38)
0.052 (.75)
0.012 (.95)
−1.204 (.00)
82.596 (.02)
−0.221 (.67)
0.457 (.26)
0.551 (.11)
−2.027 (.00)
0.219 (.68)
0.959 (.03)
−0.728 (.17)
0.026 (.00)
−0.513 (.45)
0.063 (.77)
4.6%
−1.9%
0.4%
0.1%
−5.7%
2.3%
−0.6%
2.0%
1.9%
−4.5%
0.5%
2.1%
−1.5%
4.7%
−0.9%
0.6%
41%
41%
Coefficient
( p-value)
Marginal
Effect
−6.701 (.00)
1.808 (.00)
−0.135 (.41)
0.042 (.80)
−0.007 (.97)
−1.188 (.00)
82.770 (.02)
−0.257 (.62)
0.453 (.26)
0.554 (.11)
−1.988 (.00)
0.198 (.71)
0.981 (.02)
−0.742 (.16)
0.026 (.00)
4.7%
−1.8%
0.4%
−0.1%
−5.7%
2.3%
−0.5%
2.0%
1.9%
−4.5%
0.5%
2.1%
−1.5%
4.7%
0.180 (.39)
−0.099 (.28)
40%
Marginal
Effect
0.004 (.98)
41%
Coefficient
( p-value)
1.2%
−1.4%
40%
NON - AUDIT SERVICE FEES
Intercept
PROBANKZ
log(ASSETS)
log(AGE)
BETA
RETURN
VOLATILITY
LEV
CLEV
LLOSS
INVESTMENTS
FUTURE FINANCE
BIG 5
OP CASH FLOW
REPORT LAG
FEERATIO
log(TOTAL FEE)
log(AUDIT FEE)
log(NON-AUDIT FEE)
Model 2
Coefficient
( p-value)
a
1263
Financial distress is defined as a loss or negative operating cash flow in the current year. All p-values are two-tailed, and the marginal effect indicates the effect of a one-standarddeviation change in the respective variable on the probability of a going concern opinion. See table 1 for variable definitions.
1264
M . L . D e F ond, K . RAGHUNANDAN, AND K . R . SUBRAMANYAM
on all of our fee variables are insignificant in every case. The lack of significance on FEERATIO in models 2 and 4 and on log(NON-AUDIT FEE) in
model 5 indicates that we do not find support for the first hypothesis. The
lack of significance on log(TOTAL FEE) in models 3 and 4 and on both
log(AUDIT FEE) and log(NON-AUDIT FEE) in model 5 indicates that we
also do not find support for the second hypothesis. Because both hypotheses are tested in model 5, the lack of significance on the fee variables in that
regression presents concise evidence that we are unable to support either
hypothesis that fees impair auditor independence.
4.4
CONTROLLING FOR EXPECTED FEES
A potential limitation of the analysis in table 3 is that auditor independence may be influenced by the amount of client fees relative to their expected
amounts, rather than the nominal amounts we examine. This notion is consistent with auditors’ being influenced by whether the client is a source
of unusually high or low fees. Therefore, we draw on prior research that
models audit and non-audit fees to develop a model that extracts the unexpected portion of fees in our sample firms. Specifically, we draw on Craswell,
Francis, and Taylor [1995] and Whisenant, Sankaraguruswamy, and Raghunandan [2002] to identify variables explaining audit fees, and Firth [1997],
Parkash and Venable [1993], Whisenant, Sankaraguruswamy, and Raghunandan [2002], and Frankel, Johnson, and Nelson [2002] to identify variables explaining non-audit fees and the ratio of non-audit fees to total audit
fees. Drawing on these sources, and considering additional variables we expect to be important fee determinants, we estimate the following models
for audit and non-audit fees, respectively:
log(AUDIT FEE) = β0 + β1 (log(ASSETS)) + β2 (BIG 5 ) + β3 (ROA )
+ β4 (RETURN) + β5 (VOLATILITY ) + β6 (LEV )
+ β7 (INVREC) + β8 (INSTITUTIONAL )
+ β9 (SPECIAL ITEMS) + β10 (BOOK TO MKT )
+ β11 (SEGS) + β12 (FOROPS ) + β13 (EMPLAN )
+ β14 (REPORT LAG) + β15 (INITIAL YEARS ) + ε
where:
ROA
(2)
= return on assets defined as operating income divided
by total assets at fiscal year end
INVREC
= inventory plus accounts receivable divided by total
assets at fiscal year-end
INSTITUTIONAL = the percentage of institutional holdings at fiscal year
end
SPECIAL ITEMS = indicator variable equal to the absolute value of negative special items divided by total assets, and 0 otherwise at fiscal year end
NON - AUDIT SERVICE FEES
BOOK TO MKT
SEGS
FOROPS
EMPLAN
INITIAL YEARS
1265
= the book-to-market ratio at the fiscal year end
= the number of segments disclosed in the segment
footnote
= an indicator variable equal to 1 if the company has
foreign operations, and 0 otherwise
= an indicator variable equal to 1 if the company has a
pension or post-retirement plan, and 0 otherwise.
= an indicator variable equal to 1 if it is the initial two
years of the audit engagement, and 0 otherwise.
All other variables are as described in equation (1).
log(NON-AUDIT FEE ) = β0 + β1 (log(ASSETS )) + β2 (BIG 5 ) + β3 (ROA )
+ β4 (RETURN) + β5 (LEV )
+ β6 (INSTITUTIONAL ) + β7 (SPECIAL ITEMS )
+ β8 (BOOK TO MKT ) + β9 (SEGS )
+ β10 (FOROPS ) + β11 (EMPLAN )
+ β12 (INITIAL YEARS ) + β13 (MERGER )
+ β14 (FINANCE ) + β15 (SALES GROWTH ) + ε
(3)
where:
log( NON-AUDIT FEE) = as defined in equation (1), and alternately substituted with FEERATIO
MERGER
= an indicator variable equal to 1 if the client acquired a company during the fiscal year
FINANCE
= an indicator variable equal to 1 if the firm issued
equity or debt during the fiscal year
SALES GROWTH
= growth rate in sales over the prior year.
All other variables are as described in equations (1) or (2).
Both estimated models also include 11 industry dummy variables (not reported in the model specification or in the tables). The model of audit fees
in equation (2) is estimated with log(AUDIT FEE) as the dependent variable. The model of non-audit fees in equation (3) is alternately estimated
with log(NON-AUDIT FEE) and FEERATIO as the dependent variable. Equation (3) is used to explain FEERATIO because FEERATIO is a scaled measure
of non-audit fees. The independent variables in equations (2) and (3) are
combined in a single model and estimated with log(TOTAL FEE) as the dependent variable. The coefficients based on these four models are shown in
table 4. The results indicate that each of the models has reasonable explanatory power, with adjusted R2 s ranging from 36% to 72%, and most of the coefficients are significant and in the expected direction at conventional levels.
1266
M . L . D e F ond, K . RAGHUNANDAN, AND K . R . SUBRAMANYAM
TABLE 4
Fee Expectation Models for a Sample of 1,158 Financially Distressed Firms (Including 96 Firms with
Going Concern Opinions) with Available Auditor Fee Information for Fiscal Year 2000 a
Predicted
Sign
log(ASSETS)
BIG5
ROA
RETURN
VOLATILITY
LEV
INVREC
INSTITUTIONAL
SPECIAL ITEMS
BOOK TO MKT
SEGS
FOROPS
EMPLAN
REPORT LAG
INITIAL YEARS
MERGER
FINANCE
SALES GROWTH
Adjusted R2 %
log (AUDIT
FEE)
log (NONAUDIT FEE)
FEERATIO
log (TOTAL
FEE)
+
+
?
−
+
+
+
+
+
−
+
+
+
+
−
+
+
+
0.424 (.00)
0.126 (.04)
−0.274 (.00)
−0.121 (.00)
7.945 (.14)
0.237 (.00)
0.584 (.00)
0.061 (.48)
0.290 (.09)
−0.021 (.08)
0.034 (.00)
0.242 (.00)
0.112 (.02)
0.003 (.00)
−0.105 (.03)
0.713 (.00)
0.515 (.00)
−0.399 (.00)
−0.247 (.00)
0.062 (.00)
0.064 (.00)
−0.033 (.08)
−0.019 (.08)
−0.045 (.74)
−0.057 (.00)
0.367 (.06)
0.669 (.09)
−0.030 (.27)
0.034 (.03)
0.413 (.00)
−0.024 (.83)
0.050 (.09)
0.041 (.49)
−0.004 (.33)
−0.000 (.86)
0.022 (.28)
−0.023 (.18)
−0.152 (.18)
0.073 (.41)
0.747 (.00)
0.015 (.36)
−0.003 (.86)
0.003 (.82)
0.157 (.00)
0.007 (.00)
0.560 (.00)
0.213 (.00)
−0.355 (.00)
−0.160 (.00)
7.122 (.25)
0.129 (.06)
0.412 (.00)
0.115 (.24)
0.387 (.05)
−0.029 (.04)
0.029 (.00)
0.297 (.00)
0.064 (.24)
0.002 (.04)
−0.088 (.11)
0.037 (.40)
0.379 (.00)
0.005 (.53)
66%
56%
36%
72%
a
Financial distress is defined as a loss or negative operating cash flow in the current year. All p-values
are two-tailed. Variables are defined as follows:
ROA = return on assets defined as operating income divided by total assets at the fiscal year-end
INVREC = inventory plus accounts receivable divided by total assets at fiscal year-end
INSTITUTIONAL = the percentage of institutional holdings
SPECIAL ITEMS = equal to the absolute value of negative special items divided by total assets, and 0
otherwise
BOOK TO MKT = the book-to-market ratio on the last day of the fiscal year
SEGS = the number of segments disclosed in the segment footnote
FOROPS = an indicator variable equal to 1 if the company has foreign operations, and 0 otherwise
EMPLAN = an indicator variable equal to 1 if the company has a pension or post-retirement plan, and
0 otherwise
INITIAL YEARS = an indicator variable equal to 1 if it is the initial two years of the audit engagement,
and 0 otherwise
MERGER = an indicator variable equal to 1 if the client acquired a company during the fiscal year
FINANCE = an indicator variable equal to 1 if the firm issued equity or debt during the fiscal year
SALES GROWTH = growth rate in sales over the prior year.
Other variables are defined as in table 1.
Consistent with the approach taken in Frankel, Johnson, and Nelson
[2002] to estimate the unexpected FEERATIO, we use the error terms from
the models in table 4 to surrogate for the “unexpected” portion of each of
our fee variables. We then replace the fee variables used in table 3 with the
unexpected fee variables and repeat the analysis. The resulting regressions
are presented in table 5. Model 1 in table 5 is a benchmark analysis identical
to model 1 in table 3, and models 2–5 introduce various combinations of
our unexpected fee variables similar to table 3. Consistent with the results in
table 3, the results in table 5 indicate that the estimated coefficients on all of
our fee variables are insignificant at conventional levels in every case. Thus,
TABLE 5
Going Concern Opinion Models, with Unexpected Fee Variables Included as Independent Variables, for a Sample of 1,158 Financially Distressed Firms (Including 96 Firms with
Going Concern Opinions) with Available Auditor Fee Information for Fiscal Year 2000 a
Model 1
Predicted
Sign
PseudoR2 %
+
−
−
+
−
+
+
+
+
−
−
+
−
+
−
−
−
−
Model 3
Marginal
Effect
Coefficient
( p-value)
Marginal
Effect
−6.304 (.00)
1.773 (.00)
−0.141 (.24)
0.075 (.64)
0.017 (.93)
−1.209 (.00)
84.466 (.02)
−0.194 (.71)
0.471 (.24)
0.567 (.09)
−2.052 (.00)
0.222 (.68)
0.932 (.03)
−0.710 (.18)
0.026 (.00)
4.6%
−1.9%
0.6%
0.1%
−5.8%
2.4%
−0.5%
2.1%
2.0%
−4.6%
0.5%
2.1%
−1.4%
4.8%
−6.254 (.00)
1.771 (.00)
−0.142 (.24)
0.059 (.72)
0.010 (.96)
−1.204 (.00)
82.577 (.02)
−0.173 (.74)
0.470 (.24)
0.554 (.11)
−2.052 (.00)
0.213 (.69)
0.933 (.03)
−0.728 (.17)
0.026 (.00)
−0.485 (.46)
4.5%
−1.8%
0.6%
0.0%
−5.7%
2.3%
−0.4%
2.1%
1.9%
−4.6%
0.4%
2.0%
−1.5%
4.7%
−0.7%
Model 4
41%
Marginal
Effect
−6.314 (.00)
1.761 (.00)
−0.140 (.24)
0.072 (.66)
0.019 (.92)
−1.209 (.00)
84.106 (.02)
−0.183 (.72)
0.469 (.24)
0.569 (.09)
−2.049 (.00)
0.217 (.68)
0.928 (.03)
−0.718 (.18)
0.026 (.00)
4.5%
−1.8%
0.5%
0.1%
−5.7%
2.4%
−0.5%
2.1%
2.0%
−4.6%
0.4%
2.0%
−1.5%
4.8%
−0.043 (.84)
−0.2%
Model 5
41%
Coefficient
( p-value)
Marginal
Effect
−6.249 (.00)
1.774 (.00)
−0.142 (.24)
0.059 (.72)
0.009 (.96)
−1.203 (.00)
82.637 (.02)
−0.175 (.73)
0.470 (.24)
0.553 (.11)
−2.052 (.00)
0.214 (.69)
0.934 (.03)
−0.725 (.17)
0.025 (.00)
−0.500 (.47)
0.014 (.95)
4.5%
−1.8%
0.5%
0.1%
−5.7%
2.3%
−0.5%
2.1%
2.0%
−4.6%
0.4%
2.0%
−1.5%
4.7%
−0.7%
0.0%
41%
Coefficient
( p-value)
Marginal
Effect
−6.277 (.00)
1.810 (.00)
−0.133 (.27)
0.056 (.73)
−0.013 (.95)
−1.184 (.00)
84.257 (.02)
−0.208 (.69)
0.471 (.24)
0.550 (.11)
−2.044 (.00)
0.198 (.71)
0.946 (.03)
−0.738 (.16)
0.026 (.00)
4.6%
−1.7%
0.4%
0.0%
−5.6%
2.4%
−0.5%
2.1%
1.9%
−4.6%
0.4%
2.1%
−1.5%
4.8%
0.163 (.47)
−0.108 (.25)
41%
Coefficient
( p-value)
0.7%
−1.0%
41%
1267
a
Financial distress is defined as a loss or negative operating cash flow in the current year. All p-values are two-tailed, and the marginal effect indicates the effect of a 1-standarddeviation change in the respective variable on the probability of a going concern opinion. Variable definitions are as follows:
UNEXPECTED FEERATIO = residual from applicable model in table 4
UNEXPECTED log(TOTAL FEE) = residual from applicable model in table 4
UNEXPECTED log(AUDIT FEE) = residual from applicable model in table 4
UNEXPECTED log(NON-AUDIT FEE) = residual from applicable model in table 4
Other variables are defined as in table 1.
NON - AUDIT SERVICE FEES
Intercept
PROBANKZ
log(ASSETS)
log(AGE)
BETA
RETURN
VOLATILITY
LEV
CLEV
LLOSS
INVESTMENTS
FUTURE FINANCE
BIG 5
OP CASH FLOW
REPORT LAG
Unexpected FEERATIO
Unexpected log(TOTAL FEE)
Unexpected log(AUDIT FEE)
Unexpected log(NON-AUDIT FEE)
Model 2
Coefficient
( p-value)
1268
M . L . D e F ond, K . RAGHUNANDAN, AND K . R . SUBRAMANYAM
as in table 3, the results in table 5 do not support either of the hypotheses
that fees impair auditor independence.
4.5
CONTROLLING FOR ENDOGENEITY
A potential limitation to our findings is that we expect the going concern
opinion, audit fees, and non-audit fees to be endogenously determined.
That is, going concern opinions, audit fees, and non-audit fees are all likely
to be associated with financial distress. For example, in addition to a higher
probability of receiving a going concern opinion, distressed firms are also
more likely to command an audit risk premium and potentially involve more
audit work, resulting in higher audit fees. Similarly, we also expect non-audit
fees to be associated with distress, although the sign of the relation is ambiguous. For example, distressed firms may wish to decrease discretionary spending on consulting services to conserve cash or, alternatively, spend more on
consulting services in an attempt to improve their financial condition.
Although our opinion and fee models include financial and market variables to control for financial distress, (e.g., PROBANKZ and RETURN ), we
can never be sure that we have adequately controlled for financial distress.
In particular, because going concern opinions are likely to help predict distress beyond our control variables, endogeneity potentially confounds our
results.19 The simultaneity bias induced by endogeneity may explain why we
do not observe a significant association between non-audit service fees and
going concern opinions in tables 3 and 5. Specifically, if simultaneity bias
induces a positive relation between non-audit fees and going concern opinions, it could swamp the hypothesized negative relation between non-audit
fees and going concern opinions.
In addition, all of our fee variables (except for our measure of total fees)
involve audit and non-audit fees together in some combination. Whisenant,
Sankaraguruswamy, and Raghunandan [2002] show that audit fees and nonaudit fees are endogenously determined. Thus, it is difficult to interpret the
results of our tests that use the FEERATIO or log(AUDIT FEE) and log(NONAUDIT FEE) together, in the presence of the endogeneity.
Because joint estimation of a simultaneous system of equations with one
or more dichotomous dependent variables is problematic (Judge, Griffiths,
Hill, Lutkepohl, and Lee [1985]), we implement a two-stage procedure
19 For example, Mutchler, Hopwood, and McKeown [1997] show that the going concern
opinion has incremental explanatory power in explaining subsequent bankruptcy beyond various financial ratios. We also test whether going concern opinions are informative in our sample
by examining the incremental ability of going concern opinions to predict bankruptcy over
the ensuing 12 months. We estimate model 1 in table 3 with an indicator variable coded as 1
if the firm filed for bankruptcy during the following year, and 0 otherwise, as the dependent
variable and include the going concern indicator variable as an additional explanatory variable. The results (not presented) reveal that the going concern indicator variable is significant
and positive at p < 1% (two-tailed). Thus, even in our distressed sample, the going concern
opinion is incrementally informative in predicting bankruptcy beyond the variables in model
1 in table 3.
NON - AUDIT SERVICE FEES
1269
recommended by Nelson and Olsen [1978].20 Accordingly, we implement
a system of three structural models: one for each of our three endogenous
variables—OPINION, log(AUDIT FEE), and log(NON-AUDIT FEE)—where
each is a function of the other two and select exogenous variables. We specify
the three models as follows: (1) we model OPINION using all independent
variables in equation (1) and include log(AUDIT FEE) and log(NON-AUDIT
FEE) as endogenous independent variables, (2) we model log(AUDIT FEE)
using all independent variables in equation (2) and include OPINION and
log(NON-AUDIT FEE) as endogenous independent variables, and (3) we
model log(NON-AUDIT FEE) using all independent variables in equation
(3) and include OPINION and log(AUDIT FEE) as endogenous independent
variables. We separately model audit and non-audit service fees because this
allows us to simultaneously test both of our hypotheses using the regression
equation in model 5 of table 3.
In the first stage we model each of our three endogenous variables as
a function of all of the exogenous variables in the system (reduced-form
models). We use a probit regression to estimate the going concern model
and ordinary least squares regressions to estimate the two fee models. We use
probit instead of logistic regression to estimate the going concern model
because the simultaneous system requires normally distributed residuals.
In the second stage we estimate the structural models after replacing each
endogenous explanatory variable with the predicted value from the first
stage, which we term GCHAT, AUDHAT, and NASHAT. We then employ the
“omitted variables” variant of the Hausman [1978] test to check for the
presence of endogenity (Beatty, Chamberlain, and Magliolo [1995]) and
find that the test is unable to reject the null of no endogeneity for the going
concern model, but endogenity is detected in both fee models. In particular,
the two fee components appear to be endogenously determined.
Table 6 reports the results of estimating the second-stage structural regressions in accordance with the previously described procedures. The first
regression in the table presents the results of estimating the going concern
model, and the next two regressions present the results of estimating the
two fee regressions. The results in the going concern model report that the
coefficients on AUDHAT and NASHAT are not significant at conventional
levels. In fact, the coefficient on NASHAT has a positive sign with a p-value
of 0.20. Thus, even after controlling for potential simultaneity bias induced
by endogeneity, we continue to find no support for either of the hypotheses
that fees impair auditor independence.21
20 See D’Souza [1998] and Copley, Doucet, and Gaver [1994] for examples of its implementation in an accounting and auditing context.
21 Amemiya [1978] shows that although the coefficients from the Nelson-Olsen secondstage equation are asymptotically unbiased, they are not the most efficient estimators. He
proposes a method for deriving more efficient estimators. Although the Amemiya estimators
are asymptotically equivalent to the Nelson-Olsen estimators, the covariance matrix of the
Nelson-Olsen estimators is biased. Amemiya proposes a correction to the covariance matrix
1270
M . L . D e F ond, K . RAGHUNANDAN, AND K . R . SUBRAMANYAM
TABLE 6
Structural Models from Two-Stage Procedure After Controlling for Endogeneity, for a Sample of 1,158
Financially Distressed Firms (Including 96 Firms with Going Concern Opinions) with Available Auditor
Fee Information for Fiscal Year 2000 a
Dependent
Variable = OPINION
Intercept
PROBANKZ
log(ASSETS)
log(AGE)
BETA
RETURN
VOLATILITY
LEV
CLEV
LLOSS
INVESTMENTS
FUTURE FINANCE
BIG 5
OP CASH FLOW
REPORTLAG
AUDHAT
NASHAT
−2.884 (.00)
0.806 (.00)
−0.232 (.14)
0.112 (.29)
−0.018 (.86)
−0.604 (.00)
45.56 (.02)
0.005 (.99)
0.332 (.14)
0.314 (.09)
−1.257 (.00)
0.134 (.61)
0.289 (.24)
−0.373 (.21)
0.015 (.00)
−0.295 (.46)
0.373 (.20)
Model Chi-square = 215.86
p-value < .00
Dependent
Variable = log(AUDIT FEE)
Intercept
log(ASSETS)
BIG 5
ROA
RETURN
VOLATILITY
LEV
INVREC
INSTITUTIONAL
SPECIAL ITEMS
BOOK TO MKT
SEGS
FOROPS
EMPLAN
REPLAG
INITIAL YEAR
GCHAT
NASHAT
Model F = 128.43
p-value < .00
Adjusted R2 = .65
1.622 (.00)
0.414 (.00)
0.157 (.02)
−0.384 (.00)
−0.166 (.00)
13.222 (.02)
0.255 (.00)
0.740 (.00)
0.076 (.38)
0.313 (.08)
−0.024 (.04)
0.037 (.00)
0.238 (.00)
0.146 (.00)
0.003 (.00)
−0.078 (.11)
0.515 (.02)
0.006 (.90)
Dependent
Variable = log(NON-AUDIT FEE)
Intercept
log(ASSETS)
BIG 5
ROA
RETURN
LEV
INSTITUTIONAL
SPECIAL ITEMS
BOOK TO MKT
SEGS
FOROPS
EMPLAN
INITIAL YEAR
MERGER
FINANCE
SALES GROWTH
GCHAT
AUDHAT
−1.217 (.20)
0.527 (.00)
0.561 (.00)
−0.482 (.00)
−0.237 (.00)
−0.149 (.36)
0.422 (.03)
0.615 (.13)
−0.033 (.20)
0.025 (.17)
0.296 (.06)
−0.102 (.37)
−0.088 (.45)
0.083 (.35)
0.738 (.00)
0.023 (.18)
0.763 (.07)
0.373 (.16)
Model F = 83.43
p-value < .00
Adjusted R2 = .55
a
Financial distress is defined as a loss or negative operating cash flow in the current year. All p-values are
two-tailed. Variable definitions are as follows:
AUDHAT = predicted value of audit fee
NASHAT = predicted value of non-audit fee
GCHAT = predicted value of going concern opinion.
Other variables are defined as in tables 1 and 4.
4.6
ROBUSTNESS CHECKS
As in prior research we limit our sample to distressed firms (defined as
having either negative cash flows or negative earnings) that receive first-time
going concern opinions. To test the robustness of our results to these sample
restrictions, we replicate our analysis in tables 3, 5, and 6, using different
samples based on the following selection criteria: (1) a distressed sample
that includes multiple-year going concern opinions (with a dummy variable
to control for firms with prior-year going concern opinions), (2) a sample of
all available firms (i.e., not limited to distressed firms) that receive first-time
going concern opinions, and (3) a sample of all available firms that includes
multiple-year going concern opinions (with a dummy variable to control for
firms with prior-year going concern opinions). The results from all of the
that is unbiased. We do not implement this correction because the extent of this correction is
expected to be small and is unlikely to affect our inferences.
NON - AUDIT SERVICE FEES
1271
regressions (not presented) report that all of the coefficients on all of the
fee variables remain insignificant at conventional levels. Thus, our findings
are not sensitive to our sample-selection criteria.
In addition, we perform an analysis that considers alternative measures for
our fee variables. Specifically, as in Chung and Kallapur [2001], we compute
measures equal to the client’s non-audit fees, audit fees, or total fees, divided
by the total fees for that firm’s auditor across all clients. These measures
are designed to capture the relative importance of the client to the audit
firm. We then substitute these measures for the respective fee variables in
the going concern models in table 3 (except for FEERATIO). The results
(not presented) are not sensitive to these alternative measures for our fee
variables.
Finally, we perform an analysis that considers an alternative measure of
auditor independence. Specifically, we measure the ex post error in auditors’ going concern decisions by computing a variable that equals the going concern indicator variable used in equation (1), minus an indicator
variable equal to 1 if the client firm filed for bankruptcy during the 12
months following the respective year-end, and 0 otherwise. Hence, this
new variable takes one of three values: –1, 0, or 1, where –1 indicates a
Type II error (erroneous clean opinion), 0 indicates a correct opinion, and
1 indicates a Type I error (erroneous going concern opinion). We then
use this new measure as the dependent variable in an ordered logistic regression with independent variables identical to those in the five models
in tables 3 and 5. The results (not presented ) report that all of the coefficients on all of the fee variables are insignificant at conventional levels. Thus, our findings are robust to this alternative measure of auditor
independence.
5. Summary and Conclusion
In the wake of the Enron bankruptcy and the subsequent indictment of its
auditor, Arthur Andersen, regulators have taken actions to curtail auditorprovided non-audit services. These actions are based on the premises that
non-audit service fees impair auditor independence by making the auditor
economically dependent on the client and that the consulting nature of
non-audit services reduces the auditor’s objectivity. In this study we attempt
to empirically investigate the validity of the these concerns by gathering
systematic evidence on the association between non-audit and audit fess
paid to incumbent auditors and auditor independence measured as the
propensity of auditors to issue going concern opinions.
Contrary to regulators’ concerns, we find no association between nonaudit service fees and the auditor’s propensity to issue a going concern
opinion. In addition, we find no relation between audit fees and the auditor’s propensity to issue a going concern opinion. Our findings suggest