Improving service quality. The case of United Insurance Company = Nâng cao chất lượng dịch vụ trượng hợp của công ty bảo hiểm liên hiệp
Bạn đang xem bản rút gọn của tài liệu. Xem và tải ngay bản đầy đủ của tài liệu tại đây (1.42 MB, 110 trang )
VIETNAM NATIONAL UNIVERSITY - HANOI
HANOI SCHOOL OF BUSINESS
NGUYEN CHIEN THANG
IMPROVING SERVICE QUALITY
THE CASE OF UNITED INSURNCE COMPANY
Major: Business Administration
Code: 60 34 05
MASTER OF BUSINESS ADMINISTRATION THESIS
Supervisors: Dr Nguyen Viet Dung
Hanoi – 2013
TABLE OF CONTENT
CHAPTER I: OVERVIEW OF THESIS ............................................................................... 1
1.1. INTRODUCTION.............................................................................................................. 1
1.2. OBJECTIVE OF SUBJECT ................................................................................................. 1
1.3. SCOPE AND METHODOLOGY OF RESEARCH. ................................................................... 2
1.3.1. Scope of research .................................................................................................. 2
1.3.2. Method of research ............................................................................................... 2
1.4. STRUCTURE OF THESIS .................................................................................................. 3
CHAPTER II: THEORETICAL BASIS OF SERVICE QUALITY AND NON-LIFE
INSURANCE BUSINESS ........................................................................................................ 4
2.1. DEFINITION AND NATURE OF SERVICE ........................................................................... 4
2.1.1. Definition of service .............................................................................................. 4
2.1.2. Nature of service ................................................................................................... 5
2.2. SERVICE QUALITY AND FACTORS OF SERVICE QUALITY ................................................. 6
2.2.1. Definition of service quality .................................................................................. 6
2.2.2. Factors of service quality ..................................................................................... 8
2.3. SERVICE QUALITY MEASUREMENT .............................................................................. 11
2.4. CHARACTERISTICS OF NON-LIFE INSURANCE BUSINESS ............................................... 15
2.4.1. Principle of insurance business ......................................................................... 16
2.4.2. Characteristic of non-life insurance service ....................................................... 17
CHAPTER III: RESEARCH METHODOLOGY AND SOME PRELIMINARY
RESULT .................................................................................................................................. 21
3.1. QUALITATIVE RESEARCH............................................................................................. 21
3.1.1. Design qualitative research ................................................................................ 21
3.1.2. Research model and scale of measurement ........................................................ 25
3.2. QUANTITATIVE RESEARCH .......................................................................................... 27
3.2.1. Design quantitative research .............................................................................. 27
3.2.2. Method of data analysis ...................................................................................... 29
CHAPTER IV: ANALYSIS OF INSURANCE SERVICE QUALITY OF UNITED
INSURANCE COMPANY ..................................................................................................... 31
4.1. BUSINESS OVERVIEW OF UNITE INSURANCE COMPANY .............................................. 31
4.1.1. History ................................................................................................................ 31
4.1.2. Business overview ............................................................................................... 32
4.2. SUMMARY OF QUANTITATIVE RESEARCH RESULT ........................................................ 37
4.2.1. Sample description .............................................................................................. 37
4.2.2. Result of measurement scale testing ................................................................... 39
4.3. ANALYSIS OF ACTUAL SERVICE QUALITY OF UIC ........................................................ 41
4.3.1. Reliability of insurance service........................................................................... 41
4.3.2.
4.3.3.
4.3.4.
4.3.5.
4.3.6.
Responsiveness.................................................................................................... 43
Service capacity .................................................................................................. 47
Customer care ..................................................................................................... 50
Convenient service access .................................................................................. 53
Overview assessment of service quality of UIC. ................................................. 56
CHAPTER V: SOLUTIONS AND RECOMMENDATIONS TO IMPROVE
SERVICE QUALITY OF UNITED INSURANCE COMPANY ....................................... 60
5.1. OBJECTIVE AND DIRECTIONS OF DEVELOPMENT OF UIC ............................................. 60
5.2. SOLUTIONS TO IMPROVE SERVICE QUALITY OF UIC .................................................... 61
5.2.1. Improving favorable service access for customer .............................................. 61
5.2.2. Improving responsiveness ................................................................................... 64
5.2.3. Improving service capacity ................................................................................. 68
5.2.4. Improving customer care .................................................................................... 70
5.3. RECOMMENDATION ..................................................................................................... 73
5.3.1. Recommendation for Insurance Supervisory Authority – Ministry of Finance .. 73
5.3.2. Recommendation for Vietnam Insurance Association (VIA) .............................. 73
CONCLUSION ....................................................................................................................... 76
APPENDIX .............................................................................................................................. 80
LIST OF FIGURE
FIGURE 2.1: HIERARCHICAL OF SERVICE QUALITY BY BRAD AND CONIN ..................................... 9
FIGURE 2.2: A COMPREHENSIVE FRAMEWORK FOR SERVICE QUALITY BY DABHOLKAR AND
COAUTHORS ........................................................................................................................ 10
FIGURE 2.3: SERVICE QUALITY MODEL BY PARASURAMAN, ZEITHAML, AND BERRY (1985) ..... 12
FIGURE 2.4: DIMENSIONS OF SERVICE QUALITY PERCEIVED BY CUSTOMERS OF
PARASURAMAN AND COAUTHORS ...................................................................................... 14
FIGURE 3.1: RESEARCH MODEL OF INSURANCE SERVICE QUALITY FACTORS .............................. 26
FIGURE 4.1: ORGANIZATIONAL STRUCTURE OF UIC .................................................................. 33
FIGURE 5.1: COOPERATION MODEL WITH BANKS ....................................................................... 63
FIGURE 5.2: RISK PREVENTION SUPPORT PROCESS ..................................................................... 72
LIST OF CHART
CHART 4.1: PROPORTION OF PREMIUM REVENUE OF UIC BY INSURANCE CLASS (2012) ............ 35
CHART 4.2: MARKET SHARE OF UIC COMPARISON WITH THE MAIN COMPETITORS .................... 35
CHART 4.3: PREMIUM REVENUE OF UIC COMPARED WITH DIRECT COMPETITORS ...................... 36
CHART 4.4: REVENUE GROWTH RATE COMPARISON OF UIC AND AVERAGE OF MAKET .............. 36
CHART 4.5: BUSINESS TYPE OF SURVEYED CUSTOMER ............................................................... 38
CHART 4.6: HUMAN SCALE OF SURVEYED CUSTOMER ............................................................... 39
CHART 4.7: INSURANCE CLASSES ............................................................................................... 39
CHART 4.8: EVALUATION RATIO OF RELIABILITY OF INSURANCE SERVICE ................................. 41
CHART 4.9: EVALUATION RATIO OF RESPONSIVENESS OF UIC ................................................... 44
CHART 4.10: EVALUATION RATIO OF RESPONSIVENESS OF UIC ................................................. 48
CHART 4.11: EVALUATION RATIO OF CUSTOMER CARE OF UIC ................................................. 51
CHART 4.12: EVALUATION RATIO OF CONVENIENT SERVICE ACCESS OF UIC............................. 54
CHART 4.13: EVALUATION RATIO OF SATISFACTION OF UIC INSURANCE SERVICE QUALITY ..... 57
CHART 4.14: SERVICE QUALITY EVALUATION CLASSIFIED BY HUMAN SCALE OF CUSTOMER ..... 57
CHART 4.15: SERVICE QUALITY EVALUATION CLASSIFIED BY INSURANCE CLASS ...................... 58
LIST OF TABLE
TABLE 4.1: PREMIUM REVENUE OF UIC BY INSURANCE CLASS (2012)....................................... 34
TABLE 4.2: SUMMARY CUSTOMER EVALUATION OF RELIABILITY OF UIC ................................. 42
TABLE 4.3: SUMMARY CUSTOMER EVALUATION OF RESPONSIVENESS OF UIC ........................... 44
TABLE 4.4: SUMMARY CUSTOMER EVALUATION OF SERVICE CAPACITY OF UIC ........................ 48
TABLE 4.5: SUMMARY CUSTOMER EVALUATION OF CUSTOMER SERVICE OF UIC ...................... 51
TABLE 4.6: SUMMARY CUSTOMER EVALUATION OF CONVENIENT SERVICE ACCESS OF UIC ...... 54
ABBREVIATIONS
BVTM
Bao Viet- Tokio Marine Insurance Company
NKSJ
Nipponkoa –Sompo Japan
SVI
Samsung Vina Insurance Company
VIA
Vietnam Insurance Association
UIC
United Insurance Company
CHAPTER 1: OVERVIEW OF THESIS
1.1.
Introduction
After 18 year of market opening, non-life insurance market of Vietnam has
dramatically developed; average growth rate of premium for the period of
2006-2012 is about 23.6%. In 2012, Premium of non-life insurance market is
more than VND 22,316 billion accounted for 0.9% (compared with 0.6% in
2006). At the end of 2012, there are 29 non-life insurers on market including
16 joint-stock companies and 10 foreigner joint venture and foreigner owned
companies. The dynamic of foreigner companies helped to increase
competitiveness of market.
With increasingly severe competition in market, price-driven competition
will not bring sustainable growth for insurance companies. Therefore,
improving service quality has become the goal of many insurance companies
on the market
After 3 years working in United Insurance Company, I see that improving
service quality is important and priority task of company. Therefore, I chose
the subject “Improving service quality: the case of United Insurance
Company” as my master thesis
1.2.
Objective of subject
UIC was established in 1997, with 16 years old UIC is one of most mature
insurer in Vietnamese insurance market. According to business characteristic
of company, UIC mainly focus on servicing Japanese client and most of them
is longtime client, hence for many years, service quality has not been assessed
and negatively affected. In result, company has become more dependent on
client, passive in client service, slow adoption to change and competitiveness
of market. UIC has very small market share and especially the growth rate of
1
Vietnamese client is rather low compared with competitors. Therefore,
company need to find the answer for the question “whether clients are
satisfied with service quality of company or not? How much is satisfactory
degree?” The objectives of subject are:
- Defining a model to measure and evaluate non-life insurance service
quality
- Measure and evaluate insurance service quality of UIC
- Propose solutions and recommendations to improve service quality of
UIC.
1.3.
Scope and methodology of research.
1.3.1. Scope of research
In this subject, I research assessment of customer about UIC service.
Data collected is through conducting survey with client in some provinces of
in the North of Vietnam. Time of survey is in 2013.
1.3.2. Method of research
Utilized measuring model is based on SERVQUAL model adjusted by
particulars of insurance service. The process of research is shown as below:
Preliminary research: is implemented through qualitative methods with
technical discussions in group or duel. This research will be used
SERVQUAL model to establish preliminary scale of measurement of non-life
insurance.
Formal research: is done by quantitative methods. I used a
questionnaire to investigate the assessment of client of insurance Service
quality of UIC. This study aims to adjust and test the draft scale to form
official scale about insurance service quality. Scale was assessed by Cronbach
2
alpha, EFA factor analysis, multi linear regression. After this step, I can
explore what are factors of service quality
After testing, the scale will be used to analyze actual insurance service
quality of UIC through descriptive statistic. After this step, I can explore
what is the current status of service quality of UIC
Based on study results, I propose solutions and recommendations to
improve service quality in the near future. This process can answer the
questions: What solutions should be made to improve insurance service
quality of UIC?
1.4.
Structure of thesis
The thesis includes 05 chapters: Chapter 1: Overview of research subject;
Chapter 2: Theoretical basis of service quality; Chapter 3: Research
methodology and some preliminary result; Chapter 4: Analysis of the actual
service quality of UIC; Chapter 5: The solutions and recommendations to
improve the service quality of UIC in; and the conclusion outlined the major
findings of the project.
3
CHAPTER 2: THEORETICAL BASIS OF SERVICE QUALITY
AND NON-LIFE INSURANCE BUSINESS
2.1.
Definition and nature of service
Practices from the developing countries and the world have demonstrated
that: Along with the economic development the services sector is increasingly
playing an important role and the contributing big proportion of GDP of each
countries. The services sector led the economy as the center of economic
activity and it has a close relationship with many other areas of the economy.
In Vietnam, at the end of 2012, service sector accounted for 43.5% of GDP.
In despite of recession of overall economy, the growth rate of service sector
reached 5.97%, which is still higher than GDP’s growth rate. This shows that
the potential to develop the services in the future in our country is very large.
The following part of this section will answer for some question, including
What is service? What is the nature of the service? What is service quality?
What factors determine the quality of service? How to measure the quality of
service?
2.1.1. Definition of service
Services is a very popular concept, there are many definitions of service.
According to Zeithaml & Britner (2000), the service is the act, process, how
to perform a certain task in order to create customer value used for satisfying
the needs and expectations of customers.
According to Kotler & Armstrong (2004), services are activities or
benefits that businesses can offer to customers in order to establish, strengthen
and expand the long-term and cooperative relationships with customers.
Implementation services can and cannot be related to the goods of its material
form.
4
Fitzsimmons said that the service is an intangible activity and storage,
made to a customer and the customer is the creator of the product.
2.1.2. Nature of service
To identify a service, it is often based on the following four specific
characteristics:
Characteristic of intangibility is defined as a certain things that cannot
touch, see, taste, hear or be aware of other goods (Groth and Dye, 1999).
Intangibility is the most important difference to distinguish between goods
and services (Santos, 2002). Due to the intangible characteristics of services
that now very difficult to determine the customer's perception of service, as
well as their appreciation about service quality is how (Parasuraman,
Zeithaml and Berry, 1985) .
Characteristic of inseparability is shown that service provider perform
service at the same time with the service consumption of customer . Service
providers cannot hide any fault or deficiency of services (Ghobadian, Speller
and Jones, 1994).
For services with high labor content, such as quality occurs during service
delivery, service quality expressed in the process of interaction between
customers and employees of service provider (Svensson, 2002). For those
services that require the participated opinions of consumers as health care,
less service companies perform quality control management because
consumers influenced to this process. In such cases, the opinion of the
customer as patients describe the symptoms to the doctor, consulted by the
customer becomes important for the quality of service activities
Characteristic of heterogeneity:
This feature is also known as the
distinctiveness of the service. Accordingly, the implementation of the service
5
varies depending on how the service is provided, location of service, targeted
customer of service or time of service. This feature is most recognized for
service required high labor force. Requirement for uniform quality of
employees will be very difficult to ensure (Caruana & Pitt, 1997). The reason
is that what the company intends to serve can be completely different from
what the consumer receives.
Characteristic perish ability: Services are perishable; they cannot be
stored. Therefore, an empty seat on a plane, for example, is a lost opportunity
forever. Restaurants are now charging for reservations, which are not kept,
charges may be made for missed appointments at the dental clinic. Perish
ability does not pose too much of a problem when demand for a service is
steady, but in cases of unusually high or low demand, service organizations
can have severe difficulties .The above characteristics are generally referred
to in many texts as being what makes services marketing so different.
However, this assumption should be queried on a number of grounds. Like all
sweeping generalizations, generalizations concerning services marketing do
not always represent the full picture. Consider the question of tangibility. In
the main, services can be broken down into three main classifications.
2.2.
Service quality and factors of service quality
2.2.1. Definition of service quality
Quality of service is a concept that attracted much attention and
controversy in the literature because the researchers have found difficult to
define and measure service quality in unity
Gronroos (1984) defined service quality perceived as a result of an
evaluation process when customers compare their expectations with the
service they actually received
6
Parasuraman, Zeithaml and Berry (1988) also views this as to that service
quality as a form of attitude, related but not homologous to customer
satisfaction, is the result from the comparison between the customer
expectations with actual service that they are aware of their consumption.
Expectations is the desire, the desire of customers to service, as customers
often feel that the service provider should offer something better than what
they did. Consumer expectations are formed based on their demand for goods
and services; purchase from experiences in the past and from the information,
they received from external vendors, friends or communication activities of
the service provider.
Cronin and Taylor (1992) suggested that, view concept service quality, as
a gap between expectations and outcomes of services, is not appropriate. They
point out the confusion related the relationship between service quality and
customer satisfaction for services. The concept of customer satisfaction is
defined as a gap between expectations and results, or an inconsistent with
expectations.
To clarify this issue, it is necessary to distinguish the differences between
the concept of service quality and customer satisfaction: According to
Parasuraman, Zeithaml and Berry (1988), perceived service quality is an
overall assessment or attitudes related to the characteristics of services.
Meanwhile, satisfaction is related to a particular transaction. Service quality
and satisfaction with the mutual relationship, service quality creates
satisfaction, but cannot infer vice versus. The satisfaction with the service, it
is not possible to conclude definitely that high-quality service because
satisfaction is influenced by many other factors (product quality; prices;
7
situation factors; personal factors). There is only temporary satisfaction,
customer always requires higher service quality.
Moreover, the concept of customer expectations is different exposed in
theory of service quality and theory of satisfaction theory: In the theory of
satisfaction, expectations are considered as customer’ prediction what can
happen in given transaction in the future. Conversely, in theory of service
quality, the expectations are desire of the customer, for example, they feel that
businesses should provide something better than the current ones
(Parasuraman, Zeithaml and Berry, 1988).
2.2.2. Factors of service quality
The traditional models of service quality that assess the client's awareness
about service quality based on a number of factors or aspects, all view service
as a complex mixture of explicit and implicit attributes. Service quality should
not be viewed as a discrete structure but a combination of several factors or
aspects that they have different content and nature
Gronroos (1984) argues that the process of awareness of customer service
reflected in two aspects:
- Technical quality: Is aspect results, what is the results of the service
provider giving customers?
- Functional quality: A process perspective, how were service functions
realized?
Customer aware service quality in the two aspects of this: What do they
receive? How do they receive? How are form and manner of service like?
Depending on the evaluation of customers for service is good, average or bad.
Lehtinen and Lehtinen (1991) suggested that it is necessary to consider
service quality in the three aspects. The three aspects are:
8
- Material quality: Includes equipment and physical environment.
- Transactional quality: is mainly derived from the matching between
communication styles of delivered service and the customer's style.
- Company quality: is mainly assessment of company’ exterior form
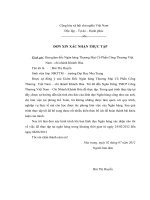
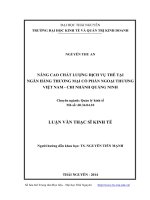
Brady and Cronin (2001) also viewed service quality composed of three
dimensions, which has two dimensions same as Gronroos opinion of the
technical quality (the results of the service) and functional quality (quality of
transaction). The third dimension is the physical environment of the service.
Each of these dimensions (communication, environment and results) has three
sub-elements and customers conjunct with their assessment from additional
factors to form their perception of the quality of each the first main
dimension. Combination of that assessment will give the final result of overall
service quality
Figure 2.1: Hierarchical of service quality by Brad and Conin
Source: Brady, Cronin (2001), ―Some new thoughts on conceptualizing perceived
service quality: A hierarchical approach‖, Journal of Marketing, Vol. 65, pp. 37
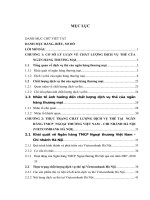
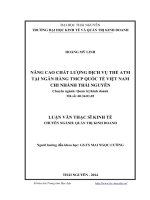
Dabholkar, Shepherd and Thorpe (2000) said that service quality is the
customer's overall evaluation, which based on different elements / attributes
9
related to service, thereby forming the overall assessment about service
quality, rather than a simple sum of the component elements. Multi-level
model is as follows:
Figure 2.2: A comprehensive framework for service quality by
Dabholkar and coauthors
Source: Brady, Cronin (2001), ―Some new thoughts on conceptualizing perceived
service quality: A hierarchical approach‖, Journal of Marketing, Vol. 65, pp. 37
Different researches of service quality provide different complex model,
which express factors influencing and forming service quality. In scope of this
thesis, I would like to use the model SERVQUAL by Parasuraman, Zeithaml
và Berry (1985) to apply for my analysis. This model has been proven as
effective model not only in marketing but also various sector such as:
healthcare, banking service, retail… The content of this model and
measurement scale of this theory are introduced in next section.
10
2.3.
Service quality measurement
Parasuraman, Zeithaml and Berry (1985) are those who pioneered in
research on service quality and provide a comprehensive, feasible model to
measure service quality. The authors said that there are five different gaps
affecting the assessment of customers about service quality, which includes:
The Gap 1: this is the gap between customer expectations and perceptions of
the business about those expectations. The basic point of this gap is due to
companies do not understand all the characteristics that make up the quality of
their services and how to transfer them to customers to satisfy their needs.
The Gap 2: this is the gap between the perceptions of the business about
customer expectation and the business characteristics of the service design. In
many cases, companies can realize the expectations of customers but
company cannot always convert these expectations into specific criteria for
quality and transfer exactly characteristics of services that customer expected.
The Gap 3:this is the gap between the business characteristics of service
provided and service delivery process. In service, the employees can directly
contact with customers, play an important role in the process of creating
quality. However, not always the staff can complete tasks according to the
criteria set out
The Gap 4: this is the gap between the service delivery process and the
implementation of promises to customers through external communication
activities. The promises in the advertising and promotion programs can
increase the expectations of customers but also will reduce the quality. In
such cases, customers feel when service providers do not comply with what
was promised
11
The Gap 5: this is the gap between customer expectations of service and their
perception of the results after the service consumer. Service quality depends
on this gap. Once customers see no difference between their quality
expectations and quality they feel when using a service, the quality of service
is considered perfect.
Parasuraman, Zeithaml and Berry (1985) introduced a model of Gap of
service quality as follows:
Figure 2.3: Service quality model by Parasuraman, Zeithaml, and Berry
(1985)
Source: Parasuraman, A., Zeithaml, V. A., and Berry, L. L (1985), ―A conceptual
model of service quality and its implications for future research‖, Journal of Marketing,
Vol. 49, Issue 4, pp. 4.
Parasuraman, Zeithaml, and Berry (1985) suggested that service quality is
a function of the gap no five, so service providers must find ways to narrow
this gap. In order to archive this, the enterprise must narrow the gap 04 listed
12
before (1,2,3 and 4 gap) because it is likely to affect the service quality.
Therefore, it is necessary to perform a sequence of action to measure
customer perceptions of service after consumption to check if service met
their expectations or not, that is the measurement of service quality.
According to service quality measurement model by the theory of
asymmetric customer expectations initiated by Parasuraman and coauthors
(1985), service quality includes 10 dimensions that customers use to form
their expectations about services, as well as evaluating their awareness about
service quality after their consumption. Ten dimensions of service quality are:
Reliability;
- Reliability
- Responsiveness
- Competence
- Access
- Courtesy
- Communication
- Credibility
- Security
- Understanding/knowing the customer
- Tangibles
13