TEST RELIABILITY OF COLLECTED DATA
Bạn đang xem bản rút gọn của tài liệu. Xem và tải ngay bản đầy đủ của tài liệu tại đây (195.54 KB, 25 trang )
APPENDIX 1
TEST RELIABILITY OF COLLECTED DATA
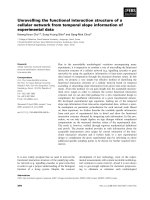
1. Reliability /Variables P1 P2 P3 P4 /Scale (Testscor) All.
R e l i a b i l i t y a n a l y s i s - s c a l e (t e s t s c o r)
VARIABLES RELIABILITY COEFFICIENTS
1. P1 N of cases = 47.0
2. P2 N of items = 4
3. P3 ALPHA = .6136
4. P4
2. Reliability /Variables C1 C2 C3 C4 C5 C6 C7 C8 C9 C10 C11 C12 C13 C14 C15
C16 /Scale (Testscor) All.
Re l i a b i l i t y a n a l y s i s - s c a l e (t e s t s c o r)
Variables Variables Variables Variables Reliability Coefficients
1. C1 5. C5 9. C9 13. C13 N of cases = 36
2. C2 6. C6 10. C10 14. C14 N of items = 16
3. C3 7. C7 11. C11 15. C15 ALPHA = .8746
4. C4 8. C8 12. C12 16. C16
3/ Reliability /Variables N1 N2 N3 N4 N5 /Scale (Testscor) All.
R e l i a b i l i t y a n a l y s i s - s c a l e (t e s t s c o r)
VARIABLES RELIABILITY COEFFICIENT
1. N1
2. N2 N of cases = 46.0
3. N3 N of items = 5
4. N4 ALPHA = .6059
5. N5
- 73 -
4/ Reliability /Variables D1 D2 D3 D4 /Scale (Testscor) All.
R e l i a b i l i t y a n a l y s i s - s c a l e (t e s t s c o r)
VARIABLES RELIABILITY COEFFICIENT
1. D1
2. D2 N of cases = 48.0
3. D3 N of items = 4
4. D4 ALPHA = .0405
5/ Reliability /Variables S1 S2 S3 S4 /Scale (Testscor) All.
R e l i a b i l i t y a n a l y s i s - s c a l e (t e s t s c o r)
VARIABLES RELIABILITY COEFFICIENTS
1. S1 N of cases = 46.0
2. S2 N of iutems = 4
3. S3 ALPHA = .8009
4. S4
6/ Reliability /Variables G1 /Scale (Testscor) All.
Scale (Testscor) Has Only One Item And Cannot Be Processed
7/ Reliability /Variables Cp1 Cp2 Cp3 Cp4 Cp5 Cp6 Cp7 Cp8 Cp9 Cp10 Cp11 Cp12 Cp13
Cp14 Cp15 Cp16 /Scale (Testscor) All.
Re l i a b i l i t y a n a l y s i s - s c a l e (t e s t s c o r)
Variables Variables Variables Variables RELIABILITY COEFFICIENTS
1. CP1 5. CP5 9. CP9 13. CP13 N of cases = 19.0
2. CP2 6. CP6 10. CP10 14. CP14 N of items = 16
3. CP3 7. CP7 11. CP11 15. CP15 ALPHA = .8306
4. CP4 8. CP8 12. CP12 16. CP16
- 74 -
APPENDIX 2
STATISTICAL T- TEST
1. T-TEST OF SUCCESS FACTORS OF JOINT VENTURE'S PERFORMANCE
(a) T- Test Of Success Factors For Partner Selection
FACTORS Vietnamese perception Foreign perception 2- Tailed
Probability
Mean S.D. Mean S.D.
P1 3.54 0.65 3.04 0.81 0.023
P2 3.04 0.75 2.61 0.84 0.069
P3 2.5 0.88 2.4 0.83 0.7
P4 2.8 0.96 3.0 1.06 0.3
C1 3.6 0.70 2.5 1.03 0.000
C2 3.13 0.75 2.87 0.9 0.29
C3 3.08 0.88 2.9 1.07 0.66
C4 3.14 0.64 2.62 0.81 0.02
C5 3.21 0.77 2.67 1.0 0.43
C6 2.83 0.72 2.61 1.12 0.43
C7 3.08 0.71 2.68 0.94 0.11
C8 2.71 1.35 2.35 1.27 0.40
C9 3.5 0.52 3.0 1.0 0.049
C10 3.05 0.59 2.59 1.09 0.097
C11 2.90 0.70 2.14 1.01 0.008
C12 3.13 0.62 2.78 1.13 0.2
C13 2.58 1.1 2.71 0.95 0.67
C14 2.21 1.08 1.95 1.22 0.45
C15 2.61 0.98 1.91 0.99 0.02
C16 2.83 0.78 2.87 1.01 0.8
(b) T- Test of Success factors for Negotiation
FACTORS Vietnamese perception Foreign perception 2-Tailed
Probability
Mean S.D. Mean S.D.
N1 3.38 0.71 3.17 0.64 0.29
N2 3.42 0.77 3.12 0.71 0.18
N3 3.38 0.71 2.67 0.70 0.001
N4 2.91 0.85 2.7 1.11 0.45
N5 3.26 0.62 2.61 0.99 0.01
(c) T- Test Of Success Factors For Management In JV
FACTORS Vietnamese perception Foreign perception 2- Tailed
- 75 -
Probability
Mean S.D. Mean S.D.
D1 3.25 0.89 3.08 1.25 0.59
D2 3.04 0.75 2.83 0.48 0.26
D3 3.08 0.65 2.87 0.79 0.32
D4 2.4 0.72 1.54 1.50 0.01
S1 2.95 0.88 2.83 0.72 0.58
S2 3.33 0.70 2.45 0.83 0.000
S3 3.00 0.85 2.95 0.64 0.8
S4 2.65 0.83 2.31 0.64 0.12
G1 3.38 0.97 3.27 0.83 0.70
2. T- TEST FOR EVALUATION OF JV'S PERFORMANCE
FACTORS Vietnamese perception Foreign perception 2- Tailed
Probability
Mean S.D. Mean S.D.
CP1 3.07 0.88 2.86 0.67 0.38
CP2 3.0 1.1 3.0 0.84 0.00
CP3 2.00 1.2 1.35 1.22 0.14
CP4 2.65 0.98 2.55 0.61 0.72
CP5 2.60 0.68 2.55 0.71 0.36
CP6 3.1 0.625 3.11 0.73 0.9
CP7 3.18 0.59 3.00 0.67 0.36
CP8 2.75 0.85 3.06 0.54 0.1
CP9 2.74 0.56 2.7 0.69 0.8
CP10 2.95 0.7 2.61 0.69 0.15
CP11 3.16 0.76 2.78 0.73 0.13
CP12 3.11 0.67 2.75 0.58 0.1
CP13 3.33 0.77 2.75 0.68 0.02
CP14 3.1 0.64 2.56 0.51 0.006
CP15 2.89 1.27 2.64 0.76 0.5
CP16 3.0 1.0 2.94 0.89 0.84
- 76 -
APPENDIX 3
Factor Analysis
1. Factor analysis for Partner selection Criteria
Final Statistics:
Variable Communality * Factor Eigenvalue Pct of Var Cum Pct
C1 .71710 * 1 6.15375 38.5 38.5
C2 .66482 * 2 2.50301 15.6 54.1
C3 .75998 * 3 1.32379 8.3 62.4
C4 .65619 * 4 1.15865 7.2 69.6
C5 .71870 *
C6 .67406 *
C7 .63799 *
C8 .65380 *
C9 .66509 *
C10 .62563 *
C11 .74768 *
C12 .83491 *
C13 .78871 *
C14 .80944 *
C15 .75222 *
C16 .43289 *
Rotated Factor Matrix:
Variables FACTOR 1 FACTOR 2 FACTOR 3 FACTOR 4
C1 .26200 .71341 .02979 .37231
C2 .62048 -.01011 -.11968 .51516
C3 .03563 .24227 -.02001 .83643
C4 .13166 .78651 .07320 .12206
C5 .65341 .48435 .22537 -.07980
C6 .75759 .28239 .03945 .13719
C7 .41129 .31008 .03117 .60968
C8 .25728 -.01361 .75049 .15553
C9 .28975 .36768 .24260 .62217
C10 .61645 -.08628 .31121 .37593
C11 .78285 .30500 .07444 .19042
C12 .66042 .62320 .08845 .05048
C13 -.15463 -.20284 .84999 .03425
C14 .12129 .25772 .80642 -.27927
- 77 -
C15 .11471 .33788 .77469 .15734
C16 .15833 .58409 .03084 .25632
(*) Factor analysis for Partner selection
VARIABLES FACTOR 1
P1 Opportunity to select 0.5522
P2 Availability & sufficiency of information and statistical data on partner 0.7254
P3 Opportunity to evaluate partner's past performance 0.8535
P4 Independent evaluation of project 0.5871
Factor 1 === > Variable 1: Having advantageous conditions for selecting JV's Partner
2. Factor analysis for Negotiation
Final Statistics:
Variable Communality * Factor Eigenvalue Pct of Var Cum Pct
*
N1 .49565 * 1 2.05817 41.2 41.2
N2 .55816 * 2 1.17061 23.4 64.6
N3 .78565 *
N4 .69989 *
N5 .68944 *
Rotated Factor Matrix:
FACTOR 1 FACTOR 2
- 78 -
N1 .70329 -.03220
N2 .74706 .00787
N3 .82758 .31741
N4 .29908 .78131
N5 -.11954 .82167
- 79 -
3. Factor analysis for Management in the Joint Venture
Final Statistics:
Variable Communality * Factor Eigenvalue Pct of Var Cum Pct
*
D1 .72907 * 1 2.96378 32.9 32.9
D2 .44136 * 2 1.67789 18.6 51.6
D3 .78217 * 3 1.50069 16.7 68.2
D4 .71909 *
S1 .70693 *
S2 .70085 *
S3 .60416 *
S4 .66146 *
G1 .79725 *
Rotated Factor Matrix:
FACTOR 1 FACTOR 2 FACTOR 3
D1 .19317 -.22057 .80194
D2 .57091 -.15389 .30290
D3 .17299 -.85317 .15604
D4 .30430 .78927 .05949
S1 .81484 .18778 -.08780
S2 .61310 .47617 .31342
S3 .77406 .05946 .03819
S4 .79504 -.01483 -.17077
G1 -.22238 .16954 .84797
- 80 -
4. Factor analysis for joint venture's performance criteria
Final Statistics:
Variable Communality * Factor Eigenvalue Pct of Var Cum Pct
*
CP1 .73231 * 1 5.31060 33.2 33.2
CP2 .79844 * 2 2.48134 15.5 48.7
CP3 .80985 * 3 1.68033 10.5 59.2
CP4 .71637 * 4 1.55567 9.7 68.9
CP5 .56610 * 5 1.07616 6.7 75.7
CP6 .67467 *
CP7 .83105 *
CP8 .86993 *
CP9 .67797 *
CP10 .86020 *
CP11 .78012 *
CP12 .64864 *
CP13 .82071 *
CP14 .80650 *
CP15 .80422 *
CP16 .70702 *
Rotated Factor Matrix:
FACTOR 1 FACTOR 2 FACTOR 3 FACTOR 4 FACTOR 5
CP1 .65391 .20518 .20135 .29478 -.36766
CP2 .72653 -.08666 .32314 -.38798 .09014
CP3 -.21373 .12903 .53026 .31032 -.60832
CP4 .81355 .16058 -.10236 .12982 .03737
CP5 -.02262 .30367 .09046 .67025 -.12631
CP6 .03606 .66232 .36317 .25866 .18949
CP7 -.00583 .08159 .18182 .07807 .88612
CP8 .44967 .29530 -.14795 .68680 .29485
CP9 .32703 .66739 .18817 .27761 -.11469
FACTOR 1 FACTOR 2 FACTOR 3 FACTOR 4 FACTOR 5
CP10 .08678 .89911 .06260 .13612 -.14769
CP11 .28465 .74758 -.34094 .15204 .02925
CP12 .60715 .25767 .39602 .17214 .16476
CP13 .59843 .34687 .15482 -.56412 .00811
CP14 .10963 .74403 .39954 -.13941 .24865
CP15 .21742 .17120 .84631 -.08225 .06803
- 81 -
CP16 .82836 .12541 -.01516 -.04569 .05295