Proceedings VCM 2012 53 phát hiện và nhận dạng mã vạch một chiều từ hình ảnh
Bạn đang xem bản rút gọn của tài liệu. Xem và tải ngay bản đầy đủ của tài liệu tại đây (470.16 KB, 6 trang )
Tuyển tập công trình Hội nghị Cơ điện tử toàn quốc lần thứ 6 393
Mã bài: 96
A vision based method for 1D barcode detection and recognition
Phát hiện và nhận dạng mã vạch một chiều từ hình ảnh
Trần Thị Thanh Hải
Viện nghiên cứu quốc tế MICA,
HUST - CNRS/UMI - 2954 - INP Grenoble
e-Mail:
Abstract:
While traditional methods for barcode reading use specific devices (e.g. laser scanners) which are very
disadvantageous because of their lack of mobility, reading barcodes from a camera phone is becoming an
interesting and low-cost solution in this ubiquitous computing era. This paper presents a method for 1D
barcode recognition from images. This method is composed of 2 main phases: barcode location and barcode
decoding. Our contribution found in the barcode location phase where we combine Discrete Cosine Transform
(DCT) based technique and scan-line based techniques to improve the location rate while reducing the
computational times. For the barcode decoding, a statistical recognition is used. The experimental results show
the good performance of our method in comparison with state of the art methods.
Tóm tắt
Hướng tiếp cận truyền thống để nhận dạng mã vạch thường sử dụng các thiết bị chuyên dụng như máy quét
laser. Các thiết bị này thường gắn ở một vị trí cố định, khó di chuyển. Trong một số ứng dụng như tra cứu sản
phẩm tại chỗ (ví dụ trong siêu thị, trên quảng cáo, v.v), hướng tiếp cận đọc mã vạch từ điện thoại di động là
một giải pháp thú vị và ít tốn kém. Bài báo này trình bày một phương pháp nhận dạng mã vạch từ ảnh thu nhận
từ camera của điện thoại di động. Phương pháp đề xuất gồm hai pha chính: định vị mã vạch và giải mã. Các
đóng góp chính của chúng tôi là sử dụng kết hợp hai kỹ thuật quét dòng và phép biến đổi cosin rời rạc cho
phép nâng cao độ chính xác định vị, đồng thời giảm thời gian tính toán. Các thử nghiệm cho thấy phương pháp
đề xuất cho hiệu quả nhận dạng cao, hoàn toàn có khả năng tích hợp trên điện thoại di động cho các ứng dụng
khác nhau như tra cứu sản phẩm trong siêu thị.
1. Introduction
Nowadays, barcodes, 1D barcodes in particular,
play an important role in the modern life. The need
to use barcodes in different applications requires
researches on barcode symbologies (codings) as
well as barcode readers. In reality, there are a lot of
devices for reading barcodes such as barcode pens,
hand-held laser scanners, etc. Laser scanner is the
most popular device that can be found in any marts
/ stores or documentation centers. However, the
biggest disadvantage of this device is its lack of
mobility because most of the time, it can only be
used together with the corresponding Point of Sale
machine.
A current trend for barcode reading is to recognize
1D barcode from images captured by a camera
because of its low-cost and mobile properties.
However, the problem of visual barcode
recognition is not simple. The difficulties come not
only from mistakes during printing barcodes but
also from imaging condition (e.g. shadow,
reflection, dirty surface) that produces distorted,
skew, dirty, too dark/bright barcode images.
This paper presents a method for visual recognition
of 1D barcodes while overcoming some of the
above difficulties. Our framework consists of two
main components: barcode location and barcode
decoding. Our main contribution in this paper
found in the barcode location phase where we
combine Discrete Cosine Transform (DCT) based
technique and scan-line based technique to
improve the location rate while reducing the
computational times.
The paper is organized as follows. In the section II,
we present and evaluate some related works. In the
section III, we propose a framework for 1D
barcode recognition and explain in more detail
each component of the framework. Some
experimental results will be presented in section
IV.
2. Related works
All methods for barcode recognition from images
must deal with two main problems: barcode
location and barcode decoding. In the literature,
394 Trần Thị Thanh Hải
VCM2012
there exists numerous approaches for barcode
localization using analysis of spatial domain [1],
Gabor filtering [2], analysis of Wavelet domain [3],
or DCT domain [4].
Based on the observation that a barcode is
composed of parallel and adjacent bars and spaces,
which are usually aligned horizontally, a barcode
region should be dominated with vertical texture
then a wavelet based method has been used to
locate barcode regions in [3]. With wavelet
transform, an image is divided into four subbands
(one low-frequency subband and three high-
frequency subbands). Using the characteristics of
high-frequency wavelet subbands, some criteria
based on energy of coefficients on the levels of
subbands have been defined to locate barcode
regions. Once a barcode region is located, edges of
bars will be determined by finding the zero-
crossings of the average intensity curve built from
8 parallel scan-lines. For barcode decoding, the
nearest neighbor classification method is used to
find out the most similar reference vector. This
method has been tested with 292 EAN-13 barcode
images taken by a NOKIA 7650 camera phone,
shows a good performance of the method: the
correct barcode location rate is 94.18% and the
correct barcode recognition rate is 85.62%.
However, this method works only under the
following assumptions: barcodes must be placed as
in front of the camera as possible, in the center of
the camera view and the physical barcode’s size
should be bigger than 3cm in length.
DCT expresses a sequence of finitely many data
points in terms of a sum of cosine functions
oscillating at different frequencies. A barcode is
composed of black and white stripes alternative
which are aligned in i-direction, AC-coefficients of
the DCT in i-direction are of high magnitude. As
DCT coefficients of a barcode region not only can
be distinguished from non-barcode region, they
give also information about orientation of the
barcode. These properties are explored in [4] to
locate barcode regions in image. Following the
authors, this method is very fast and gives good
results in case where there are no high textured
regions in the image than barcode regions.
However, the paper did not resolve the problem of
barcode recognition.
Wavelet-based and DCT-based approaches allow
locating barcode regions in images. However, these
methods are sometime quite time-consuming. A
simple but quite efficient technique that is widely
used in the literature is scan-line-based [5], [6].
First, a scan-line passing the center of the image
will be extracted. Then the curve built from the
intensity of points lying on this scan-line will be
smoothed using a Gaussian filter. The maxima /
minima of this smoothed curve will be determined
that help for finding dynamic thresholds for
binarizing the curve. With the binary curve, the
width of spaces and bars will be calculated.
Barcode recognition is done by digit classification
using similarity measure between the candidate and
the references. About 1000 images of barcodes
have been taken by a N95 camera phone. The
recognition rate of 90.5% at 640x480 image
resolution was achieved with assumptions that
there is only one horizontal barcode at the center of
each image.
In summary, most of methods for barcode location
are based on specific properties of barcode, which
are the parallel and dense distribution of bars and
spaces. DCT can locate barcode area in all
directions while current scan-line based approach
can only deal with horizontal barcode. The barcode
recognition rate depends strongly of barcode
location and binarization.
Nowadays, barcode recognition has been
developed as a commercial product and integrated
in several mobile phone platforms such as Red
laser [7], ShopSavvy [8], XZing [9]. The problems
with these products are: 1) The algorithm
developed in each product is not public so we
cannot understand why it works and why not in a
certain case; 2) As commented by some users, the
algorithm does not work well in poor lighting. In
this paper, we would like to present a public
method that provides comparable performance.
3. Vision based 1D barcode recognition
3.1 Brief description of 1D barcodes
In this paper, we are interested into 1D barcodes:
UPC-A, EAN-13 or ISBN-13 because they are
arguably the most widely used throughout the
world to mark retail products that are scanned at
points of sale. However, the framework that we
propose can deal with all kinds of barcodes with a
little modification in the algorithm because both
barcode location and barcode recognition
algorithms are based on the knowledge of barcode
structures and their appearances.
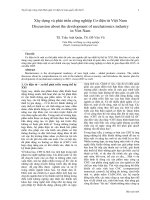
The Figure 1 shows an image of a EAN-13
barcode. The human readable data is written under
the barcode i.e. the machine readable data. This
barcode consists of 13 digits. The last digit is a
checksum computed from the first 12 digits. The
barcode starts with a left-hand guard bar (black-
white-black) and ends with a right-hand guard bar
(black-white-black). Between the guard bars, there
are two blocks, each composed of 6 digits,
separated by a center guard bar (white-black-white-
black-white). Two different EAN-13 barcodes will
Tuyển tập công trình Hội nghị Cơ điện tử toàn quốc lần thứ 6 395
Mã bài: 96
have the same amount of bars and spaces but the
width of these bars and spaces will be different
because they encode different numbers. These
characteristics of barcode will be used in barcode
location and recognition presented in the next
sections.
Figure 1. Structure of an EAN-13 barcode
3.2 Proposed framework for 1D barcode
recognition
Based on analysis on barcode structures and their
appearances, we found that both DCT and scan-
line based techniques are good for barcode
location. For barcode decoding, a statistical method
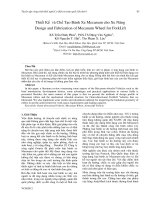
seems to be convenient. We propose therefore a
framework for barcode location and decoding as in
the Figure 2. The framework is composed of 3
principal modules: 1) localization of 1D barcode
region in the image; 2) once the barcode region is
located, it is extracted from the image and
binarized; 3) the binarized barcode region will be
decoded to output a sequence of digits (final
result). In the following, we will explain in more
detail each component of the whole 1D barcode
recognition system.
Figure 2. Framework of 1D barcode recognition
system
1) Localization of Barcode region: This
module consists of 2 components. First, we locate
1D barcode regions using DCT technique. As this
localization is always inaccurate, we then apply the
scanline based technique to re-locate it in order to
find more accurate barcode boundaries (guard
bars).
a) DCT-based method for 1D barcode region
localization:
The algorithm of DCT based barcode location
consists of 10 steps:
1. Divide the input image into 8x8 pixels blocks.
2. Apply DCT on each 8x8 pixels block. This
step will produce for each block 64
coefficients in which the first coefficient DC-
value represents the average value of the
image block, 63 remaining AC-values
represent spatial frequencies of image block in
the ascending order. We set all DC-values of
all image blocks to 0.
3. Calculate the average DCT-block from all
blocks of 8x8 DCT-coefficients.
4. Group all DCT-coefficients
ij
c of one
frequency range f of the average DTC block
into an array
f
G , so that
})1, ,1{)(}, ,1{)(, fifjfjficG
ijf
. For example, },,,,{
23133332313
cccccG .
Then calculate the largest DCT-coefficient
)max(
max ff
Gc
from each frequency range f in
the average block. The coefficients
maxf
c indicate the coefficients in the barcode
area that are strongest.
5. Compute a weight matrix W of dimension 8x8
where each elements w
ij
is defined as follow:
elsek
ccifk
w
d
fije
ij
,
,
max
Where k
d
and k
e
are the emphasis and
desemphasis factors, respectively.
6. Perform an element multiplication of each 8x8
DCT block with W. Then calculate the sum of
each DCT block. The higher the sum of the
DCT-block, the higher is the likelihood that it
belongs to barcode regions. The DCT-sums
make up a subsampled DCT image by a factor
8 in each dimension. We set 0 to negative
values and scale positive values to the range
[0, 255] to create a gray-scale image.
7. Perform morphological closing on the gray-
scale image obtained from step 6 to smooth
the barcode region.
8. Convert gray-scale data into binary using Otsu
thresholding technique.
9. Look for 8-connected components.
10. Choose rectangular connected regions as
candidates of barcode region.
b) Scanline-based method
The DCT based algorithm gives an approximate
location of the barcode region. We consider it as
the region of interest for which we will apply the
396 Trần Thị Thanh Hải
VCM2012
scan-line based technique to re-localize in a more
accurate manner. The output of this phase is a
region of barcode well localized with boundaries
which are correctly determined to pass to the
barcode decoding.
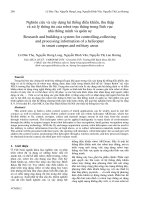
2) Barcode Decoding: Barcode decoding is
carried out in the following steps as illustrated in
the Figure 3. We can see in this figure two main
phases: 1) learning digit classifiers and 2) barcode
decoding given a new barcode area.
a) Digit and barcode representation
As analyzed above, bars and spaces can cover one
to four modules of the same color. Each digit is
composed of two bars and two spaces with a total
width of 7 modules. We represent each digit by a
vector of 4 elements corresponding to the widths of
ordered bars and spaces. This vector will be
normalized to unit magnitude so that it is invariant
in case of scale change of barcode.
Given a binary barcode region, we compute the
widths of bars and spaces by counting the sum of
black /white pixels. To reduce errors produced
during binarization, first we compute average
width of single module then the double, triples;
quadruple modules widths will be calculated. Now,
each barcode region is represented by a 12
elements-vector representing 12 digits. Each
element, corresponding to a digit, is again a 4
elements-vector.
Figure 3. Barcode decoding schema
b) Statistical learning of digit classifiers
The learning of digit classifiers is simple. To build
a digit classifier, we take normalized samples of
this digit from training dataset, compute the
average one and considered it as the reference
vector for this digit class. We do the same for 30
encoded digits (because left-hand digits are
encoded into 2 sets A, B, and right hand digits are
encoded in set C) to obtain 30 reference vectors.
c) Barcode decoding
For recognition, each digit will be compared to
digits learnt during training phase. Left-hand digit
will compared with 20 digits in A, B sets to choose
the most similar one (Euclidian distance based
measure). Similarly, right-hand digit will be
compared with 10 digits in C set to choose the
most similar one. This makes a hypothesis of the
barcode. This hypothesis will be passed to the
verification step of the checksum number. If it is
correct, the hypothesis is confirmed. If not, we
generate other hypothesis (by changing the meta-
number) and verify until we obtain a valid code.
4. Preliminary results and discussions
4.1 Dataset preparation
For learning and testing, a dataset needs to be
prepared. Until now, the number of samples for
training each digit class remains quite modest (we
use only 10 images of barcode). For testing we use
100 images taken from different sources
( or
by ourselves. These images contain barcodes with
different status: change in size, orientation, noise,
dirty, reflections, etc. The image resolution is
640x480.
4.2 Experimental results
The proposed method for barcode recognition will
be evaluated based on 3 performance measures: 1)
barcode localization rate; 2) barcode recognition
rate; and 3) computational time.
Barcode localization rate is the ratio between the
number of located barcode regions and the total
number of barcode regions in the ground truth. A
barcode region is considered as located if the
located region covers more than 80% the ground
truth region. Barcode recognition rate is the ratio
between the number of barcodes which are
successfully decoded and the total number of
barcodes in the ground truth. The computational
time is the total time (in second) that the
recognition system takes to read an input image;
process it then output a localized barcode region
and a digit sequence.
The TABLE I shows performance evaluation of
barcode recognition system using the combined
technique for barcode localization. In all cases, we
use the same recognition technique for barcode
decoding.
Tuyển tập công trình Hội nghị Cơ điện tử toàn quốc lần thứ 6 397
Mã bài: 96
TABLE I. PERFORMANCE EVALUATION OF
BARCODE RECOGNITION METHODS
Method Localizatio
n rate (%)
Recogniti
on rate
(%)
Time
(s)
One scan-line 75 70 1.38
Multiple (6)
scan-lines
80 80 2.28
DCT 80 75 1.54
DCT and
scan-line
80 80 0.33
We found that the technique based on one scan-line
gives worst results in term of barcode localization
and recognition rate. When using multiple scan-
lines, the noisy influence will be decreased, that
improves the performance in both localization and
recognition rate. However, the computational time
will increase. Our proposed method (DCT
combined with one scan-line technique) gives a
better performance in localization rate than the case
using multiple scan-lines. An additional advantage
of this combined technique is that it is quite
efficient in term of computational time.
In the below figures, we show some examples of
barcode localization using our combined method.
We can see this method can deal with difficult
situations such as barcode is un-planar (Figure 4),
barcode is rumpled (Figure 5), or shadowed
(Figure 6). In all of these figures, the green
rectangles are the barcode regions located by the
only DCT technique; the red ones are the barcode
regions localized using the combined technique.
Figure 4. Localization of unplanar barcode
Figure 5. Localization of rumpled barcode
Figure 6. Localization of shadowed barcode
5. Conclusion
In this paper, we presented a framework for
barcode recognition from images. The main
contribution of our framework in comparison with
the literature ones is we used DTC technique to
locate barcode regions that is robust to orientation
and size. The scan-line technique is used next to re-
localize the barcode region so we obtain a more
accurate location of barcode boundaries. This
combined technique is better in barcode location
and computational time for recognition. In the
future, we would like to deploy this method on
mobile phone platform to build an online assistance
system for customers in stores.
Acknowledgments
This study was done in the framework of the
International cooperation project 10/2011/HĐ-
NĐT.
References
[1] D. Chai and F. Hock, Locating and Decoding
EAN-13 Barcodes from Images Captured by
Digital Cameras, in 2005 Fifth International
Conference on Communications and Signal
Processing,. 2005: Bangkok, Thailand. p. 1595
- 1599
[2] A.K. Jain and Y. Chen. Bar code localization
using texture analysis in Proceedings of the
Second International Conference on Document
Analysis and Recognition. 1993.
[3] R. Oktem, Barcode localization in wavelet
domain by using binary morphology, in Proc.
of IEEE SIU'04. 2004. p. 499-501.
[4] A. Tropf and D. Chai, Locating 1-D Bar Codes
in Dct-Domain, in Proceedings. 2006 IEEE
International Conference on Acoustics, Speech
and Signal Processing. 2006: Toulouse, France.
[5] O. Gallo and R. Manduchi, Reading
Challenging Barcodes with Cameras, in Proc.
of IEEE Workshop on Applications of
Computer Vision. 2009, 7. p. 1-6.
[6] S. Wachenfeld, S. Terlunen, and X. Jiang,
Robust 1-D Barcode Recognitionon Camera
Phones and Mobile Product Information
Display, in Lecture Notes in Computer Science,
Springer-Verglas Berlin Heidelberg. p. 53-69.
[7]
398 Trần Thị Thanh Hải
VCM2012
[8]
[9]
Bibliography
Thi Thanh Hai TRAN
graduated in Information Technology from Hanoi
University of Science and Technology in 2001.
She has followed MS degree in Imagery Vision
and Robotic at Grenoble Institute of Technology in
2002. She received her Ph.D. degree from
Grenoble Institute of Technology, France in
2006. She is currently lecturer/researcher at
Computer Vision group, International Institute
MICA, Hanoi University of Science and
Technology. Her main research interests are
visual object recognition, video understanding,
and human-robot interaction.