Structural characterization and biochemical analysis of ID2, an inhibitor of DNA binding 6
Bạn đang xem bản rút gọn của tài liệu. Xem và tải ngay bản đầy đủ của tài liệu tại đây (566.42 KB, 8 trang )
!
43!
necessary and fresh crystals from the same drop were flash-cooled in liquid nitrogen
and sent to a synchrotron X-ray facility for data collection.
HLH24-82-L and the seleno-methionine version HLH24-82-L-Se-Met were sent to
the Argonne National Laboratory synchrotron for data collection.
The native crystal resulted in a 3.1Å resolution dataset which indexed in the
space group P2
1
2
1
2
1
with unit cell parameters a=68.052, b=86.803, c=93.638,
α=β=γ= 90.00°. Based on the volume of the unit cell, and a molecular weight of 8.3
kDa, the Matthews coefficient was 2.77 Å
3
/Da at a solvent content of 55% assuming
6 molecules (3 dimers) per asymmetric unit. A self rotation function in Molrep (CCP4
suite) (Lebedev, et al., 2008) clearly showed 2-fold and 3-fold symmetry, indicating 3
dimers per asymmetric unit.
A MAD dataset was collected for HLH24-82-L-Se-Met at 3 energies: Peak
(12,658.3 eV), Inflection (12,656.5 eV), and Remote (13,058.3 eV) at a resolution
range of 50-2.5Å. Only the peak dataset was used to identify selenium peaks and
was indexed and scaled in space group P3
2
21 with unit cell parameters a=51.5Å,
b=51.5Å, c=111.72Å and α=β=90° γ=120°. Matthews coefficient was 2.52 Å
3
/Da
assuming 2 molecules (1 dimer) in the asymmetric unit at 51% solvent content.
In parallel, a native dataset was collected for the longer form N-HLH82-L from
Brookhaven National Laboratory synchrotron at 2.1Å resolution. Auto-indexing and
scaling was done in space group P3
1
21 with unit cell parameters a=51.62Å,
b=51.62Å, c=111.47Å and α=β=90°, γ=120°. The HKL representation of the
reflections in the kl plane in reciprocal space is given in Figure 12. The Matthews
coefficient was 1.98 Å
3
/Da assuming 2 molecules (1 dimer) in the asymmetric unit at
40% solvent content. Data collection statistics for this native dataset and the
selenomethionine dataset mirrored each other well in terms of space group (trigonal)
and unit cell dimensions (Table 8), as well as Matthews estimations. They also had
!
44!
very similar shaped crystals, even though they were grown in different conditions
(Figure 11).
Table 8: Crystallographic Data Collection Statistics.
Values for the highest resolution shell in parentheses.
Parameters
Native
Selenomethionine
Detector
CCD ADSC
unsupported-q315
CCD MAR300
Wavelength (Å)
1.0809
0.9794
Detector distance (mm)
240
275
Rotation/image (°)
1 and 2
1
Number of images
180 and 90 (merged)
180
Crystal Data
Space Group*
P 31 2 1
P 32 2 1
Unit Cell Dimensions (Å)
a
51.62
51.5
b
51.62
51.5
c
111.47
111.72
α=β=90°, γ=120°
α=β=90°, γ=120°
Diffraction Data
Resolution (Å)
50−2.1 (2.18-2.1)
55.86-2.5 (2.64-2.5)
No. of observed reflections
125386
104381
No. of unique reflections
10569
10160
Average Mosaicity
0.53
0.55
Rmerge
†
(%)
5.8
17.5
<I>/σI
40.6 (4.2)
7.8 (2.1)
Completeness (%)
100 (100)
100 (100)
Multiplicity
11.9 (10.2)
10.3 (10.5)
†
Rmerge = ∑
hkl
∑
i
|I
i
(hkl) – [I (hkl)]|/ ∑
hkl
∑
i
I
i
(hkl), where I
i
(hkl)and [I (hkl)] are the intensity of
measurement i and the mean intensity for the reflection with indices hkl, respectively.
* See Section 4.1 for differing space group explanation
!
!
45!
Figure 12: HKL view of reflections in the kl plane in reciprocal space for N-HLH82-L crystal at
2.1Å resolution.
!
46!
CHAPTER 4: RESULTS and DISCUSSION
(Structure Solution and Insights)
4.1 Structure solution and Refinement
The PHENIX (Adams, et al., 2002) suite of tools was used for most of the
structure solution steps. The top hit after protein sequence alignment against
structures in the PDB was 2QL2. After removal of DNA, monomers and dimers from
chains A and C were used as starting models for PHENIX.AUTOMR, an interface to
Phaser molecular replacement (MR) program. Based on the Matthews estimation of
the number of molecules in the asymmetric unit, 1-6 different ensembles for the
monomers and 1-3 ensembles for the dimers were tested but none yielded any
solutions. Using other HLH structures as templates also did not yield solutions, so the
Se-Met dataset was analyzed instead.
A MAD dataset was collected for HLH24-82-L-Se-Met, but only the peak energy
dataset was required to identify the selenium sites using SOLVE in PHENIX at a
resolution range of 50-2.5Å. The dataset was initially indexed and scaled in space
group P3
1
21. Running SOLVE found 4 peaks corresponding to chain A M33, M62
and chain B M39, M62. However, they did not place well in the density even though
the density had a fairly good protein envelope. So SOLVE was re-run on data re-
indexed in the alternate space group P3
2
21 which placed the Se-Mets within the
density and clearly showed two monomers of ID2. Phasing statistics are given in
Table 9. Unfortunately, the highest resolution shell statistics for this structure was
poor and the best refinement was only acceptable if the data was truncated to around
3Å resolution. Hence, this structure was used as a template for MR of the native
datasets.
!
47!
Table 9: Phasing statistics of Se-Met construct HLH24-82-L-Se-Met.
Values in parantheses are for the highest resolution shell.
Phasing Statistics
HLH24-82-L-Se-Met
Ranom
†
(%)
7.7
Rpim (%)
6.3
Selenium sites
4
Anomalous multiplicity
5.5 (5.4)
Anomalous completeness
100 (100)
DelAnom correlation between half-sets
0.495
Mid-Slope of Anom Normal Probability
1.139
†
Ranom = Sum |Mn (I+) - Mn (I-)| / Sum (Mn (I+) + Mn (I-))
MR on the native HLH24-82-L dataset using the same strategy as before still
provided no viable solution and was abandoned in favour of the higher resolution
dataset of the longer form of ID2, N-HLH82-L. The strategy for running MR was to
use 1-2 ensembles with the Se-Met dimer and monomer respectively while
stipulating that the scaled input file, originally indexed in P3
1
21, apply the alternative
P3
2
21 space group. Both strategies were successful and the resulting coordinates
were used for automated model building (PHENIX.AUTOBUILD) resulting in a model
with optimized phases. Subsequently, the rest of the model was manually built into
2Fo–Fc and Fo-Fc maps using COOT (Emsley, et al., 2004). CNS (Brunger, et al.,
1998) was used at the initiation of refinement to monitor model bias by calculating
simulated annealing composite omit maps. Random assignment of 10% of the
reflections to the Rfree set was used for cross-validation. Further model building and
refinement was done manually by iterative X,Y,Z coordinate and isotropic B-factor
cycles using PHENIX.REFINE. The final model was composed of a 4-helix bundle
refined to 2.1Å with an Rfree value of 25% and no Ramachandran outlier (Table 10,
Figure 13). PyMol (DeLano, 2002) was used for generating all the structural figures in
the following sections and chapters.
!
48!
Table 10: Refinement statistics for native ID2 N-HLH82-L construct.
Refinement
Native N-HLH82-L
Space Group
P32 2 1
Resolution (Å)
44.71−2.10
No. of reflections
10026
Rwork/Rfree
†
(%)
22.5/25.0
No. of atoms
Protein
870
Water
24
Potassium
2
Average isotropic (or equivalent) B factors
Macromolecule
54.4
Solvent
55.3
R.M.S deviations from ideal
Bond angles (°)
1.07
Bond lengths (Å)
0.007
Ramachandran analysis (%)
Favoured
97.09
Allowed
2.91
Outliers
0
†
Rwork = Σhkl[""Fobs" - k"Fcalc""] / Σhkl["Fobs"]; Rfree = Σhkl⊂ T[""Fobs" - k"Fcalc""] / Σ
hkl⊂ T["Fobs"]; hkl⊂T – test set.
!
!
49!
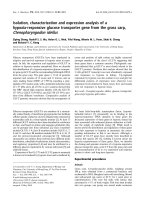
Figure 13: Ramachandran plot of ID2 N-HLH82-L by RAMPAGE (http://www-
cryst.bioc.cam.ac.uk/rampage/) (Lovell, et al., 2003)
-180
0
180
General
-180
0
180
-180 0 180
Pre-Pro
Glycine
-180 0 180
Proline
General Favoured General Allowed
Glycine Favoured Glycine Allowed
Pre-Pro Favoured Pre-Pro Allowed
Proline Favoured Proline Allowed
Number of residues in favoured region (~98.0% expected) : 100 (97.1%)
Number of residues in allowed region (~2.0% expected) : 3 (2.9%)
Number of residues in outlier region : 0 (0.0%)
RAMPAGE by Paul de Bakker and Simon Lovell available at
Please cite: S.C. Lovell, I.W. Davis, W.B. Arendall III, P.I.W. de Bakker, J.M. Word, M.G. Prisant, J.S. Richardson & D.C. Richardson (2002)
Structure validation by C geometry: ! and C deviation. Proteins: Structure, Function & Genetics. 50: 437-450
!
50!
4.2 Overall Structure
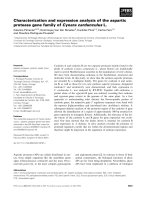
The structure of the ID2 homodimer was solved to 2.1Å resolution. The
asymmetric unit of the crystal contained two monomers of the HLH domain (A and B
chains) (Figure 14A). Even though the protein contained residues 1-82 that included
the N-terminus up to the end of the predicted HLH domain, the first 31 residues had
no interpretable density. The final model of ID2 unambiguously showed the
boundaries of the HLH domain to center around residues 32 to 82 in chain A and
residues 39 to 81 in chain B with the loop region for both chains hinging between
residues 51 to 59. Overall, chain A contained 59 residues corresponding to residues
30 to 82 of ID2 and 6 residues (83 to 88) belonging to the polypeptide stabilizer.
Chain B contained 47 residues corresponding to residues 35 to 82 of ID2 with no
sign of the stabilizing polypeptide.