Structural characterization and biochemical analysis of ID2, an inhibitor of DNA binding 8
Bạn đang xem bản rút gọn của tài liệu. Xem và tải ngay bản đầy đủ của tài liệu tại đây (2.05 MB, 9 trang )
!
55!
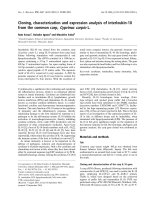
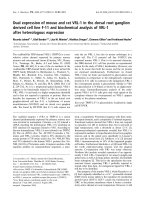
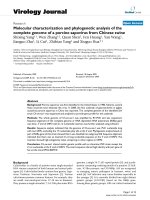
Figure 16: Ribbon representations of ID2 homodimer interactions. ID2: chain A in purple, chain
B in brown, loop in green and potassium ion in grey
(A) Hydrophobic core residues as spheres. The packing of the residues showed how the 2
monomers interacted to form the homodimer.
(B) Hydrogen bonds represented as dashed lines with distances in Å. Intrahelix bonds between
Asn40 and Lys61. Interhelix bonds Tyr43 (chain A) with Tyr43 (chain B), Tyr71 (chain A) and
Leu49 (chain A) shared bond with Gln76 (chain B). cA = chain A, cB = chain B
(C) Conserved hydrogen bonds between ID2 crystal structure (Y43.cA-Y43.cB & Y71.cA-Q76.cB)
and ID3 NMR structure (Y48.cA-Y48.cB & Y76.cA-Q81.cB). ID3: chain A in pink, chain B in red,
loop in olive.
(D) & (E) SDS-PAGE gels showing no protein production where expected (red arrow) in pDest-
565 vector at 17°C induction. U=before induction, P= insoluble pellet fraction, S=soluble fraction.
(D) ID2, Y71 mutants, (E) ID2, Q76 mutants
!
!
56!
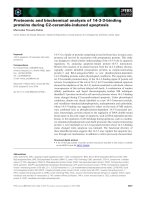
ID2-K61A showed wild-type levels of soluble protein production (Figure 17A). The
equivalent ID3-Q66A mutant did not produce any soluble protein (Figure 17C). To
test for the effect of Q at equivalent positions, the residue from ID2 was exchanged
with the residue in ID3 and vice versa. They were ID3-Q66K and ID2-K61Q.
Expression tests showed that ID2-K61Q produced more soluble protein (Figure 17A)
than wild-type ID2 (Figure 6D, red arrow) and ID3-Q66K did not produce any soluble
protein, thus suggesting the importance of Q66 specifically to ID3’s stability and
solubility.
Figure 17: Loop region mutants of ID2 and ID3. SDS-PAGE: marker (kDa, lane M), before
induction (lane U), insoluble pellet fraction (lane P), soluble fraction (S). Red boxes denote
expected expression region. Gel A and B expression vector was pDest-565 induced at 17°C. Gel
C expression vector was pDest-HisMBP induced at 17°C.
(A) ID2 (N-HLH82-L) mutants: K61A showed wild-type expression in the soluble fraction, double
mutant Q55A_K61A showed the same amount of expression as the K61A mutant and K61Q had
the most soluble protein.
(B) ID2 (N-HLH82-L) mutants: Q55A soluble protein production was similar to that of ID2-K61Q
(gel A)
(C) ID3 (HLH) mutants: R60A had little soluble protein, R60Q had more soluble protein than
R60A. Q66K and Q66A did not express any protein.
(D) ID2 (N-HLH82-L) mutants: Q55R had more insoluble protein fraction than soluble fraction.
!
57!
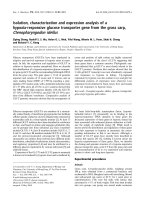
4.3.3 Comparison of ID3 homology model homodimer interactions
The ID3 homology model (Wibley, et al., 1996) showed potential ID2 homodimer
interactions at equivalent positions as follows: N38.cA repulsing K61.cB, D41.cA
hydrogen bonding with Q71.cB and K45.cA forming a salt bridge with D75.cB (Figure
18A). However, these predictions were not observed in the ID2 structure even though
structural and sequence alignments were highly similar (Figure 19). Wibley did show
the potential interaction of ID3.Y76 with ID3.Q81 in their model but made no mention
of it in the text. This interaction corresponded to the Q76.cA-Y71.cB hydrogen bond
in ID2 that was found to be important for homodimer formation. Comparison of these
predictions with the ID3 NMR structure supported the findings of the ID2 crystal
structure. Similar to ID2, these interactions did not exist in the ID3 NMR structure
(Figure 18B) and therefore were highly unlikely to support homodimer formation.
!
58!
Figure 18: Predicted interactions based on ID3 homology model (Wibley, et al., 1996) were not
found in either the ID2 crystal structure nor ID3 NMR structure.
(A) ID2 structure showed equivalent residues from ID3 homology model. Wibley’s postulated
interactions were i) K61 repelling N38 (ID3: D43 repels Q66), ii) Q66 h-bond with D41 (ID3: H46 h-
bond Q71), iii) D70 salt bridge with K45 (ID3: R50 salt bridge with D75). Chain A in purple, chain
B in brown, loop in green. Interaction distances (Å) shown as dashed lines.
(B) ID2 crystal structure superimposed with ID3 NMR structure showed the proposed ID3
homology model interactions from (A). ID2 structure: chain A in purple, chain B in brown, loop in
green. ID3 structure: chain A in pink, chain B in red, loop in olive. Interaction distances (Å)
shown as dashed lines.
!
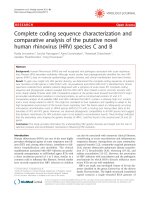
Figure 19: Structural alignment of the bHLH domain of ID proteins and their binding partners.
Alignments were done manually using Pymol’s align function as a guide.
!
!
59!
4.3.4 Disulfide bond in ID2 homodimer formation
In an earlier work, a cysteine residue in helix-1 of ID2 was shown to be critical in
homodimer formation by the creation of an intermolecular disulfide bond (Liu, et al.,
2000). However, the ID2 crystal structure revealed that C42 on each monomer
pointed away from each other and did not form a disulfide bond (Figure 14C).
Superposition of ID2 crystal structure and ID3 NMR structure showed almost identical
conformation of this cysteine residue, thus confirming that it was unlikely to form a
disulfide bond. It is possible that a disulfide bond could be a transient interaction,
acting to bring the monomers closer together to form the functional homodimer.
4.4 Loop region
The loop region of ID2 was unique in terms of having a monovalent positive ion at
the start of the loop that was not previously reported in HLH structures. Contoured at
2.5-sigma, the radius of the 2Fo-Fc electron density map was approximately 1.4Å
using Coot’s crosshairs. This most likely corresponded to a potassium ion based on
size and the fact that the crystallization solution contained 2.5M Potassium Acetate.
2Fo-Fc electron density map contoured at 1.5σ showed the coordination of backbone
oxygens from K47 (helix-1), V50 (helix-1), I53 (loop) and a side-chain oxygen from
Q55 (loop) pointing towards this ion at favourable angles and at distances less than
3.2Å (Figure 14D). This ionic interaction was mirrored in both monomers and could
explain the rigidity of the loop in previous studies where interchanging residues
ID1.L76 (ID2.I53) and ID1.Q78 (ID2.Q55) led to total loss and partial loss of binding,
respectively, to MYOD1 (Pesce, et al., 1993).
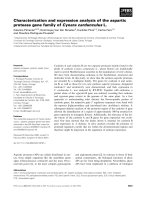
The E47 homodimer reported a hydrogen-bonded network of glutamines at
positions 364, 373 and 381 (Ellenberger, et al., 1994) (Figure 20) that acted to
stabilize the loop. The authors mentioned that these three glutamines were unique to
!
60!
the E-proteins, the group that bound to ID proteins. However, only one bond involving
the side-chains of E47-Q373 and E47-Q381 had a distance less than 3.5Å.
From the E47 structure, the side-chain oxygens of E47-Q364 (helix1), E47-K371
(loop), E47-Q381 (helix2) were coordinated in a very similar way to ID2’s ion-
interacting loop residues. Therefore, it was possible that a similar interaction to a
positive ion held the E47 loop in place (Figure 20). The potentially conserved ionic
interaction of E47-K371 and ID2-Q55 could therefore play a role in binding specificity
of IDs with the E-proteins.
Figure 20: E47 homodimer showing the network of glutamines that were predicted to form
hydrogen bonds but the distances were too far for most of them. Perhaps E47 also had a
positive ion in the loop coordinated by two of the glutamines that held it rigid? (grey sphere).
!
!
61!
Based on sequence alignments (Figure 19), Q364 corresponded to P51 in ID2.
This residue was conserved in ID1, ID2 and ID3 and its mutation in ID1 led to a
complete loss of binding to MYOD1 and E47 (Pesce, et al., 1993). Since prolines
were known to disrupt secondary structures, such as alpha helices, and were
commonly found in turns, where they provided leeway for the structure to change
direction, it was possible that mutation of the proline at this position caused a
geometrical change that was unfavourable to dimerization.
Site directed mutagenesis experiments were done on some of the loop residues
(Table 5) and their surrounds to aid in understanding how differences in the loop
residues were responsible for ID homodimer formation and binding specificities.
Alanine mutants were made to look at residues necessary for dimer formation. Other
mutants exchanged ID2 for ID3 residues and vice versa to look for potential
differences in binding affinities between the ID proteins. ID2-Q55A, Q55R and the
equivalent ID3-R60A, R60Q mutants all expressed some fraction of soluble protein
(Figure 17) which suggested that these residues were not fundamental for stability or
dimerization. However, under the same expression conditions, ID2-Q55R and ID3-
R60A produced less soluble protein than ID2-Q55A or ID3-R60Q respectively. The
ID2 structure showed a side-chain interaction between Q55 and the positive ion. A
change to arginine could potentially repel this interaction and cause loss of protein
solubility. This could explain why a change from the arginine to the glutamine residue
in ID3 increased solubility.
4.5 N-terminal Helix-1 region
Three residues (Table 11) in helix-1 of ID1 and ID3 were proposed to play a role
in differential binding affinity to MYOD1 but not to E47 (Langlands, et al., 1997). In
both the ID2 and ID3 structures, residues ID2-Y37, ID2-D41, ID3-D42, ID3-H46
pointed away from the dimer interface (Figure 21). Previously, ID2-K47 was shown to
!
62!
interact with the loop ion and could potentially have an effect on dimer formation.
ID3-R52 pointed towards the loop in a similar fashion as ID2-K47 and had the
backbone oxygen pointed towards the ion so it was possible that a mutation in this
residue could affect binding in a similar way to ID2.
Table 11: Positions of 3 residues thought to be important for heterodimerization with MYOD1.
ID2
position
37
41
47
residue
Y
D
K
ID1
position
67
71
77
residue
Y
G
K
ID3
position
42
46
52
residue
D
H
R
ID4
position
66
70
76
residue
C
D
R
ID1 and ID3 cloning, expression and purification protocols may be found in
Appendix 5.
!
63!
Figure 21: Ribbon representation of ID2 and ID3 opposing chains to illustrate 3 residues thought
to play an important role in heterodimerization with MYOD1. Residues from ID2 (Y37, D41) and
ID3 (D42, H46) pointed away from the dimer interface. ID2-K47 and potentially ID3-R52 had
interactions with the loop ion that was necessary for homodimer formation of ID2.