Changes in cholesterol metabolome after kainate induced neurodegeneration
Bạn đang xem bản rút gọn của tài liệu. Xem và tải ngay bản đầy đủ của tài liệu tại đây (5.21 MB, 125 trang )
52
Chapter II
Experimental studies
53
Chapter 2.1
Changes in cholesterol biosynthesis after KA-induced
neurodegeneration
Chapter 2.1
Changes in cholesterol biosynthesis after KA-induced neurodegeneration
54
2.1.1. Regulation of cholesterol biosynthesis via SREBP-
2
1. Introduction
Cholesterol biosynthesis is a tightly regulated biochemical reaction
which engages a variety of enzymes and subcellular organelles (Reinhart et
al. 1987). It responds rapidly upon the slight alteration in the environment to
maintain cholesterol homeostasis, which is crucial for membrane fluidity and
signal transduction (Bjorkhem et al. 1998; Frank et al. 2008). Previous studies
have shown increased absolute level of cholesterol in the hippocampus after
excitotoxic injury induced by KA (Ong et al. 2003). This upregulation might be
due to elevated cholesterol biosynthesis in this region since little cholesterol
could cross the BBB. The regulation of biosynthesis of cholesterol involves
various small molecules and protein groups such as INSIGs and SREBPs
(DeBose-Boyd 2008), which assist to maintain cholesterol homeostasis upon
dysregulation of physiological cholesterol level .
In contrast to SREBP-1 being located in neurons of the cortex and
hippocampus (Ong et al. 2000), little is known about the distribution of
SREBP-2, the key regulator of cholesterol synthesis (Brown and Goldstein
1997) in the brain of healthy conditions or after neurodegeneration. Therefore,
this portion of the study was carried out to explore the distribution of SREBP-
2 in the normal brain, and mRNA changes of both cholesterol biosynthesis
regulators, SREBP-2 and INSIG after KA injury.
Chapter 2.1
Changes in cholesterol biosynthesis after KA-induced neurodegeneration
55
2. Materials and methods
2.1. Western blot analysis of distribution of SREBP-2 in normal brain
Four male Wistar rats of 200 g each were used for this portion of the
study. The number of animals was determined to confirm the distribution of
SREBP-2 in various areas of the brain. The rats were deeply anesthetized
with an intraperitoneal (IP) injection of 0.4 ml (0.2 ml/100 g) ketamine and
xylazine cocktail (prepared with 7.5 ml ketamine (75 mg/kg), 5 ml xylazine (10
mg/kg), and 7.5 ml sterile water) and decapitated. The different parts of the
brain including the olfactory bulb, cerebral neocortex, hippocampus, striatum,
thalamus and hypothalamus, brainstem, and cerebellum were then dissected
out, and homogenized in 10 volumes of ice-cold buffer containing 0.32 M
sucrose, 4 mM Tris-hydrochloric acid (HCl), pH 7.4, 1 mM
ethylenediaminetetraacetic acid (EDTA), and 0.25 mM dithiothreitol. After
centrifugation at 15,000 g for 30 min, the supernatant was collected and
protein concentrations in the preparation were measured using the BioRad
protein assay kit (Bio-Rad Laboratories, CA, USA). Total proteins (60 µg)
were resolved in 10% sodium dodecyl sulfate (SDS) polyacrylamide gels
under reducing conditions and electrotransferred to a polyvinylidene difluoride
(PVDF) membrane (Amersham Pharmacia Biotech, Little Chalfont, UK).
Nonspecific binding sites on the PVDF membrane were blocked by incubation
Chapter 2.1
Changes in cholesterol biosynthesis after KA-induced neurodegeneration
56
with 5% nonfat milk for 1 hr. The PVDF membrane was then incubated
overnight with a goat polyclonal antibody to SREBP-2 (1:100 dilution in Tris
buffer saline [TBS]) at 4 °C. The antibody to SREBP-2 (Santa Cruz
Biotechnology, CA, USA) was raised against the N-terminal of SREBP-2 and
is expected to recognize both the precursor and mature form of SREBP-2.
After washing with 0.1% Tween-20 TBS (TTBS), the membrane was
incubated with horseradish peroxidase conjugated anti-goat immunoglobulin
IgG (Amersham) for 1 hr at room temperature. The protein was visualized
with an enhanced chemiluminescence kit (PiPCe, Rockford, IL) according to
the manufacturer’s instructions.
2.2. KA injection
Fourteen rats received intracerebroventricular (ICV) injection of an
excitotoxin KA to see statistically significant changes in the lesioned area.
Also, uneven number of animals per group was because some of the animals
died after KA injury due to the KA neurotoxicity. The morbidity rate was
estimated to be <50 %, and actual morbidity rate was <20%. Four to Six KA
injected animals were enough to show significant pattern of change for each
experiments. These were anesthetized with ketamine and xylazine cocktail.
The cranial vaults were then exposed, and KA (1 µl of 1 mg/ml solution) was
stereotaxically injected into the right lateral ventricle (coordinates: 1.0 mm
caudal to bregma, 1.5 mm lateral to the midline, 4.5 mm from the surface of
the cortex) with a microliter syringe. The needle was withdrawn 10 min later
Chapter 2.1
Changes in cholesterol biosynthesis after KA-induced neurodegeneration
57
and the scalp was sutured. The animals were observed 2 to 4 hr after the
surgery until they wake up from anesthesia and assessed on a scale of 1-4
according to seizure severity (Racine 1972), and were found to have scores
of at least 3. Detailed description of symptoms for each score was explained
below (Table. 1).
Seizure score Symptoms
1 Mouth and facial movements
2 Head nodding
3 Forelimb clonus
4 Rearing
Table.1. Seizure scale (Racine 1972)
The KA injected animals were sacrificed at 1 day, 3 day, 1 week, and 2
weeks post-KA injection. All procedures involving animals were approved by
the Institutional Animal Care and Use Committee.
2.3. Immunohistochemistry
Four control, four 1 day, and four 2 weeks post-KA injected rats were
used for this portion of experiment. The number of animals was determined to
see statistically significant changes in the lesioned area. They were deeply
anesthetized by IP injection of ketamine-xylazine cocktail and perfused
through the left cardiac ventricle with a solution of 4% paraformaldehyde in
Chapter 2.1
Changes in cholesterol biosynthesis after KA-induced neurodegeneration
58
0.1 M phosphate buffer (pH 7.4). The fixed brain tissues were removed and
sectioned coronally at 100 μm using a vibrating microtome. The sections were
divided for cresyl fast violet (Nissl) and immunohistochemical staining. The
sections were washed for 3 hr in phosphate buffered saline (PBS) to remove
traces of fixative. They were then incubated overnight with goat polyclonal
antibodies to SREBP-2 (Santa Cruz Biotechnology, CA, USA, 1:250 dilution),
followed by 3 washes in PBS and incubation for 1 hr at room temperature in a
1:200 dilution of biotinylated horse anti-goat IgG (Vector, Burlingame, CA).
The sections were reacted for 1 hr at room temperature with an avidin-
biotinylated horseradish peroxidase complex, and visualized by treatment for
5 min in 0.05% 3,3-diaminobenzidine tetrahydrochloride (DAB) solution in
TBS containing 0.05% hydrogen peroxide. The color reaction was stopped
with several washes of TBS. Some sections were mounted on glass slides
and lightly counterstained with methyl green before coverslipping. The
remaining sections were processed for electron microscopy. Control sections
were incubated with antigen absorbed antibody instead of primary antibodies
(prepared by incubating 200 µg/mL immunizing peptide with 1:10 dilution of
SREBP-2 antibody overnight). They showed absence of staining.
2.4. Densitometric analysis
Light micrographs were captured using an Olympus BX51 microscope
(Olympus Corporation, Tokyo, Japan), and the density of staining analyzed
using MetaMorph software (Fatemi et al. 2001). The mean density was
Chapter 2.1
Changes in cholesterol biosynthesis after KA-induced neurodegeneration
59
calculated and possible significant differences were analyzed using Student’s
t-test. P < 0.05 was considered significant.
2.5. Electron microscopy
Electron microscopy was carried out by subdissecting some of the
immunostained sections obtained from abovementioned
immunohistochemistry experiments into smaller portions. The tissues were
rinsed in the PBS with 5% sucrose and post fixed in 1% OsO
4
for 1 hr
.
The
samples were washed and then dehydrated in an ascending series of ethanol
and acetone. They were infiltrated with acetone/ resin mix and finally
embedded in Araldite. Thin sections were obtained from the first 5 µm of the
sections, mounted on copper grids coated with Formvar, and stained with
lead citrate. They were viewed using a Jeol 1010EX electron microscope.
2.6. Real-time RT PCR analysis
Four three day post KA injected rats, five one week-post KA injected
rats, five two week post-KA injected rats, and four control rats were used for
this portion of the study. Four to Five animals per group were enough to
produce statistically significant data. The irregularity in number for each
groups were due to the morbidity found in KA injury. The lesioned right
hippocampal specimens were obtained as for Western blot analyses
described above, but immersed in RNAlater® (Ambion, TX, USA), snap
frozen in liquid nitrogen, and kept at -80
o
C till analyses. Total RNA was
extracted from the hippocampus and isolated using TRizol reagent
Chapter 2.1
Changes in cholesterol biosynthesis after KA-induced neurodegeneration
60
(Invitrogen, CA, USA) according to the manufacturer's protocol, and RNeasy®
Mini Kit (Qiagen, Inc., CA, USA) was used to purify the RNA. The samples
were then reverse transcribed using High-Capacity cDNA Reverse
Transcription Kits (Applied Biosystems, CA, USA). Reaction conditions were
25
o
C for 10 min, 37
o
C for 120 min and 85
o
C for 5 sec. Real-time PCR
amplification was then carried out in the 7500 Real time PCR system (Applied
Biosystems, CA, USA) using TaqMan® Universal PCR Master Mix (Applied
Biosystems, CA, USA) and gene-specific primers and probes according to
manufacturer’s protocols. β-actin was used as internal control, and INSIG-1
and 2, SREBP-1 and 2 probes were synthesized by Applied Biosystems. The
PCR conditions were: an initial incubation of 50
o
C for 2 min and 95
o
C for 10
min followed by 40 cycles of 95
o
C for 15 s and 60
o
C for 1 min. All reactions
were carried out in triplicate. The threshold cycle, CT, which correlates
inversely with the levels of target mRNA, was measured as the number of
cycles at which the reporter fluorescence emission exceeds the preset
threshold level. The amplified transcripts were quantified using the
comparative CT method (Livak and Schmittgen 2001), with the formula for
relative fold change = 2
–∆∆CT
. The mean was calculated and possible
significant differences between KA injected and control hippocampal
specimens analyzed using one way ANOVA with Bonferroni’s multiple
comparison post-hoc test. P < 0.05 was considered significant.
Chapter 2.1
Changes in cholesterol biosynthesis after KA-induced neurodegeneration
61
3. Results
3.1. Western blot analysis
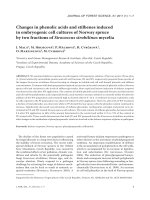
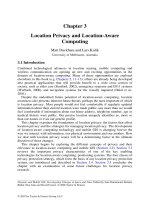
The antibody to N-terminal of SREBP-2 detected a major band at 70
kDa in homogenates from the hippocampus, cerebral neocortex, and
striatum, consistent with the expected molecular weight of mature forms of
SREBP-2 respectively (Fig. 3.1). Lower level of protein expression was
observed in the olfactory bulb, thalamus / hypothalamus, brainstem and
cerebellum (Fig. 3.1). Homogenates incubated with antigen-absorbed peptide
instead of primary antibody showed absence of bands (data not shown).
Fig.3.1. Western blots showing SREBP-2 expression in different parts of the rat
brain. 1: Olfactory bulb, 2: Striatum, 3: Thalamus/hypothalamus, 4: Cerebral
neocortex, 5: Hippocampus, 6: Cerebellum, 7: Brain stem
1 2 3 4 5 6 7
130 kDa -
70 kDa -
β-actin -
Chapter 2.1
Changes in cholesterol biosynthesis after KA-induced neurodegeneration
62
3.2. Immunohistochemistry analyses
3.2.1. Normal rats
Dense staining of SREBP-2 was observed in the hippocampus,
whereas moderate labeling was observed in the cerebral neocortex and
striatum. Relatively light labeling was observed in the thalamus,
hypothalamus, brainstem and cerebellum (Fig. 3.2A). Sections incubated with
antigen absorbed peptide instead of antibody showed absence of labeling
(Fig. 3.2B).
Chapter 2.1
Changes in cholesterol biosynthesis after KA-induced neurodegeneration
63
Fig.3.2. Distribution of SREBP-2 in the normal rat brain. A: Section immunolabeled
with antibody to SREBP-2. Dense staining is observed in the hippocampus (HC),
while moderate staining is observed in the cerebral neocortex (CX) and caudate-
putamen (CPU). The thalamus (TH) is lightly stained. B: Section from the same
animal as A, incubated with antigen-absorbed antibody, showing background
staining. Scale = 2 mm.
HC
CX
TH
CPU
A
B
Chapter 2.1
Changes in cholesterol biosynthesis after KA-induced neurodegeneration
64
Generally, the hippocampus was densely labeled for SREBP-2. The
labeling was observed in the cell bodies and apical dendrites of pyramidal
neurons, and the neuropil in the stratum oriens, radiatum and lacunosum
moleculare of fields CA1 (Fig. 3.3A) and CA3 (Fig. 3.3B). In contrast, little or
no staining was observed in the cell bodies of dentate granule neurons or
their dendritc fields in the stratum granulosum and moleculare of the DG
respectively (Fig. 3.3C). The axonal fields of these neurons, in the stratum
lucidum of CA3 were also unlabeled, except for the dendrites of pyramidal
neurons in CA3 (Fig. 3.3B).
The cerebral neocortex was moderately densely labeled for SREBP-2
except in the piriform cortex, which was densely labeled. Label was observed
in neurons in all six layers of the cortex, and included both pyramidal neurons
and non-pyramidal neurons (Fig. 3.3D). The neuronal cell bodies and neuropil
in layers I-III of the cortex appeared more densely labeled than that of layers
V and VI. Layers II of the piriform cortex, in particular, contained many
densely labeled neurons (Fig. 3.3E).
The striatum was also moderately densely labeled for SREBP-2. Label
was observed in the cell bodies of putative medium spiny neurons and the
neuropil (Fig. 3.3F). Other parts of the basal ganglia including the globus
pallidus, and the substantia nigra were lightly labeled. Light labeling was also
observed in the thalamus, and hypothalamus, the brainstem, and cerebellum
(Fig. 3.3G). Little or no staining was observed in white matter tracts including
the internal capsule and the corpus callosum (Fig. 3.3H).
Chapter 2.1
Changes in cholesterol biosynthesis after KA-induced neurodegeneration
65
Fig.3.3. Light micrographs of SREBP-2 immunolabeled sections from a normal rat
brain. A: Field CA1 of the hippocampus, labeling in the cell bodies and apical
A B
C D
E F
G H
CCX CC
CX
PIR
DG
*
CA1 CA3
*
CPU
Chapter 2.1
Changes in cholesterol biosynthesis after KA-induced neurodegeneration
66
dendrites of pyramidal neurons (arrows). B: Field CA3 of the hippocampus, showing
labeled cell bodies and dendrites of pyramidal neurons (arrows). The terminal field of
axons of dentate granule neurons in the stratum lucidum is unlabeled (asterisk). C:
Dentate gyrus (DG). The cell bodies of dentate granule neurons are unlabeled
(arrows), while light labeling is observed in the stratum moleculare (asterisk). D:
Somatosensory cortex (CX). Moderately dense labeling is observed in both
pyramidal neurons (arrows) and non-pyramidal neurons (arrowhead). E: Piriform
cortex (PIR). Dense labeling is observed in neuronal cell bodies in layer II (arrows).
F: The caudate-putamen (CPU). Moderately dense labeling is observed in the cell
bodies of putative medium spiny neurons (arrows). G: The cerebellar cortex (CCX).
Little or no labeling is observed. H: The corpus callosum (CC). Little or no labeling is
visible. Scale: 100 µm
.
Immunoreactivity was observed in the cell bodies and dendrites of
hippocampal neurons at electron microscopy. Label was observed in the
nucleus (Fig. 3.4A), the somatic cytoplasm, and along the apical dendrites of
pyramidal neurons. Reaction product was found along microtubules of large
diameter dendrites (Fig. 3.4B), and in dendritic spines (Fig. 3.4B, C). The
latter formed asymmetrical synapses with unlabeled axon terminals
containing small round vesicles, typical of glutamatergic axon terminals
(Edwards 1995).
Chapter 2.1
Changes in cholesterol biosynthesis after KA-induced neurodegeneration
67
Fig.3.4. Electron micrographs of SREBP-2 immunolabeled sections from field CA1 of
the hippocampus of a normal rat brain. A: Reaction product (arrows) is observed in
the nucleus (N) and somatic cytoplasm (arrowhead) of pyramidal neurons. B:
Medium sized dendrite (D) in the neuropil. Label is present along the dendritic shaft
(arrows) and in a dendritic spine (arrowhead). C: Asymmetrical synapse (S) between
an unlabeled axon terminal containing small round vesicles (AT) and a labeled
dendritic spine (arrowhead). Scale: A = 1 µm, B = 0.5 µm, C = 0.2 µm
.
AT
S
D
B C
A
N
Chapter 2.1
Changes in cholesterol biosynthesis after KA-induced neurodegeneration
68
3.2.2. KA injected rats
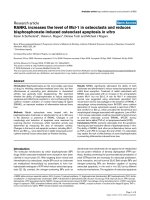
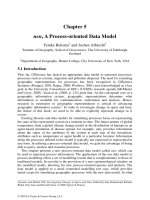
Rats that had been injected with KA for 3 days showed loss of
pyramidal neurons in Nissl sections, and loss of SREBP-2 labeling in the
affected CA fields (Fig. 3.6A). The density of SREBP-2 labeling in these areas
significantly decreased at this time (Fig. 3.5).
Fig.3.5. Densitometric analyses of SREBP-2 immunoreactivity in field CA1 of the
normal hippocampus or after KA lesions. The density of SREBP-2 labeling in the
lesioned areas is significantly reduced to 52% of normal at 3 days, and 58% of
control at 2 weeks post-KA injection. The mean and S.D. are indicated. *:significant
difference by t-test (P < 0.05).
Rats that have been injected with KA two weeks earlier showed dense
glial reaction in the affected CA fields in Nissl sections (Fig. 3.6B). There was
loss of SREBP-2 labeling in the areas affected by the KA injection (Fig. 3.6C),
and the density of SREBP-2 labeling in the centre of the lesion significantly
decreased at this time (Fig. 3.5). Pyramidal neurons that were adjacent to the
areas affected by KA, however, showed increased SREBP-2 labeling in the
0
20
40
60
80
100
120
Normal KA 3 Days
(Lesion)
KA 2 Weeks
(Lesion)
Relative Density of Field CA1 (%)
*
*
Chapter 2.1
Changes in cholesterol biosynthesis after KA-induced neurodegeneration
69
cell body and nucleus (Fig. 3.6D). Neurons that were further away from the
lesion showed normal pattern of staining (Fig. 3.6E). Apart from the
hippocampus, KA injections also resulted in neuronal damage to the piriform
cortex. The latter showed generally decreased staining as in the
hippocampus (data not shown). Sections incubated with antigen- absorbed
antibody showed absence of labeling (Fig. 3.6F).
Chapter 2.1
Changes in cholesterol biosynthesis after KA-induced neurodegeneration
70
Fig.3.6. Light micrographs of field CA1 of the hippocampus from KA-injected rats. A:
SREBP-2 immunostained section from a rat which has been injected with KA 3 days
earlier. There is loss of labeling in neurons in the lesioned areas (asterisk). B–F: Rat
which has been injected with KA 2 weeks earlier. B: Nissl stained section showing
pyramidal neurons (arrowheads) at the edge of the KA lesion (asterisk). C: SREBP-2
immunolabeled section showing loss of labeling in neurons in the lesioned area
(asterisk). D: SREBP-2 immunolabeled section. Some pyramidal neurons at the
edge of the KA lesions (asterisk) show increased SREBP-2 labeling in the cell bodies
(arrowheads) and dendrites (arrows). E: SREBP-2 immunolabeled section. Neurons
*
*
*
A
C
D
E
B
*
F
Chapter 2.1
Changes in cholesterol biosynthesis after KA-induced neurodegeneration
71
further from the lesion show normal pattern of labeling (arrows). F: Section incubated
with antigen-absorbed antibody, showing background labeling. Scale = 100 µm
.
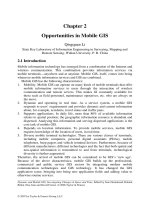
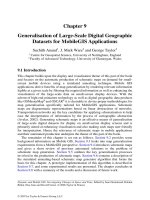
3.3. Real time RT-PCR analysis
Real time RT-PCR analyses showed that mRNA level of SREBP-2
significantly decreased at 1 day, 1 week and at 2 weeks after KA injection. In
addition to SREBPs, significant decrease in INSIG-1 was observed at 2
weeks after KA administration (Fig. 3.7).
Cholesterol Biosynthesis Regulating Proteins
0.0
0.5
1.0
1.5
2.0
2.5
INSIG1 INSIG2 SREBP1 SREBP2
Fold Change
C
KA1D
KA1W
KA2W
#
* * *
Fig.3.7. Real time RT-PCR analyses of INSIGs and SREBPs mRNA in the
hippocampus after KA lesions. SREBP-2 mRNA was significantly reduced at 1 day
and 2 weeks post-KA injection; INSIG-1 mRNA was significantly reduced at 2 weeks
post-KA injection. *: significant difference compared to controls, by 1 way ANOVA
with Bonferroni’s multiple comparison post-hoc test. P < 0.05. #: significant
difference compared to controls, by Bonferroni’s multiple comparison post-hoc test. P
< 0.01.
Chapter 2.1
Changes in cholesterol biosynthesis after KA-induced neurodegeneration
72
4. Discussion
This study examined the distribution of the transcription factor SREBP-
2 in the normal brain, and possible changes of SREBP-2 and other
cholesterol biosynthesis regulators after KA injury. Western immunoblot
analyses of SREBP-2 showed a dense band at 70 kDa corresponding to the
transcriptionally active form of SREBP-2 and a lighter band at 130 kDa, size
for the precursor form of SREBP-2. Tissue homogenates of different parts of
the rat brain showed that the hippocampus expression of SREBP-2 was the
greatest, followed by the cortex or striatum. There were lesser SREBP-2
expression in thalamus/hypothalamus and olfactory bulb. In addition, very
slight SREBP-2 immunoblot reactions were shown in the cerebellum and
brainstem.
SREBP-2 immunolabeled sections demonstrated high expression of
the protein in pyramidal neurons of the hippocampus, and moderate
expression in pyramidal neurons of the cortex and putative medium spiny
neurons of the striatum. Non-specific staining by the SREBP-2 antibody is
unlikely, since sections that were incubated with antigen absorbed antibody
also showed absence of staining. Other sterol metabolizing genes which are
also expressed in hippocampal neurons include cholesterol 24-hydroxylase
which synthesizes 24-hydroxycholesterol (He et al. 2006; Ramirez et al.
2008), the neurosteroid synthesizing enzyme P450 side chain cleavage (Chia
et al. 2008) and the estrogen biosynthetic enzyme (Roselli et al. 1984). These
Chapter 2.1
Changes in cholesterol biosynthesis after KA-induced neurodegeneration
73
observations suggest that hippocampal neurons are particularly active in
sterol metabolism compared to other parts of the brain.
Dense SREBP-2 labeling is observed in the dendrites of hippocampal
neurons at electron microscopy, thus suggesting that dendrites are essential
sites for sensing intracellular cholesterol levels, and dendritic cholesterol
levels play a key role in the feedback regulation of cholesterol in neurons.
Besides SREBP-2, the cholesterol 24-hydroxylase has also been localized to
the cell bodies and dendrites of pyramidal neurons and not axons (He et al.
2006; Ramirez et al. 2008). Cholesterol in lipid rafts of dendrites is crucial for
stability of surface AMPA receptors and synapse formation (Hering et al.
2003). Thus, SREBP-2 localization in dendrites of pyramidal neurons in
hippocampus implies local cholesterol biosynthesis regulation is possibly one
of the ways to response to the changes in cholesterol homeostasis.
The mechanism of end-product inhibition of cholesterol biosynthesis has
recently been elucidated by several groups. This involves cholesterol binding
to INSIGs proteins as well as SREBP-2. When cholesterol level falls, INSIGs
detaches from the SREBP-SCAP complex, allowing complex to move to the
Golgi apparatus for further processing (Flury et al. 2005). Conversely, in
conditions of cholesterol surfeit, the SCAP, INSIG, and SREBP-2 complex is
kept in the ER so that further processing of SREBP is prevented (Wang et al.
2002). This feedback response is severely reduced in INSIG-2 and INSIG-1
double-knockout mice, and SREBP-2 remains activated even when
cholesterol level is augmented (Engelking et al. 2005). SREBP-2 expression
Chapter 2.1
Changes in cholesterol biosynthesis after KA-induced neurodegeneration
74
is also affected by the ABCG1 cholesterol transport protein (Burgess et al.
2008; Tarr and Edwards 2008), one of the key cholesterol efflux pump.
In this study, the expression of SREBP-2 was also examined after KA-
induced neuronal injury. KA injection consistently affects the CA1 and CA3
fields of hippocampus, and produces lesions in these areas, as seen in Nissl
stained sections. Real time RT-PCR analyses revealed that mRNA level of
SREBP-2 was significantly decreased at both 1 day and 2 weeks after KA
injection. Immunohistochemical analyses demonstrated that areas of the
hippocampus affected by KA showed loss of SREBP-2 immunolabeling,
generally supporting the real time RT-PCR results. A decrease in SREBP-1a
immunostaining was also observed in the lesioned areas (data not shown),
probably due to the neuronal injury found in KA lesion. Nevertheless, close
examination of the SREBP-2 labeled sections showed that SREBP-2
immunoreactivity was more elevated in the nucleus and cell bodies of
pyramidal neurons at the edges of the KA lesions at later time points (1~2
weeks after KA injection), compared to the areas further away from the lesion.
It is assumed that this could trigger cholesterol biosynthesis in the neurons
adjacent to the lesion, resulting in increased total cholesterol content in the
KA lesioned hippocampus in these time points (Ong et al. 2003; He et al.
2006). SREBP activation is induced by oxidative stress (Waris et al. 2007),
ER (Colgan et al. 2007) and hypotonic stress (Lee and Ye 2004), which could
be found in KA-induced excitotoxic injury. One possibility is that KA lesions
could result in rapid degradation of INSIG-1 protein as a result of cellular
Chapter 2.1
Changes in cholesterol biosynthesis after KA-induced neurodegeneration
75
stress (Lee and Ye 2004), leading to increased SREBP-2 expression and
cholesterol biosynthesis in neurons at the periphery of the lesions. However,
further studies should be entailed to examine the effect of KA-induced
neurodegeneration on cholesterol biosynthesis.
Chapter 2.1
Changes in cholesterol biosynthesis after KA-induced neurodegeneration
76
2.1.2. Cholesterol biosynthesis pathway
1. Introduction
As shown above, cholesterol biosynthesis is controlled by several
regulating proteins such as SREBP-2 and INSIGs. It also involves a range of
intermediates and mediating enzymes which could branch into different
pathways of isoprenoid, bile acid, and neurosteroid synthesis. Among all,
HMG-CoA reductase, the rate-limiting enzyme for cholesterol biosynthesis is
the major target of cholesterol regulation (Wang et al. 2008). There are two
pathways of cholesterol synthesis. The Bloch pathway takes place via
zymosterol and desmosterol, and the Kandutsch-Russell pathway occurs
through lathosterol and 7-dehydrocholesterol (Lutjohann et al. 2002).
Changes in biosynthetic intermediates not only aggravate cholesterol
accumulation, could also induce metabolic defect (Tansey and Shechter
2000; Debeljak et al. 2003), such as Smith-Lemli-Opitz syndrome. Thus, this
part of the study would give an idea of altered cholesterol biosynthetic
pathways upon KA-induced neurodegeneration by observing levels of
cholesterol biosynthetic enzymes and their activity.