TĂNG HUYẾT áp và các CHỈ số NHÂN TRẮC ở NGƯỜI 25 64 TUỔI tại lâm ĐỒNG năm 2010
Bạn đang xem bản rút gọn của tài liệu. Xem và tải ngay bản đầy đủ của tài liệu tại đây (15.41 MB, 8 trang )
G HUYT ÁP VÀ CÁC CH S NHÂN TRC I 25-64 TUI
T
Lê Quang Đạo
1
, Nguyễn Đỗ Nguyên
2
1
Trung Tâm Y T huyng,
2
Bộ môn Dịch tễ, Khoa Y tế công cộng, Đại học Y Dược TP. HCM
Mục tiêu:
Phương pháp:
hàng ngày.
Kết quả:
Kết luận:
Từ khóa: -mông
SUMMARY
THE PREVALENCE OF HYPERTENSION AND BODY MASS INDEX AMONG
ADULTS AGED 25-64 YEARS AT LAM DONG IN 2010
Background: Lam Dong is a mountainous province in central highland area, with various
ethnic minorities. Prevalence of hypertension and other non-communicable diseases are
increasing with economic growth and modern life styles. There has been no province wide
research to identify the prevalence of hypertension.
Objectives: To determine the prevalence of hypertension among adults aged 25-64 years in
2010.
Methods: A cross-sectional survey using STEPs approach. Study subjects were selected by a
probability proportionate to size two-stage cluster sampling. High blood pressure is defined as a
with antihypertensive. Overweight is defined as body mass index or waist to hip ratio .9
for male, and .8 for female. Frequency distribution, mean, and 95% confidence interval were
adjusted by the inverse of selection probability of a study subject.
Results: The prevalence of hypertension was 16%, higher among males than females. The
overall prevalence including on going treatment subjects was 18%. The proportion of overweight
based on BMI was 7.9%, higher among females than males at both rural and urban areas. Based
on waist to hip ratio, the proportion of overweight was 25%, higher at urban than rural area and
among females than males. An increasing trend the prevalence of hypertension was found with
body mass index in both sexes, and with the higher waist to hip ratio groups.
Conclusion: The prevalence of hypertension in Lam Dong high, especially among
overweight subjects or living in urban areas. Physical inactivity and consumption of energy-rich
foods need to be considered in health education and intervention programs.
Key words: prevalence of hypertension, body mass index, waist to hip ratio.
I. T V
-4Error!
Reference source not found.
-34, 35-44, 45-54, và 55--
-
dù
-
Bng 3.m v dân s xã hi cng nghiên cu phân b theo khu vc
(N=1991).
Khu vc
m
Thành th
Nông thôn
Tng
n
%
n
%
n
%
Gii
(N=997)
(N=994)
(N=1991)
Nam
N
492
505
49,4
50,6
489
505
49,2
50,8
981
1010
49,3
50,7
Nhóm tui
(N=997)
(N=994)
(N=1991)
2534
3544
4554
5564
240
245
255
257
24,0
24,6
25,6
25,8
256
262
250
226
25,8
26,3
25,2
22,7
496
507
505
483
24,9
25,5
25,4
24,2
Dân tc
(N=997)
(N=994)
(N=1991)
Kinh
Khác
845
152
84,7
15,3
862
132
86,7
13,3
1707
284
85,7
14,3
hc vn
(N=995)
(N=993)
(N=1988)
Mù ch
u hc
Tiu hc
Trung h
Trung hc ph thông
i hc
i hc
48
93
252
273
176
147
6
04,8
09,4
25,3
27,4
17,7
14,8
00,6
53
179
392
255
84
27
3
05,3
18,0
39,5
25,5
08,5
02,7
00,3
101
272
644
528
260
174
9
05,1
13,7
32,4
26,6
13,1
08,7
00,4
Khu vc
m
Thành th
Nông thôn
Tng
n
%
n
%
n
%
Ngh nghip
(N=997 )
(N=994 )
(N=1991)
c
Công nhân viên phi chính ph
T làm ch
Làm không công
Sinh viên
Ni tr
Tht nghip có th làm vic
Tht nghip không th làm
vic
147
7
702
9
4
71
40
13
4
14,7
00,7
70,4
00,9
00,4
07,1
04,0
01,3
00,4
20
4
866
17
2
77
5
2
1
02,0
00,4
87,1
01,7
00,2
07,7
00,5
00,2
00,1
167
11
1568
26
6
148
45
15
5
08,4
00,5
78,7
01,3
00,3
07,4
02,3
00,7
00,3
Thu nhp (tring)
(N=971)
(N=924)
(N=1895)
1
89
09,2
209
22,6
298
15,7
>1-
377
38,8
406
43,9
783
41,3
>3-
381
39,2
205
22,2
586
30,9
>7
124
12,8
104
11,2
228
12,0
-
-
-
-
-
-
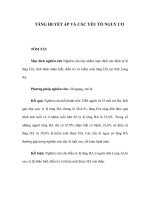
Bm th lc phân b theo gii tính và khu vc (N=1991)
Gii
Khu vc
Nam
N
Hai gii
Trung
bình
Sai s
chun
n
Trung
bình
Sai s
chun
n
Trung
bình
Sai s
chun
n
Thành th
BMI
2
(%)
T s eo-mông
Béo bng (%)
21,5
11
0,8
16
0,19
2,9
0,009
4
492
63
492
92
21,7
11
0,8
43
0,18
1,7
0,004
3,4
500
64
499
252
21,6
11
0,8
30
0,17
1,9
0,007
3,5
992
127
991
344
Nông thôn
BMI
2
(%)T s eo-mông
Béo bng (%)
20,6
4
0,8
7,3
0,22
0,99
0,003
1,6
489
21
487
41
20,6
5,2
0,8
35
0,16
1,1
0,003
2,1
504
31
494
205
20,6
4,6
0,8
21
0,15
0,6
0,002
1,2
993
52
981
246
Tng
BMI
2
(%)
T s eo-mông
Béo bng (%)
21
7,6
0,8
11
0,18
1,7
0,005
2,3
981
84
979
133
21
8,2
0,8
39
0,18
1,2
0,003
2,3
1004
95
993
457
21
7,9
0,8
25
0,17
1,3
0,004
2,1
1985
179
1972
590
(T s eo- nam ho n)
Nh
nam
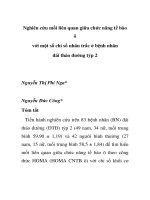
Bng 3.3. Tr s huyt áp và t l THA phân b theo gii tính và khu vc (N=1991)
Gii
Huyt áp
(mmHg)
Nam
N
Hai gii
Trung
bình
Sai s
chun
N
Trung
bình
Sai sô
chun
N
Trung
bình
Sai sô
chun
N
Thành th
HA tâm thu
THA-1 (%)
THA-2 (%)
127
77
21
23
1,1
1,01
3,04
3,4
492
492
130
139
118
73
10
13
0,7
0,4
1,7
1,4
505
505
78
98
123
75
16
18
0,6
0,7
1,9
2
997
997
208
237
Nông thôn
HA tâm thu
THA-1 (%)
THA-2 (%)
127
78
22
23
1,6
1,4
4,6
4,3
489
489
127
135
119
73
12
13
0,98
0,96
1,1
1,05
505
505
80
89
123
76
17
18
0,9
0,9
2,3
2,4
994
994
207
224
Tng
HA tâm thu
THA-1(%)
THA-2(%)
127
78
21
23
0,96
0,8
2,7
2,7
981
981
257
274
119
73
11
13
0,6
0,5
1,01
0,9
1010
1010
158
187
123
75
16
18
0,5
0,6
1,5
1,5
1991
1991
415
461
(THA- trên s t áp thm nghiên cu; THA- trên s t
áp thm nghiên cu và tin s có THA)
Nhn xét: Trung b
huy
n m
huy
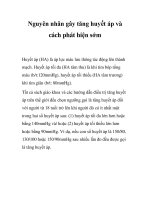
Bng 3.4. THA phân b theo nhng ch s th lc (N=1991)
Gii
Ch s
Nam
N
Hai gii
n (%)
PR (KTC 95%)
n (%)
PR (KTC 95%)
n (%)
PR (KTC 95%)
BMI (kg/m
2
)
ng
Nh cân
Nng cân
Béo phì
120 (16)
46 (21)
52 (29)
39 (57)
1
1,3 (0,9-1,9)
1,8 (1,1-2,9)
3,5 (2,5-5)
90 (9)
19 (9)
30 (16)
18 (24)
1
0,99 (0,6-1,7)
1,7 (1,04-2,8)
2,5 (1,5-4,2 )
210 (13)
65 (15)
82 (23)
57 (40)
1
1,2 (0,8-1,8)
1,8 (1,2-2,6)
3,2 (2,2-4,5 )
T s eo-mông
Cao
ng
61 (41)
196 (19)
2,2 (1,5-3,1)
94 (16)
64 (8)
1,9 (1,2-3)
155 (22)
260 (14)
1,5 (1,1-2)
Nhn xét: T s
l THA nhóm tha cân béo phì
theo BMI cao gp 3,2 ln so vng (KTC 95%: 1,1-2,0). T l THA nhóm có
ch s eo mông cao, cao gp 1,5 ln so vng (KTC 95%: 1,1-2,0).
-
2
kg/m
2
2
1
-mông chung
-
Trong
-
(KTC95%: 2,2-
2,67; KTC 95%:1,75-
-
]
.
-
-
-
ng
THA
1. -
Tháng 12-2005, pp. 36-47.
2.
3.
-48.
4.
-98.
5.
6.
.
31/12/2010.
7. Hà
8. -
9.
-237.
10. -
, .
11. F Tesfaye, N G Nawi, H Van Minh et al (2007), Association between body mass index
and blood pressure across three populations in Africa and Asia, Journal of Human
Hypertension, 21:2837.
12. Howsom CP, Reddy KS, Ryan TJ et al (1998), Control of cardiovascular diseases in
developing countries, National academy press Washington, D.C 1998.
13. National Institutes of Health (2007), Aim for a Healthy Weight: Assess your Risk, pp 07-
08.
14. Nguyen T Tuan, Linda S Adair, Chirayath M Suchindran et al (2009). The association
between body mass index and hypertension is different between East and Southeast
Asians. The American Journal of Clinical Nutrition vol. 89 no. 6 1905-1912
15. US Deparment of health and Human Services (2004), The Seventh report of the Joint
National Committee on Prevention, detection, evaluation, and treatment of high blood
pressure 2003, Publication No 4 5230.
16. Yusuf S, Hawken S, Ounpuu S, et al. (2005), Obesity and the risk of myocardial
infarction in 27,000 participants from 52 countries: a case-control study, Lancet, 366
(9497): 16409.