Báo cáo nghiên cứu khoa học: "Tỷ lệ tăng huyết áp và các yếu tố liên quan đến người cao tuổi trong tỉnh Khánh Hòa, Việt Nam" doc
Bạn đang xem bản rút gọn của tài liệu. Xem và tải ngay bản đầy đủ của tài liệu tại đây (439.84 KB, 9 trang )
287
JOURNAL OF SCIENCE, Hue University, N
0
61, 2010
HYPERTENSION PREVALENCE AND RELATED FACTORS
IN ELDERLY PEOPLE IN KHANH HOA PROVINCE, VIETNAM
Truong Tan Minh, Le Tan Phung et al
Khanh Hoa Provincial Health Service
SUMMARY
Hypertension is one of the major health problems among Elderly People has been
investigated by many Vietnam authors. Vietnam Institute of Health Strategy and Policy
presented a hypertension percentage of 28,4% among Elderly People of aged 60 years or above
in 2006. Based on a systemic randomized sample of Elderly People living in Khanh Hoa
Province, hypertension prevalence and related factors have been examined. Using cluster
sampling with 30 communes seleted from the total of 137 communes of the Khanh Hoa Province,
authors had chosen a sample of 2,170 Elderly People to measure blood pressure and collect
other anthropometric indeces (weight, height). Correlation and Logistic regression analysis has
been used to examine possitive association between anthropometric factors and
hypertension.Mean systolic and mean diastolic blood pressures were statistically different in
men and women Elderly People with higher percentage in Men. Mean BMI of Elderly People
was 20.26 with slightly higher in Men but no statistically significant (20.40 vs 20.17).
Hypertension prevalence in Elderly People of Khanh Hoa Province was 48.1% with higher
percentage in Men than Women (52.2% and 45.4%, respectively, p = 0,002). The Raglai
minority people who are mostly living in the 2 mountainous districts have a relatively low
percentage of hypertension (29.7%). There is an association between hypertension and BMI,
especially in Women. The survey showed that the prevalence of hypertension among Elderly
People in Khanh Hoa in 2008 was 48.1% (95% CI: 46,0% - 50,2%). There were associations
between hypertension prevalence with BMI as well as age using multiple regression model with
gender plays the role of interaction in the model.
Key words: Hypertension, Elderly People, Body Mass Index, World Health
Organization.
1. Introduction
Vietnam now has approximately 7 million elderly People, accounting for 10% of
the population. The aging problem has been an increasing concern in Vietnam in terms
of socio-economic status. In an International workshop on Care for Elderly People held
in Hanoi in 2009, experts showed that health care costs for elderly people was 7 times
288
higher than the cost of other adults. Common diseases and health problems in elderly
people are hypertension, cardiovascular diseases, endocrinologic disorders, depression,
arthritis etc. These affect significantly the life quality of elderly people.
Studies in Vietnam as well as in the world showed that hypertension is
increasingly becoming a health problem of concern. A multi-center study in Bangladesh
and India conducted by the WHO gave a prevalence of hypertension among Elderly at
65%. The prevalence was higher in urban area and showed no significant difference by
gender. Nguyen Dang Phai’s study on hypertension prevalence among Elderly People in
Hai Duong Province – Vietnam based on a sample of 3,117 Elderly People selected in
community, showed that the hypertension prevalence was 28.2% with higher among
male (30.3% vs 26.7%). Another survey conducted by the National Institute of Health
Strategy and Policy in 7 provinces of Vietnam showed the hypertension prevalence of
28.4%.
Khanh Hoa is a Southern-Central Province of Vietnam comprised of 8 districts
with a population of approximately 1.2 million. This survey aims at examining
hypertension prevalence as well as related factors in Elderly People who are living in
Khanh Hoa.
2. Methods
The study population was Elderly People (60+ years of age) who lived in Khanh
Hoa province at the time of study (from Nov to Dec 2008). A cross-sectional design was
used with cluster sampling based on 30 communes selected conveniently from 137
communes in the province. Sample size was determined by the following formula:
2
)
2
1(
2
)1(
d
pp
zn
In which: n = sample size
p = hypertension prevalence, take p = 50%.
d = desired precision, select d = 3%.
Calculated n = 1,067. Adjusted with design effect (DE=2) and 5% missing
subjects, we have the final sample size was 2,240 Elderly People. Data collected was
age, gender, ethnicity, systolic and diastolic blood pressure, height and weight.
Data were entered by EpiData Software version 3.1, analyzed by Stata version
10.0.
3. Results and discussion
3.1. Baseline data
There were a total of 2,170 Elderly People seleted for the sample because of
289
some missing and some under 60 years old. Over 60% of the sample was female,
reflecting a larger proportion of females amongst the Elderly population. More than
80% of them were under the age of 80. The age group between 80 and 89 had a
proportion of 17%. Raglai Ethnic minority People accounted for 3% of the Elderly
population (Table 1)
Table 1. Baseline Characteristics of the Sample of Elderly People
Items
Frequent
(n=2,170)
Percent %
Gender:
Male
Female
849
1,321
39.1
60.9
Age groups:
From 60-69 years old
From 70-79 years old
From 80-89 years old
From 90-99 years old
>=100 years old
885
866
367
50
2
40.8
39.9
16.9
2.3
0.1
Ethnicity:
Kinh
Raglai
T’rin
Others
2,095
64
1
10
96.5
2.9
0.1
0.5
3.2. Anthropometric characteristics of Elderly People
3.2.1. Weight
The mean weight of the sample was 49 kg ± 8.7 kg. The mean weight of males
was significantly higher than females (Table 2).
Table 2. Mean weight of Elderly People by gender
Gender Mean weight SD Test
Male (n = 849) 52.4 kg 8.5 kg
t
2168
= 15.025
p = 0.000…
Female (n = 1,321) 46.9 kg 8.2 kg
290
Total (n = 2,170) 49.0 kg 8.7 kg
3.2.2. Height
The mean height of the sample was 155cm ± 7.3cm with a statistically higher
mean among elderly males (160 cm vs 152 cm).
Table 3. Mean height of Elderly People by gender
Gender Mean height SD Test
Male (n = 849) 160 cm 6.4 cm
t
2168
= 28.622
p = 0.000…
Female (n = 1,321) 152 cm 6.1 cm
Total (n = 2,170) 155 cm 7.3 cm
3.2.3. Body Mass Index (BMI).
The mean BMI of the sample was 20.26 kg/m
2
. There was no significant
difference in mean BMI between men and women (Table 4).
Table 4. Mean BMI of Elderly People by gender
Gender Mean BMI SD Test
Male (n = 849) 20.40 3.01
t
2168
= 1.683
p = 0.0926
Female (n = 1.321) 20.17 3.14
Total (n = 2.170) 20.26 3.09
According to the WHO classification of BMI (with 4 categories: underweight,
normal, overweight, and obesity), this survey showed a percentage of 30% underweight,
whereas normal BMI was 64%. The very small proportion of overweight (5.6%) and
obesity (0.3%) reflects that overweight and obesity are not a health problem among
Elderly People in Khanh Hoa province (Table 5).
Table 5. BMI classification of Elderly People by gender
Category Male Female Total Test
Underweight
239
(28.2%)
409
(31.0%)
648
(29.9%)
χ
2
= 2.7525
p = 0.431
Normal
562
(66.2%)
832
(63.0%)
1,394
(64.2%)
Overweight
45
(5.3%)
77
(5.8%)
122
(5.6%)
291
Obesity
3
(0.3%)
3
(0.2%)
6
(0.3%)
Total 849 1,321 2,170
3.3. Hypertension prevalence.
3.3.1. Mean systolic and diastolic blood pressures.
Mean blood pressures, both systolic and diastolic pressure were significantly
different between men and women. Men had higher mean blood pressures than women
(p<0.001).
Table 6. Mean blood pressures by Gender
Gender Total Mean BP SD Test
Systolic blood pressure (mmHg)
Male 849 138 20.6
t
2166
= 3.313
p = 0.0009
Female 1,319 135 20.9
Total 2,168 136 20.8
Diastolic blood pressure (mmHg)
Male 849 82 9.9
t
2166
= 3.989
p = 0.0001
Female 1,319 80 10.7
Total 2,168 81 10.4
3.3.2. Hypertension prevalence.
Based on definitions and classification of Blood Pressure Levels by WHO/ISH
[5], the prevalence of hypertension among Elderly People in Khanh Hoa province was
48.1% that is significantly higher than Nguyen Dang Phai’s and Dam Viet Cuong’s
surveys. Hypertension among men was statistically higher than that among women:
52.2% vs 45.4% (Table 7).
Comparing hypertension prevalence among Kinh People and Raglai People,
who are the main ethnic minority group living in Khanh Hoa Province (most of them
are in Khanh Son and Khanh Vinh district), the survey showed a higher hypertension
prevalence among Kinh People, probably related to urbanization and sedentary lifestyle
in Kinh Pepole.
292
Table 7. Hypertension by Gender and Ethnicity
Gender Total Hypertension Percent Test
Gender
849 443 22.5
χ
2
=9.46
p = 0.002
1,321 600 45.4
2,170 1,043 48.1
Ethnicity
2,095 1,016 48.5
χ
2
=8.8
p = 0.003
64 19 29.7
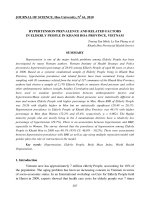
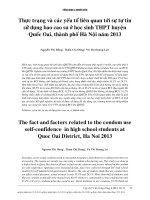
3.4. Associations between blood pressure and anthropometric index.
Drawing scatter plots by using Stata software showed positive association
between systolic blood pressure and BMI and age. Systolic blood pressure has
increasing tendency in proportion of BMI to age. Figure 1 and Figure 2 showed those
associations.
100 150 200 250
sysBP
60 70 80 90 100
age
sysBP Fitted values
Figure 1. Association between systolic blood pressure and age
293
100 150 200 250
sysBP
10.00 15.00 20.00 25.00 30.00 35.00
bmi
sysBP Fitted values
Figure 2. Association between systolic blood pressure and BMI
Analyzing associations by gender showed a stronger association in females than
males in terms of systolic blood pressure and BMI as shown in Figure 4 and a stronger
association in males than females in terms of systolic blood pressure and age as shown
in Figure 3.
100 150 200 250
60 70 80 90 100 60 70 80 90 100
female male
sysBP Fitted values
sysBP
age
Graphs by gender
Figure 3. Association between systolic blood pressure and age by Gender
294
100 150 200 250
10.00 20.00 30.00 40.0010.00 20.00 30.00 40.00
female male
sysBP Fitted values
sysBP
bmi
Graphs by gender
Figure 4. Association between systolic blood pressure and BMI by Gender
Using multiple logistic regression, the model is showed below. However, this
model is weak (R
2
= 0.0329)
log(sysBP) = 4.5391 + 0.0034*age – 0.0017*gender*age +
0.0051*log(BMI)*gender
where: sysBP is systolic blood pressure, gender = 1 if gender is female and = 0 if
gender is male.
4. Conclusion
4.1. The hypertension prevalence among Elderly People of Khanh Hoa Province
is 48.1% (95% CI: 46.0% - 50.2%).
4.2. Hypertension is higher in elderly males than females (52.2% vs 45.4%), and
higher in Kinh People than Raglai People (48.5% vs 29.7%). Both differences are
statistically significant.
4.3. There are positive associations between systolic blood pressure and age, and
BMI. Gender plays as an interaction role in the multiple logistic regression model.
295
REFERENCES
1. The Communist Party of Vietnam (CPV) Online Newspaper. International workshop on
Care for Elderly People on the web at
/>58, dated 20/11/2009.
2. WHO - Hypertension Study Group. Prevalence, Awareness, treatment and Control of
Hypertension among the Elderly in Bangladesh and India: A multicentre study. Bulletin
of the WHO, Vol 79 No 6, 2001.
3. Nguyễn Đăng Phải. Survey on hypertension and building a model of caring for Elderly
People based on Community. Report to the provincial committee of Hai Duong, on the
web dated 30/11/2009.
4. Dam Viet Cuong et al. Examine Caring for Elderly People in Vietnam – summary report
of the year 2006 on the web at 30/11/2009.
5. WHO/ISH writing group. 2003 World Health organization (WHO)/International Society
of Hypertension (ISH) statement on management of hypertension. “Journal of
Hypertension” Vol 21, No 11. 2003.