Multi objective optimization based image segmentation method and applications
Bạn đang xem bản rút gọn của tài liệu. Xem và tải ngay bản đầy đủ của tài liệu tại đây (1.86 MB, 87 trang )
MULTI-OBJECTIVE OPTIMIZATION BASED IMAGE
SEGMENTATION: METHOD AND APPLICATIONS
KARTHIK RAJA PERIASAMY
B.Tech(Hons.), National Institute of Technology, Durgapur, India
A THESIS SUBMITTED
FOR THE DEGREE OF MASTER OF ENGINEERING
DEPARTMENT OF CHEMICAL & BIOMOLECULAR ENGINEERING
NATIONAL UNIVERSITY OF SINGAPORE
2012
ii
ACKNOWLEDGMENTS
I would like to start with thanking my supervisor Prof. Laksh for his support
and guidance during my term at NUS. Whenever I have lost sight of my goal, he has
always guided me back to the trail. I have always been a great admirer of his work
ethic and his dedication towards teaching. I have enjoyed some long chats with him
(related to topics other than research) and am taking inspiration from that for my
career after NUS. I also want to thank him for giving me an opportunity to tutor
some of his modules which has completely changed my outlook towards teachers.
I would also like to extend my gratitude to Prof. Rangaiah for giving me an
opportunity to tutor in CN3421, Dr. Zhou Ying for willingly sharing the crystallization process images to allow me to understand the real images and Dr. Ranga
for giving me the breast cancer ultrasound images from IIUM Breast Centre for
analysis. I am thankful to Prof. Q. G. Wang and Prof. Min-Sen Chiu for agreeing
to examine my thesis. Prof. Natarajan also deserves a special mention for giving me
an opportunity to interact with people to get an insight in the food and beverage
industry. I am also grateful to Ms. Samantha, Mr. Rajamohan and other departmental staff for their willingness to help out with any problems regarding computer
and other facilities immediately without any hassles.
I am glad to have been a part of Informatics and Process Control Unit (IPCU).
I have been lucky to have had an opportunity to work with my group mates who
have willingly spent time to help me solve my problems and I take this opportunity
to acknowledge them for their contributions in my work.
I am always grateful to my family for their hope and belief in me and their
financial support. I am indebted to my friends, who have played a huge role in my
life. I have some great friends from all over the world who have supported me till
iii
this time and I hope I can hold onto them forever. I would always cherish the times
I have spent with them.
I would also like to thank NUS for giving me an opportunity to conduct research
and pursue my masters at Singapore.
Last but not the least, I am thankful to God for everything. I always find solace
in praying and the God has always played a part in my life.
iv
TABLE OF CONTENTS
Page
Summary . . . . . . . . . . . . . . . . . . . . . . . . . . . . . . . . . . .
vii
List of Tables . . . . . . . . . . . . . . . . . . . . . . . . . . . . . . . . .
ix
List of Figures . . . . . . . . . . . . . . . . . . . . . . . . . . . . . . . .
xi
Abbreviations . . . . . . . . . . . . . . . . . . . . . . . . . . . . . . . . .
xiii
Nomenclature . . . . . . . . . . . . . . . . . . . . . . . . . . . . . . . . .
xv
1 Introduction . . . . . . . . . . . . . . . . . . . . . . . . . . . . . . . .
1
1.1
Motivation . . . . . . . . . . . . . . . . . . . . . . . . . . . . . . .
1
1.2
Background . . . . . . . . . . . . . . . . . . . . . . . . . . . . . .
2
1.3
Objectives . . . . . . . . . . . . . . . . . . . . . . . . . . . . . . .
3
1.4
Organization of the Thesis . . . . . . . . . . . . . . . . . . . . . .
4
2 Definitions and developments in image analysis . . . . . . . . . .
5
2.1
Digital Image . . . . . . . . . . . . . . . . . . . . . . . . . . . . .
5
2.2
Image operations . . . . . . . . . . . . . . . . . . . . . . . . . . .
6
2.2.1
Types of operations . . . . . . . . . . . . . . . . . . . . . .
6
2.2.2
Image neighborhood . . . . . . . . . . . . . . . . . . . . .
7
2.3
Image histogram . . . . . . . . . . . . . . . . . . . . . . . . . . .
8
2.4
Image analysis . . . . . . . . . . . . . . . . . . . . . . . . . . . . .
9
2.4.1
Image acquisition . . . . . . . . . . . . . . . . . . . . . . .
9
2.4.2
Image pre-processing . . . . . . . . . . . . . . . . . . . . .
11
2.4.3
Image segmentation . . . . . . . . . . . . . . . . . . . . . .
13
2.4.4
Feature extraction and classification . . . . . . . . . . . . .
14
Image analysis in crystallization . . . . . . . . . . . . . . . . . . .
15
2.5.1
Literature on estimation of CSD based on image analysis .
16
Image analysis in breast cancer detection . . . . . . . . . . . . . .
17
2.5
2.6
2.6.1
Literature on breast ultrasound images detection and classification based on image analysis . . . . . . . . . . . . . . . .
18
v
Page
2.7
Challenges in image analysis . . . . . . . . . . . . . . . . . . . . .
19
3 Multi-objective optimization based image thresholding . . . . .
23
3.1
Optimization based on single objective . . . . . . . . . . . . . . .
24
3.1.1
Otsu method . . . . . . . . . . . . . . . . . . . . . . . . .
24
3.1.2
Minimum error method . . . . . . . . . . . . . . . . . . . .
25
Multi-objective optimization . . . . . . . . . . . . . . . . . . . . .
26
3.2.1
Converting a MOO problem into a SOO problem . . . . .
27
3.2.2
Simulated annealing . . . . . . . . . . . . . . . . . . . . .
28
3.3
Problem formulation . . . . . . . . . . . . . . . . . . . . . . . . .
30
3.4
Results and discussions . . . . . . . . . . . . . . . . . . . . . . . .
32
3.4.1
Example 1 . . . . . . . . . . . . . . . . . . . . . . . . . . .
33
3.4.2
Example 2 . . . . . . . . . . . . . . . . . . . . . . . . . . .
36
4 Image analysis applications for real-world problems . . . . . . .
39
3.2
4.1
4.2
Case I - Estimation of crystal size distribution: image thresholding
based on multi-objective optimization . . . . . . . . . . . . . . . .
40
4.1.1
Image acquisition . . . . . . . . . . . . . . . . . . . . . . .
40
4.1.2
Image pre-processing . . . . . . . . . . . . . . . . . . . . .
43
4.1.3
Image segmentation . . . . . . . . . . . . . . . . . . . . . .
45
4.1.4
Feature extraction . . . . . . . . . . . . . . . . . . . . . .
49
Case II - Classification of ultrasound breast cancer tumor images
based on image analysis . . . . . . . . . . . . . . . . . . . . . . .
56
4.2.1
Image acquisition . . . . . . . . . . . . . . . . . . . . . . .
56
4.2.2
Image pre-processing . . . . . . . . . . . . . . . . . . . . .
56
4.2.3
Image segmentation . . . . . . . . . . . . . . . . . . . . . .
57
4.2.4
Feature extraction . . . . . . . . . . . . . . . . . . . . . .
59
5 Conclusions and Future Work . . . . . . . . . . . . . . . . . . . . .
61
5.1
Conclusions . . . . . . . . . . . . . . . . . . . . . . . . . . . . . .
61
5.2
Future work . . . . . . . . . . . . . . . . . . . . . . . . . . . . . .
62
Bibliography . . . . . . . . . . . . . . . . . . . . . . . . . . . . . . . . .
65
Appendix B - Publications & Presentations . . . . . . . . . . . . . .
71
vi
SUMMARY
Image analysis plays a crucial role in various fields such as biology, medicine,
remote sensing, robotics and manufacturing. Image segmentation is a critical step
in image analysis since the result of segmentation plays an important role in feature extraction. In this work, image segmentation is carried out by thresholding.
Generally, the threshold is selected by optimizing a single objective. Thresholding
can be improved by combining the objectives of two different methods (Otsu and
minimum error thresholding methods). Hence, in this work, the optimum threshold is calculated by solving a multi-objective optimization (MOO) problem. The
two objectives used in this work are maximizing the between-class variance and the
minimizing the error while histogram fitting. This MOO is solved using the plain
aggregating approach and simulated annealing by assigning appropriate weights to
each objective function. The MOO based thresholding overcomes the limitations of
the individual approaches and outperforms the results obtained by thresholding using either of the single objectives. The misclassification rate of the MOO approach
is compared with the traditional Otsu and minimum error thresholding methods.
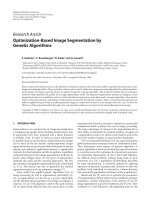
The MOO based approach is tested on several examples. The first application is
in the estimation of crystal size distribution (CSD) using Particle Vision and Measurement (PVM) images to assist in crystallization process control. In this study,
the segmentation results of the developed method are compared with the results of
Otsu and minimum error method. The segmented images are further processed by
means of feature extraction to estimate the CSD. The algorithm is tested on a set
of artificially generated crystallization images. The accuracy of this algorithm is
gauged by comparing the CSD estimated to the data used to generate the artificial
images. This accuracy was found to be around 92% for images in which about 20
vii
- 25 particles exist. The effect of parameters such as the number of images, the
number of particles in the images, and noise level in the images on the estimated
CSD is investigated. The second application relates to classifying benign and malignant tumors to assist radiologists involved in the treatment of cancer patients. Our
proposed MOO methodology is used to segment the tumors (regions of interest) and
the results are compared with the other methods. With the help of feature extraction, a set of required features are extracted from the images. These features can
then be used by radiologists for classification purposes and subsequent treatment.
In addition to the two abovementioned process and medical applications, other illustrative examples are also included to illuminate the utility of the proposed MOO
based thresholding in aiding decision making for real-world applications.
viii
LIST OF TABLES
Table
Page
2.1
Different types of image operations . . . . . . . . . . . . . . . . . . .
7
2.2
Different types of neighborhood . . . . . . . . . . . . . . . . . . . . .
8
2.3
Developments in image analysis for application in crystallization . . .
21
2.4
Developments in image analysis for application in breast cancer detection
22
3.1
Misclassification rate for general images
. . . . . . . . . . . . . . . .
37
4.1
Misclassification rate for crystallization images . . . . . . . . . . . . .
49
4.2
Estimation accuracy for different sets of crystallization images . . . .
53
4.3
Statistical mean measures obtained for the different “experimental” runs
54
4.4
Statistical mean measures obtained for the different “experimental” runs
of 100 images . . . . . . . . . . . . . . . . . . . . . . . . . . . . . . .
56
4.5
Misclassification rate for breast ultrasound images . . . . . . . . . . .
58
4.6
Extracted features of breast cancer tumors . . . . . . . . . . . . . . .
60
ix
x
LIST OF FIGURES
Figure
Page
1.1
Steps in image analysis . . . . . . . . . . . . . . . . . . . . . . . .
3
2.1
Illustration of a digitized image . . . . . . . . . . . . . . . . . . .
6
2.2
Illustration of different types of image operations . . . . . . . . .
7
2.3
(a) 4-connected neighborhood and (b) 8-connected neighborhood .
8
2.4
Image histogram . . . . . . . . . . . . . . . . . . . . . . . . . . .
9
2.5
Effects of different noises on an image . . . . . . . . . . . . . . . .
11
2.6
Filtering technique . . . . . . . . . . . . . . . . . . . . . . . . . .
12
3.1
Steps involved in simulated annealing . . . . . . . . . . . . . . . .
31
3.2
Illustration of the L2 -norm based optimal compromise solution extraction from the Pareto front . . . . . . . . . . . . . . . . . . . .
33
3.3
Image - Example 1 . . . . . . . . . . . . . . . . . . . . . . . . . .
34
3.4
Pareto plot - Example 1 . . . . . . . . . . . . . . . . . . . . . . .
35
3.5
Example 1: (a) - Otsu method (b) - Minimum error method and (c)
- MOO based segmentation . . . . . . . . . . . . . . . . . . . . .
35
3.6
Image - Example 2 . . . . . . . . . . . . . . . . . . . . . . . . . .
36
3.7
Pareto plot - Example 2 . . . . . . . . . . . . . . . . . . . . . . .
37
3.8
Example 2: (a) - Otsu method (b) - Minimum error method and (c)
- MOO based segmentation . . . . . . . . . . . . . . . . . . . . .
38
4.1
Weak perspective projection . . . . . . . . . . . . . . . . . . . . .
41
4.2
(a) Artificial image (b) Real-world image . . . . . . . . . . . . . .
44
4.3
Pareto plot - Crystallization example 1 . . . . . . . . . . . . . . .
46
4.4
Crystallization example 1 (a) - Original image, (b), (c), (d) Image
after thresholding using Otsu method, Minimum error method, and
MOO based segmentation respectively . . . . . . . . . . . . . . .
47
4.5
Pareto plot - Crystallization example 2 . . . . . . . . . . . . . . .
48
4.6
Crystallization example 2 (a) - Original image, (b), (c), (d) Image
after thresholding using Otsu method, Minimum error method, and
MOO based segmentation respectively . . . . . . . . . . . . . . .
49
xi
Figure
Page
4.7
Minimum area enclosing rectangle . . . . . . . . . . . . . . . . . .
51
4.8
(a) Original image, (b) Segmented image, and (c) Final image . .
52
4.9
Estimated CSD compared with actual CSD (50 Images) . . . . . .
55
4.10 Estimated CSD compared with actual CSD (100 Images) . . . . .
55
4.11 Ultrasound image of breast tumor . . . . . . . . . . . . . . . . . .
57
4.12 Pareto plot - Breast image (ultrasound) . . . . . . . . . . . . . . .
58
4.13 (a) - Original image (b), (c), (d) Image after thresholding using
Otsu method, Minimum error method, and MOO based segmentation
respectively . . . . . . . . . . . . . . . . . . . . . . . . . . . . . .
59
xii
ABBREVIATIONS
CSD
Crystal size distribution
FBRM
Focus beam reflectance measurement
MRI
Magnetic resonance imaging
MOO
Multi-objective optimization
NSGA
Non-dominated sorting genetic algorithm
PVM
Particle vision and measurement
SA
Simulated annealing
SOO
Single objective optimization
xiii
xiv
NOMENCLATURE
a
Grey level range of the first Gaussian curve
b
Grey level range of the second Gaussian curve
fl
Focal length of the camera
fi (x)
ith objective function
f (l)
Estimated crystal size distribution
f (s)
Energy of the current state
f (s0 )
Energy of initial state
h(g)
Normalized distribution of the image histogram where g denotes the grey level
i
Grey level
j
Number of objectives
k
Boltzmann constant
l
Characteristic length of each particle in the given volume
n
Number of particles captured in the image
ni
Number of pixels at each grey level
pi
Normalized probability distribution of the image histogram
s
Current state
s0
Initial state
t
Temperature of the current state in simulated annealing algorithm
wi
Weight parameter
x
Solution vector
xi , y i
Coordinates on the image plane
F (t)
Total objective function
xv
GL
Grey level values of each pixel in an image
J(T )
Second objective function
L
Number of grey levels in the image
N
Total number of pixels
Pi (T )
Probability distribution of the ith Gaussian curve
V
Imaging volume captured by the camera
S
Search space
T
Optimal threshold
X, Y , Z
Physical coordinates
α
Cooling rate
δE
Change in energy
µi (T )
Mean of the ith Gaussian curve
µ(k)
First-order cumulative moments of the histogram up to k th
grey level
µT
Total mean grey level of the image
σ 2 B (k)
Inter-class variance (between class variance) - first objective
function
σ 2 i (T )
Variance of the ith Gaussian curve
ω(k)
Zeroth-order cumulative moments of the histogram up to
k th grey level
xvi
Chapter 1 Introduction
Chapter 1
INTRODUCTION
The proverb ‘A picture is worth a thousand words’ says it all. Perhaps a picture
is worth several thousand data samples for it can best reflect the actual state of
some processes. With the advent of modern technology, images can be analyzed
to achieve certain goals. The main purpose of image processing is to improve the
pictorial information and extract information suitable for computer analysis for
decision-making and strategic interventions. Image analysis plays a crucial role in
extracting meaningful and actionable information from process images. Human eye
and the brain together is the best example of an image analysis system. Computer
based image analysis can be used to replace human effort so as to make the image
analysis process much more fast, efficient and automatic. Various fields such as
biology, medicine, remote sensing, robotics and manufacturing benefit from image
analysis.
1.1
Motivation
Image analysis has many applications in the chemical, food and pharmaceutical
industries spanning areas such as quality control, process control, machine control and robot control. In the food industry, ensuring uniform shape, texture and
size of the final products is of paramount importance. Similarly in crystallization
processes, it is vital to obtain a desired Crystal Size Distribution (CSD) (Braatz
2002). CSD needs to be estimated at regular intervals for controlling the process
effectively. There are many offline technologies such as microscopy for estimating
CSD and therby assisting in process control. However, recently the use of in-line
1
1.2 Background
measurements such as Particle Vision and Measurement (PVM) are being explored
for estimating CSD (Zhou et al. 2009). PVM can be used to obtain images at any
point of time from which the CSD can be estimated. Therefore, image analysis can
play a major role in crystallization process control as well.
Medical image analysis involves the analysis of clinical images taken with a view
to detect and diagnose diseases associated with body organs or to study the normal
physiological processes. These analyses can be performed on images obtained from
different imaging technologies such as ultrasound, radiology, magnetic resonance
imaging (MRI), etc. Image analysis methodology plays a vital role in cancer diagnosis (Cheng et al. 2010), thereby allowing doctors to decide on the right treatment
for the patient. Breast cancer is one of the leading causes of death among women.
Generally, while diagnosing and classifying breast cancer images, there are a lot of
variables like tumor size, shape, homogeneity, etc. that are taken into account by
the physician. Computer based image analysis algorithms can be developed to assist
radiologists in classifying tumor images.
1.2
Background
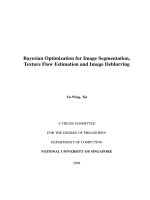
The major steps involved in image processing are shown in Fig. 1.1 (Jain 2001,
Gonzalez & Woods 2008, Dougherty 2009).
The purpose of each step is described briefly:
1. Image acquisition: to acquire a digital image.
2. Image pre-processing: to improve the image suitable for analysis.
3. Image segmentation: to partition an image into multiple regions and to extract
the region of interest from the remaining.
4. Feature extraction: to convert an input image to a set of features based on
the attributes of segmented image.
2
Chapter 1 Introduction
Fig. 1.1. Steps in image analysis
5. Pattern classification: to classify the given input image based on extracted
features.
Image pre-processing involves techniques such as noise reduction, contrast enhancement and image sharpening where both input and output are images. In image
segmentation, regions of interest are extracted from the image. Usually, in feature
extraction and pattern classification, the inputs are images and the outputs are data
(like features of segmented objects) obtained from the images. Different techniques
are used to perform each step in image analysis based on the intended application.
Hence, the technique selected at each step is very important to obtain the desired
result from the algorithm.
1.3
Objectives
The main objective of this work is to apply image analysis to solve problems that
are of interest to industry and medicine. The novelty in this thesis is that an MOO
based thresholding approach has been applied to problems such as segmentation of
3
1.4 Organization of the Thesis
crystals from process images and extraction of tumor portions from breast ultrasound images. This thesis shows that the proposed MOO based approach improves
the segmentation quality compared to those obtained using some available single
objectives.
The main objective will be accomplished through the following sub-objectives:
1. Developing a method which selects a suitable threshold for image segmentation
based on multi-objective optimization (MOO) and comparing its results with
a few common thresholding methods.
2. Designing an image analysis algorithm that can estimate CSD from PVM images and validating this algorithm using a library of artificial images generated
based on certain assumptions.
3. Designing an image analysis algorithm that can assist radiologists in classifying
breast ultrasound images into benign and malignant tumors.
1.4
Organization of the Thesis
The reminder of this thesis is organized into four chapters as follows:
• Chapter 2: Definitions of the terminologies and review of the techniques used
in this thesis are given.
• Chapter 3: Image segmentation based on multi-objective optimization is explained along with examples and the results are compared with those obtained
from other segmentation methods.
• Chapter 4: Image analysis techniques are applied to two case studies: crystallization process images and breast cancer ultrasound images.
• Chapter 5: The conclusions obtained from this thesis work along with recommendations for possible future research work are provided.
4
Chapter 2
DEFINITIONS AND DEVELOPMENTS IN IMAGE
ANALYSIS
Image analysis is a very important tool in today’s world. To understand the developments in image analysis, one must be familiar with some basic definitions related
to the image analysis domain.
An image is generally a visual representation of some object. An image can be a
photograph captured by an optical device such as a camera or a drawing rendered
manually from the information captured or imagined by the human brain through
the eye.
2.1
Digital Image
An image in the real world is defined as a function of two variables a(x, y) where
a is the amplitude assigned to any coordinate position (x, y) (Gonzalez & Woods
2008). A digital image described in a 2D discrete space is derived from a continuous
image a(x, y) through a sampling process that is referred to as digitization (Young
et al. 1995).
The digitization is done by dividing the continuous image into P rows and Q
columns. The intersection of a row and a column is referred to as a pixel. An
example of a digitized grey scale image is given in Fig. 2.1 1 . A continuous grey
scale image is taken and digitized by dividing into P = 9 rows and Q = 12 columns.
Each pixel is given an intensity value depending on the brightness at that particular
1
Image Courtesy : MATLAB
5
Chapter 2 Definitions and Developments in Image Analysis
Fig. 2.1. Illustration of a digitized image
point. Generally, a grey scale image has 8 bit color depth which indicates 28 = 256
colors. Hence, grey scale intensity value varies from 0 - 255. This process of assigning
intensity values to a pixel is referred to as quantization.
2.2
Image operations
Image operations are performed on an input digital image to result in an output
image based on the user’s requirement. Image operators are classified based on its
function/effect on the image.
2.2.1
Types of operations
Operations performed on digital images are classified into three categories based
on its processing characteristic (Young et al. 1995, Bebis 2004b).
6
2.2 Image operations
The different types of operators are described in Table 2.1 and illustrated in Fig.
2.2.
Table 2.1
Different types of image operations
Operation
Point operation
Local operation
Global operation
Description
The output value of the particular pixel is
dependent only on the input value at that
particular point.
The output value of the particular pixel is dependent only on the input value in the neighborhood at that particular point.
The output value of the particular pixel is
dependent on the entire image.
Fig. 2.2. Illustration of different types of image operations
2.2.2
Image neighborhood
While performing local operations, a neighborhood of connected pixels is taken
into consideration. Different types of connectivity are used in defining different types
7
Chapter 2 Definitions and Developments in Image Analysis
of neighborhood (Young et al. 1995). Since we are dealing only with rectangular
sampling (images are digitized by laying a rectangular grid over the continuous
image), only the related types of neighborhood are explained in Table 2.2.
Table 2.2
Different types of neighborhood
Neighborhood
Connectivity
Description
Von Neumann neighborhood
Moore neighborhood
4-connected
Pixels that touches the edges of
the pixel.
Pixels that touches the edges and
corners of the pixel
8-connected
The different types of neighborhood are also illustrated in Fig. 2.3.
Fig. 2.3. (a) 4-connected neighborhood and (b) 8-connected neighborhood
2.3
Image histogram
An image histogram is used to plot the frequency distribution of grey level intensities in an image (Gonzalez & Woods 2008). Fig. 2.4 shows the histogram of
the image given in Fig. 2.1. It provides a summary of the intensity level in the
image. Image histogram can be used to obtain the significant range of the grey level
8
2.4 Image analysis
intensities of the image. In Fig. 2.4, the height of the curve denotes the number of
pixels with the given grey level intensity.
Fig. 2.4. Image histogram
2.4
Image analysis
Next, the major steps involved in image analysis are explained along with the
techniques that are used in this work.
2.4.1
Image acquisition
Image acquisition is the process of acquiring a real world image and storing it in
a format (digital image) that can be processed by a computer algorithm (Gonzalez &
Woods 2008). During this acquisition process, a lot of noise may become embedded
in the image posing challenges for the image analysis algorithm.
9