Integration of silicon nanowires in MOS technology
Bạn đang xem bản rút gọn của tài liệu. Xem và tải ngay bản đầy đủ của tài liệu tại đây (1.85 MB, 152 trang )
Integration of Silicon nanowires
MOS technology
Julien POIZAT
2004
INTEGRATION OF SILICON NANOWIRES
IN MOS TECHNOLOGY
Julian POIZAT
DOUBLE DEGREE PROGRAM BETWEEN NATIONAL UNIVERSITY OF
SINGAPORE AND FRENCH ENGINEERING SCHOOL.
A THESIS SUBMITTED FOR THE DEGREE OF MASTER OF ENGINEERING
DEPARTMENT OF ELECTRICAL AND COMPUTER ENGINEERING
SILICON NANO DEVICE LABORATORY
NATIONAL UNIVERSITY OF SINGAPORE
2004
i
Integration of Silicon nanowires
MOS technology
Julien POIZAT
2004
Acknowledgement:
Cette année passée à la National University of Singapore aura particulièrement enrichi
mon cursus: elle m’aura permis, en effet, sur le plan technique, d’approfondir mes
connaissances par la spécialisation suivie en microélectronique et, sur le plan personnel,
de découvrir la culture asiatique.
En juillet dernier, j’ai été cordialement accueilli au laboratoire Silicone Nano Device
Laboratory dans le département électronique et computing Engineering de la National
University of Singapore afin d’effectuer, dans le cadre du programme d’échanges entre
l’ENST-Bretagne et la National University of Singapore, le Double Degree Program
exchange between French Grande Ecole et the Naional Univeristy of Singapore.
Je tiens tout d’abord à remercier mon maître de stage, D.Lee Sungjoo, qui m’a donné
l’opportunité d’aborder le passionnant sujet que sont les nanowires-FET et qui a su, tout
au long de l’année, me guider dans mon travail et me prodiguer ses conseils.
Je remercie aussi de leur concours les membres du département SNLL et les étudiants
que j’ai côtoyés cette année que ce soit au laboratoire, dans les amphithéâtres, ou, pour
certains, durant les séjours passés dans les pays limitrophes.
Je remercie enfin les professeurs qui ont permis d’élargir mes savoirs en
microélectronique.
Cette année a été pour moi une réelle chance et je remercie l’ENST et la NUS de m’avoir
fait accéder à ce programme d’échanges.
ii
Integration of Silicon nanowires
MOS technology
Julien POIZAT
2004
Un merci particulier à Laura qui m’a apporté son affection ces derniers mois et a eu la
gentillesse de corriger la rédaction de mon travail.
This year has been very interesting for my telecommunication engineering
background with a specialization in microelectronic and for discovering a new culture at
Singapore. I have been welcomed in the Silicon Nano Device Laboratory in the electrical
and computer engineering department of the National University of Singapore. I was
doing the double degree exchange program between French Grandes Ecoles and the
National University of Singapore.
First, I would like to thank my supervisor, D.Lee Sungjoo, who advised me
during this year and who gave me the opportunity to deal with an interesting topic:
Nanowires-FET. Eventually, I thank all teachers who taught me microelectronic during
this year.
So, I would like to thank the Silicon Nano Device Laboratory department, all the
teachers, staff and all the students with who I was in the lab, in Lecture Theater and for
some in trip.
This year has been for me a great opportunity and I thank the ENST-Bretagne and
the National University of Singapore to let me be involved in this exchange.
Julien Poizat
iii
Integration of Silicon nanowires
MOS technology
Julien POIZAT
2004
Table of contents:
I. Introduction: ........................................................................... 1
II. Death of CMOS Technology:................................................. 3
II.1. Miniaturization:................................................................................................... 3
II.2. New issues: ......................................................................................................... 4
II.2.1.
Short channel effect: ................................................................................... 4
II.2.2.
Quantum effects:......................................................................................... 7
II.3. Energy issue:....................................................................................................... 8
II.4. New devices ...................................................................................................... 12
II.4.1.
HEMT ....................................................................................................... 12
II.4.2.
SOI: ........................................................................................................... 12
II.4.3.
Multi-gates: ............................................................................................... 13
II.4.4.
Molecular electronic: ................................................................................ 13
II.5. Summary of this chapter ................................................................................... 14
III. Review of nanowires:............................................................ 15
III.1.
Template assisted synthesis: ......................................................................... 16
III.1.1. Pressure injection ...................................................................................... 17
III.1.2. Vapor deposition....................................................................................... 17
III.2.
Vapor Liquid Solid: ...................................................................................... 18
III.2.1. Catalyst: .................................................................................................... 19
III.2.2. Binary Phase diagram ............................................................................... 22
III.2.3. CVD .......................................................................................................... 23
III.2.3.1.
Mass Transport: ................................................................................ 24
III.2.3.2.
Thermal activation: ........................................................................... 25
III.2.3.3.
Impact of parameters on the growth: ................................................ 26
III.3.
Summary of this chapter: .............................................................................. 29
IV. Build a nanowires-FET: ....................................................... 30
IV.1.
Electrical results:........................................................................................... 31
IV.2.
MOSFET Behavior: ...................................................................................... 34
IV.3.
Nanowires-FET behavior:............................................................................. 38
IV.3.1. Reversing Source/Drain:........................................................................... 38
IV.3.2. Subthreshold behavior: ............................................................................. 39
IV.3.3. Experimental and Theoretical I-V curves:................................................ 40
IV.3.4. Analogy with some other devices:............................................................ 42
IV.4.
Interesting devices: ....................................................................................... 43
IV.4.1. Ge nanowires FET [33]:............................................................................ 44
IV.4.2. Silicon nanowires-FET [31]:..................................................................... 45
IV.5.
How to build a nanowires-FET:.................................................................... 47
IV.5.1. Preview of our future device:.................................................................... 47
IV.5.2. Vapor-Liquid-Solid:.................................................................................. 49
IV.5.2.1. Preparation of the substrate:.............................................................. 49
IV.5.2.2. Substrate preparation and CVD growth [46] .................................... 52
IV.5.2.3. Silicon Nanowires [47]: .................................................................... 53
IV.5.2.4. GE & Si nanowires [49]:................................................................... 53
IV.5.3. Eutectic point: ........................................................................................... 55
iv
Integration of Silicon nanowires
MOS technology
Julien POIZAT
2004
IV.5.4. Deposition:................................................................................................ 57
IV.5.4.1. Applying an electric field: ................................................................ 58
IV.5.4.2. Laminar flow:.................................................................................... 61
IV.5.4.3. Fluidic flow method:......................................................................... 62
IV.5.4.4. Langmuir-Blodgett............................................................................ 63
IV.5.4.5. New approach: .................................................................................. 69
IV.5.4.6. Nanomanipulator: ............................................................................. 70
IV.5.5. Process: ..................................................................................................... 71
IV.5.5.1. Reduction of the oxide shell: ............................................................ 74
IV.5.5.2. Passivation: ....................................................................................... 74
IV.6.
Summary of this chapter: .............................................................................. 75
V. Issues to overcome: ............................................................... 76
V.1. Physical issues: ................................................................................................. 76
V.1.1.
Gold tip: .................................................................................................... 76
V.1.2.
Resistivity: ................................................................................................ 77
V.1.3.
Interface defects:....................................................................................... 77
V.2. Characterization: ............................................................................................... 78
V.2.1.
Scanning Electron Microscopy:................................................................ 79
V.2.2.
Transmission Electron Microscopy .......................................................... 81
V.3. Modelisation: .................................................................................................... 83
V.3.1.
Contact: ..................................................................................................... 84
V.3.2.
Nanowires: ................................................................................................ 85
V.3.3.
Interface states: ......................................................................................... 91
V.3.4.
Diffusive reflection at interfaces:............................................................ 101
V.3.5.
Back gate effect: ..................................................................................... 102
V.3.5.1.
Flatband voltage:............................................................................. 102
V.3.5.2.
SIS structure:................................................................................... 105
V.3.5.3.
Different conductor areas of nanowire: .......................................... 107
V.3.5.4.
Calculus of V(L1), transition between accumulation and depletion:
108
V.3.5.5.
Accumulation region:...................................................................... 108
V.3.5.6.
Parallel resistance: .......................................................................... 117
V.3.5.7.
Depletion area: ................................................................................ 119
V.4. Conclusion: ................................................................................................. 125
Conclusion:................................................................................ 127
v
Integration of Silicon nanowires
MOS technology
Julien POIZAT
2004
Summary:
Since few years, nanowires are attractive for microelectronics to overcome the
limitations of the current technology based on the silicon bulk materials. Nanowires have
already been assembled in transistor which revealed pretty interesting electrical
properties almost equal to the state-of-the-art of MOS process without optimization. The
process to build a Nanowires-transistor was studied. Several points were highlighted: the
process of the growth, the mechanism of Nanowire-FET and the issues we will have to
overcome. Since the scale of the device is going near the atomic structure, some
theoretical issues have been studied to know if the electrical characteristics of silicon
nanowires follow the scale law. These studies have highlighted that these structures did
not obey the classical law of physics.
vi
Integration of Silicon nanowires
MOS technology
Julien POIZAT
2004
List of figures:
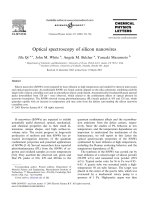
Figure II-1: 2003 ITRS-Gate length [2].............................................................................. 3
Figure II-2 : Illustration of the pinch-off phenomenon....................................................... 5
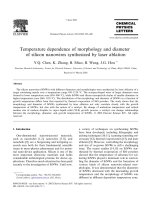
Figure II-3: Triode lamp (a), MOS transistor ((b) Lg=16 nm ST Microelectronics [4] ..... 6
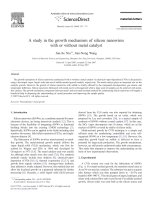
Figure II-4: cross section of MOS capacitor whose oxide thickness is 0.8 nm [5]. ........... 7
Figure II-5: HEMT SiGe/Si/SiGe ..................................................................................... 12
Figure II-6: Double gate scheme....................................................................................... 13
Figure III-1: Illustration of Vapor-Liquid-Solid nanowire growth mechanism including
three stages alloying, nucleation and axial growth [20]. .......................................... 19
Figure III-2: illustration of the flow inside a CVD ........................................................... 24
Figure III-3: illustration of a CVD machine ..................................................................... 26
Figure III-4: nanowires at different pressures................................................................... 27
Figure III-5: Scheme of nanowires according to Pressure and Temperature.................... 28
Figure IV-1: Subthreshold slope for new devices............................................................. 31
Figure IV-2: Characteristic of new devices. ..................................................................... 32
Figure IV-3: mobility of new devices............................................................................... 33
Figure IV-4: MOSFET behavior....................................................................................... 37
Figure IV-5: Scheme of a nanowires-FET........................................................................ 42
Figure IV-6: Ge nanowires-FET....................................................................................... 44
Figure IV-7: Silicon nanowires......................................................................................... 45
Figure IV-8: Scheme of our device................................................................................... 48
Figure IV-9: Cross section of our device.......................................................................... 48
Figure IV-10: Deposition of gold colloids........................................................................ 49
vii
Integration of Silicon nanowires
MOS technology
Julien POIZAT
2004
Figure IV-11: diagram of the different way to get align nanowires. ................................ 58
Figure IV-12: illustration of the deposition process [36].................................................. 63
Figure IV-13: Illustration of the PDMS process [53]. ...................................................... 63
Figure IV-14: Langmuir Blodgett tool.............................................................................. 65
Figure IV-15: Isotherm Scheme [57]................................................................................ 66
Figure IV-16: orientation of the molecules in different phase [58]. ................................. 66
Figure IV-17: Langmuir blodgett layer for hydrophilic material. .................................... 67
Figure IV-18: Langmuir Blodgett layer for hydrophobic material................................... 68
Figure IV-19: Wilhelmy plate partially immersed in a water surface [54]....................... 68
Figure IV-20: Illustration of the new deposition process. ................................................ 70
Figure V-1: SEM images of the top surfaces of porous anodic alumina templates
anodized with an average pore diameter of 44nm [73]............................................. 79
Figure V-2: SEM images of ZnO nanowire arrays grown on a sapphire substrate [60]. . 80
Figure V-3: SEM image of GaN nanowires in a mat arrangement synthesized by laserassisted catalytic growth. [61]................................................................................... 81
Figure V-4: TEM morphologies of four special forms of Si nanowires synthesized by the
laser ablation of a Si powder target. [62].................................................................. 81
Figure V-5: Lattice resolved high resolution TEM image of one GaN nanowire (left)
showing that (100) lattice planes are visible perpendicular to the wire axis. A latticeresolved TEM image (lower right) highlights the continuity of the lattice up to the
nanowire edge, where a thin native oxide layer is found. The directions of various
crystallographic planes are indicated in the lower right figure [61]. ........................ 82
Figure V-6: A mass-thickness contrast TEM image of a Ge nanowire [63]. ................... 83
Figure V-7: Metal Nanowire contact and Energy band diagram...................................... 84
Figure V-8: Scheme of a nanowire. .................................................................................. 85
Figure V-9: Mobility with the density of states at T=300K for a silicon substrate [40]. . 86
viii
Integration of Silicon nanowires
MOS technology
Julien POIZAT
2004
Figure V-10: Drift velocity ( cm.s −1 ). Doping are Nd = 1016 cm −3 (upper curve),
Nd = 2.1017 cm −3 (middle curve) and Nd = 1019 cm −3 (lower curve). ...................... 87
Figure V-11: mobility ( cm 2 .V −1 .s −1 ) related to electric field. Doping are Nd = 1016 cm −3
(upper curve), Nd = 2.1017 cm −3 (middle curve) and Nd = 1019 cm −3 (lower curve).87
Figure V-12: Density of current ( A.cm −2 ) versus Vds ( Nd = 2.1017 cm −3 lower,
Nd = 1019 cm −3 upper). .............................................................................................. 88
Figure V-13: current (A) versus Vds (V) ( Nd = 2.1017 cm −3 lower, Nd = 1019 cm −3 upper).
................................................................................................................................... 89
Figure V-14: Log Density of current ( A.cm −2 ) versus Vds (V) ( Nd = 2.1017 cm −3 lower,
Nd = 1019 cm −3 upper). .............................................................................................. 89
Figure V-15: Log current (A) versus Vds ( Nd = 2.1017 cm −3 lower, Nd = 1019 cm −3 upper).
................................................................................................................................... 89
Figure V-16: Ids(A)-Vds(V) for radius r=10nm and Nd = 1019 cm −3 . Length are from the
upper are L=500nm, L=1um and L=5um. ................................................................ 90
Figure V-17: Ids(A)-Vds(V) for L=1um and with Nd = 1019 cm −3 . The radius are from
the bottom, 10, 20, 40, 50 nm. .................................................................................. 91
Figure V-18: Cross section of a nanowire with the depletion region ............................... 92
Figure V-19: evolution of the resistance (normalized to resistance for d=0) with the
radius for different values of d (d=1, 2, 3, 4, 8 from the bottom)............................. 93
Figure V-20: evolution of the resistance (normalized to resistance with d=0) with the
thickness of the depletion for a radius r=10nm......................................................... 94
Figure V-21: Energy band diagram of silicon interface. .................................................. 95
Figure V-22: states repartition at the Si/SiO2 interface [64], distribution of interface
states Dit(E) for Si(111) and Si(100) after RCA and Hot Water [65] ...................... 96
Figure V-23: Surface potential (V) with Density of interface states ( cm −2 ).................... 98
Figure V-24: Probability of interface states occupancy with the density of states ( cm −2 ).
................................................................................................................................... 98
Figure V-25: Depletion width (m) with density of interfaces states................................. 99
ix
Integration of Silicon nanowires
MOS technology
Julien POIZAT
2004
Figure V-26: Depletion width (m) with ∆ t ...................................................................... 99
Figure V-27: Scheme of the mean free path in a nanowire. ........................................... 101
Figure V-28: diffusive reflection effect. ......................................................................... 102
Figure V-29: Cross section of the SIS structure. ............................................................ 103
Figure V-30: occupied interface states with the density of interface states.................... 104
Figure V-31: Flatband voltage with the density of interface states Nss* ( cm −2 ) for
different dopings Nd = 2.1017 cm −3 and Nd = 1019 cm −3 . ...................................... 105
Figure V-32: Energy band diagram after Vfb................................................................. 106
Figure V-33: Charge space density in a p-type semiconductor with Na = 4.1015 cm −3 [72].
................................................................................................................................. 106
Figure V-34: cross section with the different areas of the wire...................................... 107
Figure V-35: Energy band diagram for V(x)
and r=10nm. The two curves are for two dopings: Nd = 2.1017 cm −3 (upper curve)
and Nd = 1019 cm −3 . ................................................................................................ 109
Figure V-37: Ids(A)-Vds(V) in accumulation with saturation with the same
characteristics as the previous curve....................................................................... 110
Figure V-38: Iacc(A), accumulation current with Vds for different doping,
Nss = 1012 cm −2 and Nss*=f(Nss,Nd) ...................................................................... 111
Figure V-39: Iacc(A) accumulation current with Vds for Nd= 2.1017 cm −3 and Vbg=15, 25,
35 and 45V (from the bottom). ............................................................................... 112
Figure V-40: Saturation effect related to channel pinch for Nd = 2.10 7 cm −3 and Vbg=15,
25V (from bottom).................................................................................................. 112
Figure V-41: Both saturation effect of mobility and channel pinch for Nd = 2.10 7 cm −3
and Vbg=15, 25V.................................................................................................... 113
Figure V-42: Both saturation effect of mobility and channel pinch for Vbg=30V and
Nd= 1019 cm −3 . ......................................................................................................... 114
x
Integration of Silicon nanowires
MOS technology
Julien POIZAT
2004
Figure V-43: Iacc(A)-Vbg(V) in log scale for Nd = 2.10 7 cm −3 and Vbf~10V. ........... 114
Figure V-44: Iacc(A)-Vbg(V) for Nd = 2.10 7 cm −3 and Vds= 0.1, 1, 5V. .................... 115
Figure V-45: Iacc(A)-Vbg(V) in log scale for Nd = 2.10 7 cm −3 and Vbf~22V. ........... 115
Figure V-46: Iacc-Vbg for Nd = 1019 cm −3 and Vds=0.1, 1, 5V. ................................... 116
Figure V-47: Debye Length with Nd .............................................................................. 117
Figure V-48: I-Vds of parallel current to accumulation layer in case of Nd = 1019 cm −3 for
d=0, 3, 6, 9nm from the bottom. ............................................................................. 119
Figure V-49: evolution of the depletion width with Vbg (V) for Nd = 1019 cm −3 (lower
curve) and for Nd = 2.10 7 cm −3 . Vds=0................................................................. 122
Figure V-50: Maximum depletion width with the doping Nd( cm −3 )............................. 122
Figure V-51: Evolution of the depletion width (cm) with the surface potential for
Nd = 1019 cm −3 (lower curve) and for Nd = 2.10 7 cm −3 . ........................................ 123
Figure V-52: Cross section of a nanowire with depleted area. ....................................... 123
Figure V-53: Ids(A)-Vds(V) in depletion area for Vbg=20V, 0,-20V and Nd = 1019 cm −3
................................................................................................................................. 124
Figure V-54: same simulation with the mobility saturation. .......................................... 125
xi
Integration of Silicon nanowires
MOS technology
Julien POIZAT
2004
List of tables:
Table III-1: Catalyst materials. ......................................................................................... 22
Table IV-1: Electrical data of Ge-Nanowires FET. .......................................................... 44
Table IV-2: Electrical data of Si-nanowires FET. ............................................................ 45
Table IV-3: Electrical data, comparison. .......................................................................... 46
Table IV-4: Van Der Waals interaction. ........................................................................... 60
xii
Integration of Silicon nanowires
MOS technology
Julien POIZAT
2004
Abbreviations and constant
Fundamental constants :
Elementary electron charge e = 1, 602189.10−19 C
kB = 1.38066.10−23 J/K
Boltzmann constant
h = 6.62618.10−34 Js
Planck constant
m¯e = 9.10953.10−31 kg
Electron weight
Velocity
c = 2.997925.108 m/s
ε s 0 = 8.854.10−12 F/m
Dielectric permitivity
Magnetic permeability
µ0 = 4_.10−7 H/m
Elementary charge
q=1.60218 . 10-19 C
Abbreviations :
A*
Richardson constant
Cox equivalent capacity at the gate oxide
D
diffusion coefficient
Dox thickness of the buried oxide
Ec
value of the conduction band
Ev
value of the valence band
Ef
Fermi level
eox
thickness of oxide layer
G∞
energy of volume per atom of the bulk material in a given phase
G
energy of volume per atom of the particle in a given phase
Hm molar enthalpy of fusion
j ds
density of the current in the nanowire
L
gate length of the gate
Ld
Debye length
m*
Effective mass
Nc
the equivalent density of states in the conduction band
Nd
concentration
Re
Reynolds number
Vsat saturation velocity
σ
conductivity
l
mean free path
γ
surface tension of the liquid
θ
contact angle between the liquid and the template
σ LV liquid-vapor interface free energy,
molar volume of the liquid,
VL
σ
vapor phase supersaturation,
R
gas constant
T
temperature.
xiii
Integration of Silicon nanowires
MOS technology
ρ
ρ Si
η
u
µi
µp
µn
Φs
εr
Ψs1
Ψs 2
Julien POIZAT
2004
gas density
resistivity of Silicon
gas viscosity
gas velocity
Fermi energy
hole mobility
electron mobility
surface potential
relative permittivity of Silicon
tsurface potential of back gate
surface potential of wire
xiv
Integration of Silicon nanowires
MOS technology
I.
Julien POIZAT
2004
Introduction:
In 50 years, from ENIAC to microprocessor, an elementary operation is done one
million times faster, requires 100000 times less power, with a price and a weight of
machine divided by 10000. Compared to the other areas, the progress of microelectronics
is tremendous. Moreover, whereas the other area aims seem to be limited to mere
improvement of the current technology, the edge of microelectronics improvement seems
to be limited only by our imagination.
Today, based on the silicon and with the state-of-the-art MOSFET (Metal-OxideSemiconductor Field Effect Transistor) combined with the CMOS (Complementary
Metal-Oxide-Semiconductor) technology, microelectronic has become an indispensable
actor in the worldwide economy. During 20 years, efforts have been done to improve the
performance and the integration of this elemental device such as MOS-FET.
Still, after two decades of miniaturization, industry has to overcome other hurdles that are
not only due to their realization but also some theoretical issues raised and the quantum
phenomena became important.
As the integration of electronics on semiconductor, which allowed to replace the
vacuum tube, we may see a mutation of current devices. Thus, it may require a
technological breakthrough to go on the improvement. Especially, using a different
approach to build MOS device and using the quantum effects may be a solution for the
future of nano-electronics.
Among the new devices that have come up over the past year, the use of
nanowires as channel appears to be a promising approach. These devices may take
advantage of the confinement of the electrons to get improved electrical characteristic. At
1
Integration of Silicon nanowires
MOS technology
Julien POIZAT
2004
the age of all in silicon, this device may be all the more interesting since they will be
compatible with the current process in industry. Thus, building nanowire-FET based on
silicon may open door to hybrid technological devices combining the CMOS technology
and the advantage of the confinement of electrons in nanowires.
Many nanowires-FETs have already been built and have already proved their
potential. This study is composed of:
The first part will highlight the motivation of this work. Thus, we will present the
different hurdles that the current CMOS technology has to overcome.
Then, we will survey the different nanowires-FET already built and explain their
working principle.
We will describe the process required to build a nanowire-FET and explain the
growth of nanowires.
Then, we will describe the issues we will have to overcome during the process
and will perform a theoretical study of the effect of interface states on nanowires.
2
Integration of Silicon nanowires
MOS technology
II.
Julien POIZAT
2004
Death of CMOS Technology:
II.1. Miniaturization:
Progress of micro-electronics, which started half a century ago, has shown the
benefit of miniaturization: more transistors, higher frequencies, more reliable and cheaper.
The Moore Law described the miniaturization phenomenon in 1965: number of
transistors per centimeter square doubled every two years [1]. This law has become the
rule of micro-electronics industry. As a result, the companies now produce circuits at
nanometer size. The semi-conductor Industry Association draws lines that big companies
have to follow to improve their production rate. The International Technology Roadmap
for Semiconductors [2] is a sum-up of this work. Thus, Gate length is expected to be 10
nm by 2016 (fig II-1).
Figure II-1: 2003 ITRS-Gate length [2]
3
Integration of Silicon nanowires
MOS technology
Julien POIZAT
2004
Looking at the form of equation of MOS device performance, the gate length
appears to be an important parameter to increase the performance of devices. By
decreasing the gate length, the drive current will be increased. However, in the next
section, we are going to see that this reduction will unveil some technological as well as
theoretical issues.
II.2. New issues:
II.2.1. Short channel effect:
Up to now, semiconductor industry efforts are focused to decrease the transistor
gate length in order to improve the electrical performance of devices, and to increase the
integration density. This is what we can observe from the evolution of DRAM (dynamic
random access memory). However, this gate length decrease is performed by decreasing
the others parameters of the devices. Indeed, if the gate length decrease will allow us to
improve the drive current in the on state (Ion), it must not increase the off current or
decrease the drain conductance in saturation regime. These effects due to the decrease of
the gate length or others parameters are called Short Channel Effects and cause a reduced
control of channel conductivity by the gate voltage.
Indeed, by decreasing the gate length, the drain and source region come closer
and make the associated space charge regions closer. When Drain voltage becomes
higher, the space charge region of Drain spreads and can join the space charge region of
Source. Consequently, the potential barrier at the edge of source and substrate decreases
and allows the majority carriers from source to diffuse into the substrate (figure II.2).
Diffusion current is raised as soon as these carriers flow towards the drain region through
4
Integration of Silicon nanowires
MOS technology
Julien POIZAT
2004
the space charge region of drain-substrate: this is the punch-through phenomenon. This
overlapping of these both space charge regions lowers the barrier potential, thus
disturbing the control through the Gate voltage of fixed charge in the depletion region
under the gate. This lack of control in Off-state will increase the drain conductance in
saturation region and decrease absolute value of threshold voltage.
Decrease of the
potential barrier
Figure II-2 : Illustration of the pinch-off phenomenon
To sum-up, this short channel effect tends to make the gate control difficult with
an increase of Off-current and the conductance in saturation regime, and tends to create a
dependence of threshold voltage on Vds. One solution to improve the control of the gate
is to reduce the thickness of the dielectric layer to increase the equivalent capacity.
Nowadays, industry tries to keep a ratio Lg/eox (oxide thickness) between 40 and 50 in
MOS circuits [3]. However, the reduction of the oxide thickness will decrease the
electrical-breakdown voltage of this layer.
5
Integration of Silicon nanowires
MOS technology
Julien POIZAT
2004
Figure II-3: Triode lamp (a), MOS transistor (b) (Lg=16 nm ST Microelectronics) [4]
The oxide thickness is not the only parameter we can modify to reduce short
channel effects. To increase the substrate doping is a good way to reduce the spreading of
the space charge region. However, this solution will decrease the mobility of carriers
through the channel, and strongly affect the threshold voltage.
The junction depth of source/drain region can be reduced too. Still, this decrease
induces a decrease of the surface perpendicular to the carrier flow; the resistance of this
source/drain region tends to increase.
The terrific reduction of dimensions in MOS devices pointed out the evolution of
micro-electronics. In half century, the technology has evolved from ENIAC dealing with
5000 additions per second to Pentium 4 dealing with 5000 millions of instructions per
second (fig II.3). In the mean time, from the macroscopic triode, we went to MOS
transistor in nanometer scale. However, this nano-scale evolution raises new issues.
In addition to the lithography issues we have to overcome before an industrial
way, these nanoMOS raise quantum issues that were negligible up to now.
6
Integration of Silicon nanowires
MOS technology
Julien POIZAT
2004
II.2.2. Quantum effects:
With the reduction of the gate length, the oxide thickness is decreased to improve
the control of conduction channel. Thus, for MOSFET with a gate length of 30 nm, the
oxide thickness is decreased to 0.8 nm [5].
PolySi
Silicon
Figure II-4: cross section of MOS capacitor whose oxide thickness is 0.8 nm [5].
At this thickness, corresponding to a few atomic layers, the uniformity of the
oxide thickness across the channel is difficult to achieve since it requires a control to the
level of an atomic layer. The variation in the thickness of this oxide layer can lead to
some weakness that reduces the maximum electric field that the oxide can endure. This
lowers the integrity of oxide in high field. This effect can get worse due to the penetration
of dopants coming from p+ polysilicon gate. With thickness below 2 nm, oxide becomes
sufficiently low to allow the carriers to cross the oxide by tunneling effect. This
phenomenon creates a gate tunneling current that is even larger since the oxide thickness
is decreased. These new quantum effects modify the electrical characteristics of MOS
device. Particularly, the gate tunneling effect causes an increase of Off-state current and
consequently, of dissipated power. It also disturbs the On-state current since the carriers
7
Integration of Silicon nanowires
MOS technology
Julien POIZAT
2004
in the channel can escape from transistor through the oxide. However, this issue is not so
critical in the current device. But, as current is exponentially dependent on the oxide
thickness, the gate tunneling current is one of the major drawback in the next years.
Among the solution, using high-k dielectric may overcome this issue; these new
dielectrics allow us to keep a good control of the channel for layer thicker than those used
with Silicon oxide. Still, these new dielectrics have to face the same issue the industries
have met during 35 years: difficulty to get a good insulator/Si interface [6].
Another problem that designers of nano-MOS have to overcome is the different
doping required to counter the short channel effect. On one hand, the realization of
complex doping profile in smaller and smaller devices is technologically difficult,
especially if we want to avoid characteristics dispersion from wafer to wafer. On the
other hand, the meaning of doping for such small dimension is under discussion. Indeed,
for a substrate doped at 1018 atoms/ cm 3 , a channel 20*20*20 nm 3 will have only 8
impurity atoms. In that case, continuous and homogeneous doping seems to be difficult to
realize. So, the discrete characteristic of impurities should be taken into account [7].
II.3. Energy issue:
One of the recurrent problems in CMOS devices nowadays is the dissipated
power. This power can be divided into three different parts:
One from Off current; short channel effect and quantum phenomena make
it worse.
One from the short-circuit current. In theory, CMOS technology avoids
the simultaneous conduction of N & P type to prevent from being short-
8
Integration of Silicon nanowires
MOS technology
Julien POIZAT
2004
circuited. However, with the increasing frequency of signal, time during
which the P & N devices are in conduction simultaneously is not any more
negligible compared with the commutation time.
Eventually, the most part of the dissipated power comes from the energy
required to charge and discharge the equivalent capacity.
Now, we will try to determine a simple equation for this dissipated power related
to the characteristics of MOS devices [8]. The power dissipated through a MOS in
charge/discharge capacitors C:
Pdyn = CVdd2 f (II-1)
So, for Np doors, the dissipated power is:
Pdyn = N p CVdd2 f (II-2)
As we can notice through the above equation, to reach higher frequency will increase as
well the dissipated power. So, in the MOS technology, to decrease the power, the Vdd
should be decreased. However, this voltage cannot be decreased too much in order to
differentiate the different signals compared to noise in circuit. This issue may become, in
the future, a major problem and may be even more difficult to overcome than those
related to miniaturization.
Now, to know if the current technology can be efficient to decrease this consumption,
take into account a NAND and try to determine the minimum energy required to work
this gate. The NAND can be seen as two bits in entry to come up with an out-bit. This
process can be expressed thermodynamically by the first thermo dynamical identity [9]:
∆U = ∆F + T∆S (II-3)
9
Integration of Silicon nanowires
MOS technology
Julien POIZAT
2004
Where ∆ F represents the energy variation, that is to say the part of the total energy that
can be kept reversibly, and ∆ S is the entropy variation related to the energy T ∆ S lost by
the system. In an ideal system, the consumption of NAND will be: T∆S .
As there are two final states for four initial states, the global loss of entropy:
∆S = kb ln(2) − kb ln(4) = −kb ln(2)
(II-4)
Consequently, the minimum energy required is k bT ln(2) within one cycle to compensate
the loss of information (kb is the Boltzman constant).
Thus if we take a Pentium 4, which consumes at rough estimate 100W in one
million logic cells at 1 Ghz , we can evaluate the one cell consumption is about 10 8 kT .
How to reduce this energy?
To better understand this, the power equation can be deduced. To get it, the
equation is based on the following expression P = Rc I 2 where I is the current flowing
between source and drain and Rc = Lg (σS ) is the channel resistance with length Lg,
surface S and conductivity σ . The conductivity can be expressed as σ = enµ n . The
mobility µ n quantifies the ease of electron to move in presence of electric field. If we
r
divide the velocity of electron into a drift v d part related to the global movement due to
r
electric field and into a part vcol related to the movement of electron under the thermal
r
r
r2
2 can
energy or collisions, we can write that v d = − µ n E whereas kinetic energy mvcol
be evaluated with the thermal energy 3kT / 2 . Moreover, mobility is related to average
time τ col = l col vcol (lcol is the mean free path) between two successive collisions
through µ n = eτ col m . Thus we can deduce the expression Rc:
10
Integration of Silicon nanowires
MOS technology
Rc =
Lg
σS
=
Julien POIZAT
L2g
Neµn
=
L2g m
Ne 2τ col
=
2004
L2gτ col 3k bT
2
e 2 Nl col
( II-5)
r
r
The current I in the transistor is obtained from the current density j = −env d in the
channel so that by replacing n by N /( SL g ) and by introducing the required time ∆t for
an electron to cross the channel with a length L g , we got:
I = − nevS =
Ne
Ne
(II-6)
vd =
∆t
Lg
So, we can write the following expression of the dissipated power:
Lg
P = Rc I = N
l col
2
2
τ col
Pcol (II-7)
∆t
where Pcol = 3kT / τ col .
Through the above equation, we can deduce different way to decrease the consumption of
devices used nowadays in industry:
To increase ∆t may be a first solution, which comes to decrease the
frequency.
Another way is to decrease the gate length so that it becomes smaller than
the mean free path or in the same way, to improve the mobility of carriers
and thus increase the mean free path.
Eventually, another way is to reduce the number of carriers N.
So, all these issues, either technological or theoretical, drive industry to create
new devices to modify one of the above parameters. Moreover, industry tries to take
benefits of these quantum phenomena, parasitic up to now, which appears in nanometer
11