Hiệu quả biện pháp kiểm soát véc tơ sốt xuất huyết dengue dựa vào cộng đồng tại huyện cái bè tỉnh tiền giang, 2012 2013 (TT)
Bạn đang xem bản rút gọn của tài liệu. Xem và tải ngay bản đầy đủ của tài liệu tại đây (309.1 KB, 27 trang )
i
MINISTRY OF TRAINING AND EDUCATION
MINISTRY OF HEALTH
NATIONAL INSTITUTE OF HYGIENE AND EPIDEMIOLOGY
----------*----------
NGUYỄN LÂM
THE EFFECTIVENESS OF COMMUNITY – BASED METHOD IN
DENGUE VECTOR CONTROL AT CAI BE DISTRICT, TIEN
GIANG PROVINCE, 2012-2013
Major: Public health
No: 62720301
SUMMARY OF PHD THESIS IN PUBLIC HEALTH
Hanoi – 2015
ii
STUDY WAS COMPLETED AT THE NATIONAL
INSTITUTE OF HYGIENE AND EPIDEMIOLOGY
The scientific guidace:
1. Prof. Dr. Tran Ngoc Huu
2. Prof. Dr Nguyen Anh Dung
Reviewer 1: ……………………………………….
Reviewer 2: ……………………………………….
Reviewer 3: ……………………………………….
The thesis will be defended at the state thesis Council meeting at
National Institute of Hygiene and Epidemiology,
at..hour...,day...month...year 2015
Thesis can be fond at:
1. National Library
2. Library of National Institute of Hygiene and Epidemiology
1
INTRODUCTION
Dengue hemorrhagic fever (DHF) is an acute mosquito-borne viral
infectious disease and can cause of major outbreak. Aedes aegypti is the
main vector transmitted disease. Dengue is found in tropical and subtropical climates worldwide. The disease is now endemic in more
than 100 countries in South-East Asia and Western Pacific regions.
Appropximately 40% of the world’s population live in areas where there
is a risk of dengue transmission. Each year, there are about 50 million
dengue infections and around 500,000 individuals are hospitalized with
DHF. In Vietnam, DHF is local endemic and appears in rainy season.
Recently, each year, there are several hundred thousand infected cases and
about hundred of those affected die.
As of now, there is unknown specific anti-viral medicine for
dengue fever and no vaccine for dengue. Finding effective vector control
methods in order to restraint DHF has been challenging not only for
Vietnam but also for the world. While waiting for the development of a
vacine, the only method to control or prevent the transmission dengue
virus is to combat vector mosquitoes through the involment of
community.
Tien Giang has the highest mortality rate of DHF in the Southern
area. In last few years, the disease prevention has been supported by the
local government and organisations but why it hasn’t brought the high
effect? Have vector control guidances met the actual local condition?
How and what methods of the health education and communication for
dengue vector prevention to encourage the community participation in an
active and longterm effectiveness?
While waiting for the effective solution of vacine as well as other
biological methods in research and trial period and to solve the current
urge problem of DHF prevetion in Tien Giang, we have conducted the
research: “The effectiveness of community – based method in dengue
vector control in Cai Be district, Tien Giang province, 2012-2013”.
2
There are two objectives of this research:
1. The description of the knowledge, the attitude and the practice of
the local people in the implementation of DHF control and
prevention solutions and control the vector index in Cai Be district,
Tien Giang province, 2012-2013.
2. The assessment of the effectiveness of community – based vector
control method in Cai Be district, Tien Giang province, 2012-2013.
Scientific contributions and practical value:
- The intervention program is totally based on community,
community work and responsibility, community selected vector control
methods, participation in planning and implementing. The vector
control activity covered all households in the intervention areas.
Simple and eassy applying vector control methods were used
appropriately and effective in reducing the vector index in the
community.
- Saving the cost of the vector control at the community was by
using the vector control force as the leader of the household and
students with the support and involment of the hightly respected public
figures (self-management group and teachers). Each member above
was considered as a collaborator of the national program and they
controlled vector at their own households.
- While the current communication measurement in the DHF/DF
vector control have to face with many challenges in applying to each
local area, the community-based vector control in this research
matched the demand and the current situation.
This research succeeded in mobilizing the community in
practising the vector control, providing the scientific evidence in the
effectiveness of the vector control. This research also worked as the base
to implement the intervention at the community. The result of this
research can be used in the evaluation research of the effectively
implementing intervention in the DHF/DF prevention as well as in
providing the baseline data for future studies.
3
THESIS STRUCTURE
The thesis has 126 pages, 51 tables, 17 pictures and 11 appendixes.
In which: The introduction and objective parts take 3 pages, the
overview takes 33 pages, the method part takes 19 pages, the results part
takes 34 pages, the discussion part takes 35 pages, the conclusion part
takes 1 page and the recommendation part takes 1 page.
The thesis has 146 references that are included 103 Vietnamese and
43 English references.
Chapter 1
OVERVIEW
1.1 Definition of Dengue hemorrhagic fever/ Dengue fever
Dengue Hemoharrgic Fever (DHF) or Dengue Fever (DF) is an
acute mosquito-borne disease caused by the dengue virus and can cause
of major outbreak. Dengue virus belongs to the family Flaviviridae;
genus Flavivirus and four serotypes of the virus have been found. Aedes
aegypti is a primarily vector transmitted disease.
1.2 Current situation of DHF/DF
1.2.1 Current global situtation of DHF/DF
Dengue pandemic has occured in the sub-tropical and temperate
climate areas, South-East Asia and Western Pacific regions are
the most seriously affected. According to the strategic plan of WHO from
2008 – 2015, there are about 1.8 billion (>70%) of the population at risk
for dengue in South-East Asia region.
1.2.2 Current situation of DHF/DF in Vietnam
DHF/DF is a local endemic disease in Vietnam, one of 10 declared
infectious diseases and has the highest infection and mortality rate. The
populations at risk of acquiring dengue viral infections in dengue
circulation regions is around 70 million.
1.2.3 Current situation of DHF/DF in Southern Vietnam
The first recorded case was in the Melkong Delta, then spreaded
into many epidemics with the cyle of 3-5 years. In 1998, there were
123.997 cases and 347 cases of death. In 2005, the dengue-infected case
was at No.2 after the diarrhea in the list of 24 infectious diseases. From
2006-2012, the incidence of infected cases was higher than the average of
the cases from 2000-2005. In 2007, the infected rate/100.000 population
was highest from 1999 but was less than 1998. In 2008, the rate of
mortality/infection increased again (0.109%). The outbreak in 2010 had
4
higher cases than in 2009 and the infection rate per 100.000 population
increased 13.9% compared with the average of 2003-2007. From 20112013, the percentage of infection and death case decreased. The rate of
infected cases was 72 per 100,000 population in 2014 and decreased in
comparison with the rate of 2013 and the average rate of 2006-2010.
Dengue virus monitoring was carried out regularly and has found
four co-circulating serotypes. DEN-1 virus was predominant than other
serotypes during 8 years from 2006 – 2014.
The number of insect in 2010 was higher than 2009 and the
average of 2004-2008. The mosquito density in 2012 was in the range of
0.3-0.7 (mosquito/household) which was higher than 2011 and less than
the average of 2007-2011. In 2013, the BI index was in the range of 28-50
and less than at the same time period of 2012 and remained unchanged in
2014.
1.2.4 The situation of DHF/DF in Tien Giang
Tien Giang continuously had the high rate of the dengue virus
infection with the circulation of 4 serotypes and the vector index changed
with none specific regulation. The BI index and the average of the Aedes
condensity index were always at the high level among other Southern
regions. Currently, there has very small amount of budget or none for the
cost of the DHF/DF disease prevention activity which has undertaken by
local authorities, so the local authority also determined local people as a
main force in the vector control activity. However, the communication
activity has limited, failed to meet the requirement in communication for
changing behavior and failed to make the habit of the local people in the
vector control practice through each household.
1.3 The dengue vector physiology and ecology:
1.3.1 Aedes albopictus mosquitoes
The adult Aedes albopictus has a fairy small size (about 3/16 inch)
and almost similar with Aedes aegypti except for a white line along the
back. The physilogical ecology of Aedes albopictus is the same as Aedes
albopictus.
1.3.2 Aedes aegypti mosquitoes
Aedes aegypti has an average size with the alternative black body
with many white flakes. Aedes aegypti stays horizontally. The female
mosquito sucks blood and lays eggs with the active time during the
daytime and at the peak in the early morning and late afternoon. The
5
average life expectancy of the female mosquito is 30 days. The female
fertilizes 4 times in a lifetime and each time with 58-78 eggs. The life
cycle has 4 periods and during 10-15 days.
Aedes aegypti has distributed in tropical and temperate climate
areas over all continents.
1.4 The dengue vector surveillance and investigation
1.4.1 Monitoring adult mosquitoes
The density index of Aedes mosquitoes is the average of the Aedes
female number in an investigated household
The index of the house with mosquitoes is a percentage of houses
positive for adult female mosquitoes.
1.4.2 Monitoring Aedes larva: There are 4 frequently used index
The house index (HI): percentage of houses positive for Aedes
larvae.
The container index (CI): percentage of all containers with water
that are Aede larva/pupa positive.
Breteau Index (BI): number of Aedes positive containers per 100
houses
The larval density : The average number of Aedes larva in an
investigated household.
1.5 Method and model of vector prevention
The research of antiviral vaccine against Dengue virus has been
developing and going into clinical trials.
In Vietnam, the DHF/DF preventive strategy is included the pilot
colaborator model in 10% of the commune and province; the activity of
the colaborator has reduced the vector index but not reached the
requirement. The research of controling epidemic result showed that the
effectiveness in limiting the spread of diseases of epidemic potential.
Some reseachers have found several intergrated models in vector control
by using biological agents as Mesocyclops or larvivorous fishes.
1.6 Some terms in the research
The water container: All containers such as large or small, which
contain water even the miscellaneous stuffs and stagnent wastewater
container.
Miscellaneous stuffs: The vase, waster bowl against ants, water
bowls for cattles.
The waste: All the discarded items outside the house such as
6
coconut shell, tires, cans, barrels, buckets, jars, jars broken
Containers with lids: all water containers have the lid, so
mosquitoes are inaccessible breeding.
Water containers with larvae: water containers have Aedes aegypti
and Aedes albopictus larva inside.
The percentage of water containers with larvae: The percentage of
water containers with larvae inside per total number of similar water
containers.
Larvae source: Any individual or category water containers with
large numbers of Aedes larvae that create a large number of Aedes adults.
Household: A group of people that is living in a same house,
eating together and sleep in the same house.
Indoor and surrounding areas: The indoor house is an area inside
of the house with the roof against rainwater. The other remaining part of
the house is called surrounding area.
Household without larvae: A household has none Aedes larvae in
any water containers.
Community: is a social unit with the structure. A group of people
shares and are bound by common characteristics and values which are set
through the interaction and communication of the member.
Community-driven development (CDD) or Community-based
activity is a development initiative that provides control of
the development process, resources and decision making authority
directly to community groups.
Chapter 2
METHODOLOGY
2.1. Objective
Quantitative research: Householder / representatives, students and
secondary school teachers, group leaders / mass organizations and DHF
vector .
Qualitative research: Vice director and DHF/DF responsible staffs
of the Health Prevetive Center, the official of Secondary of Education and
Training Agency, the leader of the People Committee and the Commune
Health Center, head/deputy of People's Committee, leaders of
mass organizations, the principal of the secondary school, head teachers
and class presidents.
7
2.2. The study location and time
The research was conducted at Cai Be district, Tien Giang province.
This research was operated from May 2012 until Feb 2014:
The period of assessing the current situation before the intervention from
May to Oct 2012; Applying the intervention from Oct 2012 to Oct 2013;
Investigating the effectiveness of the intervention from Oct 2013 – Feb
2014.
2.3. Study design
Cross-sectional study described the situation before the intervention,
community intervention with case control group. Cross-sectional study
analyzed the situation after the intervention, the before and after studies
and the quantitative and qualitative studies.
2.4 Sample size and sampling method
2.4.1. Quantitative research
The communes were chosen by Using purposeful sampling, in
which: 2 control communes and 2 intervention communes.
The calculating formula for estimating the sample size with 2
proportions in the population:
n: the minimum sample size of each group; α, β = 0,01: level of
significance; Z α/β = 1,96 95% confidance interval; Z 1- = 99%: Force
sample. The estimate after the intervention has the household without
Aedes larvae in the intervention group p1= 85% and the control group p255%.
Sample size n = 107 (the largest sample size). Because of selecting
cluster group sample to increase the accuracy, the sample size will be
multiplied with the DEFF = 3 (the design effect) and 5% of reserve
samples. Sample size after rouded up was 340.
Sample size of the head of household participated in study was
340 by selecting probability cluster sampling method. The selected cluster
was equal the hamlet of the commune. The identified sampling interval k
was the number of the house per the number of cluster. Selecting the first
household of each cluster was by choosing randomly. Choosing the next
household until reaching the required sample size in each cluster was
based on the coefficient k. Making the list of selected households in each
8
investigated cluster was by following the route, the hamlet and selfmanagement group.
Sample size of student participated in study was 340: by selecting
probability cluster sampling method as selecting the household, the
number of the cluster was equal the number of the class. Selecting the
first student in the cluster was by choosing randomly.
Sample size of the teacher, the leader of the self-management
group: the sample size for investigation was 100 teachers and 150 leaders.
Using the totally sampling method, 100% teachers and 100% leaders.
2.4.2 Quanlitavtive research
Purposeful sampling method:
Depth interview: A vice director in charge of professional job and
a responsible person in DHF/DF of the Health Prevention Center in
district; a responsible person in charge of the secondary school in the
education and training department; two CPC leaders; two principal
teacher of the secondary school and two leaders of the CHS in two
intervention communes.
Group discussion: two discussions with the representative of
hamlet and self-management group, there were 12 chosen people in each
group interview. Two interviews with the group of the head teacher, there
were 10 selected people in each group interview. There were 2 interviews
with the class president and 15 selected students were chosen in each
interview.
The workshop with stakeholders to identify priority measures in
the DHF/DF vector control had 40 people attending.
2.5 The variable and evaluation index
2.5.1 The variable index
Including the information of the objective, knowledge, attitude
and practice in the DHF/DF prevetion.
2.5.2 The evaluation index
The proportion of the sex, the education level and occupation, the
proportion of the receiving information source, the rate of having good
knowledge, attitude and practice in the DHF/DF prevention. The house
index (HI) with having Aedes larvae, the CI with existed Aedes larvae, the
BI, the HI with existed Aedes adult.
2.6 The implement and skill for collecting information
2.6.1 The implement for collecting information
9
Quantitative study: Using the questionnaire to interview directly and
investigate the vector at the household through
the checklists. The
proper knowledge, attitude and practice in DHF/DF prevention was
evaluated by using marking point.
Qualitative study: Using the depth interview and group discussion.
2.6.2 The skill for collecting information
The quantitative investigator divided into many groups, each
group had a guide and two investigators. Investigator groups directed to
the household followed the assigned list. The group chose the respondent
after the approval from the head of the household and then did the vector
investigator. The depth interview consisted of 2 people: one person was
responsible for introducing the research and the interview content; other
recorded all the information from the interview. The group discussion
consisted of 3 people that included a person in responsibility of
introducing the research and the interview content, a person in support for
the respondents about the main part in the discussion and other in
recording the information from the discussion.
2.6.3 The intervention
The main activity was to provide the knowledge and introduce the
DHF/DF vector control community-based method in school and selfmanagement group.
Step 1: Evaluating the situation and preferences
Step 2: Developing the stakeholder group and building the steering
committee to mobilize community involvement
Step 3: Training, implementing and monitoring intervention.
Step 4: Evaluation of implementation.
2.7. Limiting the error in the study
The sample size had to calculate consistent with the design effect
(DEFF). The toolkit in the study must be tested and the investigator must
be trained the skill of collecting information and investigating vector.
2.8. Managing, processing and analyzing data
The data was put in Epidata 3.1 software and analyzed in SPSS
16.0. The analyzing process used the chi-squared test (χ2) and the paired t
test and compared the result at the p<0.05 level for significance.
2.9 Research ethics
The thesis was proved by the ethics council of National Institute
of Hygiene and Epidemiology.
10
Chapter 3
STUDY RESULTS
3.1 Knowledge, Attitude and Practice regarding Dengue prevention
and vector indicators
Table 3.21 Knowledge, Attitude and Practices regarding dengue
prevention
Control
Intervened
Knowledge,
commune (n=930) Commune (n=930)
p*
Attitude and
Practices
Freq.
(%)
Freq.
(%)
Correct knowledge
524
56,3
531
57,1
0,144
Correct attitude
563
60,5
598
64,3
0,222
Correct practices
332
35,7
306
32,9
0,074
2
χ test, p*: compare between case and control groups
The percentage of correct knowledge, attitude and practices
regarding dengue prevention in intervened group were 57.1%, 64.3% and
32.9%, respectively. While the percentage in control group were 56.3%,
60.5% and 35.7%, respectively (p>0.05).
Table 3.22 Vector indicators of Dengue fever
Control
Intervened Difference
commune Commune
(%)
Indicators
(n=930)
(n=930)
Number of water containers
2642
2861
8,29
Water containers contain
978
994
1,64
Aedes larvae
Container index %
37,0
34,7
-6,22
Breteau index
105
107
1,90
Number of households
63,2
62,4
-1,27
detected Aedes larvae
Number of households
51,6
57,6
11,63
detected Aedes mosquito
The percentages of Container Index in control and intervened
groups were 34.7% and 37.0% respectively. The Breteau Index of the
groups were 107 and 105 respectively. 62.4% of the intervened
households detected Aedes larvae while the number is 51.6% in control
group.
11
Table 3.23 Protection of water containers before intervention
Control
Intervened Difference
Commune
Commune
(%)
Water containers
(n=930)
(n=930)
Freq.
(%) Freq. (%)
Active/Used water containers
1498
100 1520 100
1,47
Covered with lid
295
19,69 312 20,53
4,27
Fish raising
134
8,95 137 9,01
0,67
Unprotected container
541
36,11 531 34,93
-3,27
Aedes larvae detected
528
35,25 540 35,53
0,79
Sundry
and
abandoned
containers detected Aedes
1144
100 1341 100
17,22
larvae
Active/Used water containers
450
39,3 454 33,9
-13,74
The percentage of active water containers and containers with fish
in control group were 20.53% and 9.01% respectively, while the
percentages were 19.69% and 8.95% among intervened households.
The percentage of active water containers in intervened group
detected Aedes larvae was 35.53%, 33.9% of abandoned water containers
detected larvae while the percentages of control group are 35.25% and
39.3% respectively.
3.2 Effectiveness of vector control intervention
3.2.1 Results of vector surveillance after the intervention
The average number of Aedes larvae per household before the
intervention (August 2012) was 32.47 (larvaes/household), and 3.39
(larvaes/household) after the intervention (August 2013), equivalent to a
decrease of 89.56%. The percentage of water containers containing Aedes
larvae decreased from 35.54% to 11.83% (66.71% decrease equivalent).
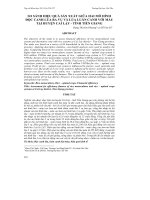
The curve shows that DI and BI of intervened group decreased
significantly in comparision with the control group.
12
BI-Intervened
commune
BI-Control
commune
DI-Intervened
commune
DI-Control
commune
Figure 3.1 Breteau Index and DI between 9/2012 and 12/2013
3.2.2 Information sources and acceptability
Table 3.25-3.26 Information sources and acceptability
Control
Intervened
Commune
commune
Information source
p
p***
(n=930)
(n=930)
Before After
Before After
TV
78,9
87,5 0,028 77,8
89,7 0,017
Commune’s radio
36,3
39,1 0,088 36,1
47,3 0,002
Books, newspaper
11,8
11,3 0,768 12,4
13,1 0,445
Picture, leaflet, poster 25,3
30,4 0,022 27,3
34,9 0,003
Teacher
18,2
18,8 0,473 19,2
37,7 0,001
Medical staff
36,7
40,1 0,511 39,5
43,5 0,038
Self-management
20,2
21,4 0,254 23,5
39,7 0,032
group/MOs
Used to know
88,7
89,9 1,35
89,6
100
2
χ test, p: pre-post comparison in control group; p***: in intervened
group
After the implementation of intervention program, there was an
increase in the information sources (p<0.05), excluding books and
newspaper (p>0.05). Information acceptability increased 11.61% in
comparison with before the intervention. The effectiveness of intervention
in intervened group was 10.25% higher than it was in control group.
13
3.2.3 The improvement of knowledge regarding disease prevention
Table 3.33 Knowledge of participants on DHF prevention and control
Control
Intervened
Intervention
commune
EI
commune
EI
Knowledge
efficiency
(%)
(%)
(n=930)
(n=930)
(%)
Before After
Trước sau
Correct
56,3 61,6
57,1 94,1
9,41
64,8
55,38
Incorrect
43,7 38,4
42,9 5,9
Test
χ2=5,616; p=0,092
χ2= 11,177; p=0,001
3.2.3 The improvement of knowledge regarding disease prevention
There was an increase in the percentage of participants with
correct knowledge on DHF prevention and control by 64.8% in
comparison with before the intervention, from 57.1% to 94.1% (p<0.05)
and the Efficiency of intervention reached 55.38%. While the much
slighter increase was found in control group that increased by 9.41%,
from 56.3% to 61.6% (p>0.05).
Table 3.34 Changes in average score of knowledge after the intervention
Control
Intervened
Differ
Differ Intervention
Average
commune
commune
ence
ence Efficiency
score
(n=930)
(n=930)
(%)
(%)
(%)
Before After
Trước Sau
Correct
34,91 35,65
35,22 44,12
2,12
25,27
23,15
knowledge
+ 5,54 + 6,21
+ 5,04 + 6,25
CI 95%
CI 95%
Paired t-test
(35,14-36,16), p>0,05
(43,71-44,54), p<0,001
There was an increase of 8.9 points in the knowledge of
participants that was equivalent to 25.27% in comparison with control
group. It also means the intervention efficiency reached 23.15%.
3.2.4 The improvement of participants’ attitude towards DHF prevention
and control
Table 3.39 Participants’ attitude of DHF prevention and control
Control
Intervened
Intervention
commune
EI
commune
EI
Attitude
Efficiency
(%)
(%)
(n=930)
(n=930)
(%)
Before After
Before After
Correct
60,5 61,8
64,3
92,7
2,15
44,17
42,02
Incorrect
39,5 38,2
35,7
7,3
Test
χ2 =1,553; p=0,213
χ2 =20,306; p<0,001
14
After the intervention was implemented,
there
was
a
significant increase in the attitude towards DHF prevention and control of
participants in intervened group from 44.17% to 61.6% that equivalent to
an increase of 94.1% (p<0.05) and intervention efficiency reached
42.02%. In contrast, there was no statistically significant change in
control group (p>0.05).
Table 3.40 Mean of correct attitude score after the intervention
Control
Intervened
Commune
Differ
Commune
Differ Intervention
ence efficiency
Attitude
(n=930)
ence
(n=930)
(%)
Before After (%) Before After (%)
(SD)
18,34
+ 1,85
(SD)
(SD) (SD)
19,14
18,75 25,05
Correct
4,37
33,60
29,23
attitude score
+ 2,58
+ 2,44 + 2,49
CI 95%
CI 95%
Paired t-test
(18,93-19,35), p>0,05
(24,89-25,22), p<0,001
After the intervention, the mean of attitude score in intervened
group increase by 6.3 points that was 33.6% higher than in control group.
Intervention efficiency reached 29.23%.
3.2.5 The improvement in practice in DHF prevention and control
Table 3.44 Practice in DHF prevention and control
Control commune
Intervened
Intervention
EI
EI
Efficiency
Practice
(n=930)
Commune (n=930)
(%)
(%)
(%)
Before After
Before
After
Correct
35,7
36,9
32,9
88,9
3,36
170,21
166,85
Incorrect 64,3
63,1
67,1
11,1
Test
χ2=0,712; p=0,399
χ2=10,241; p=0,001
The percentage of correct practice regarding DHF prevention and
control in intervened group increased by 170.21% in comparison with
before the implementation of intervention that was equivalent to 166.85%
of intervention efficiency. While there was no statistically significant
change in control group (p>0.05).
15
Table 3.45 Mean of correct practice score after the intervention
Control
Intervened
commune
commune
Intervention
Diff
Diff
Practice
(n=930)
(n=930)
efficiency
(%)
(%)
(%)
Before
After
Before
After
(SD)
(SD)
(SD)
(SD)
Correct
10,92
11,02
10,49 15,22
0,95
45,14
44,19
practice score + 1,44 + 1,42
+ 1,20 + 1,07
CI 95%
CI 95%
Paired t-test
(10,87-11,17), p>0,05
(15,15-15,30), p<0,001
After the intervention, the mean score of correct practice among
participants who received intervention increased by 4.73 points that was
45.14% higher than control group that made the intervention efficiency
reach 44.19%
92.7
94.1
100
88.9
Before
After
80
64.3
60
62.4
57.1
57.6
32.9
40
19.1
20
14.7
0
correct
knowledge
correct
attitude
correct
practice
households
larvae
households
Aedes
mosquito
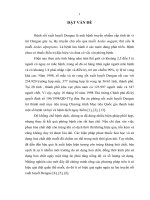
Figure 3.2 KAP on DHF prevention and control and vector indicators
After the intervention, the percentage of participants with correct
knowledge, attitude and practice on DHF prevention and control in
intervened group were 94.1%, 92.7% and 88.9% respectively. 19.1% of
households were detected Aedes larvae, 14.7% found Aedes mosquito.
16
3.2.6 Changes in DHF vector indicators
Table 3.46 DHF vector indicators
Control
Intervened
Intervention
commune
commune
EI
EI
Vector indicators
Efficiency
(n=930)
(%)
(n=930)
(%)
(%)
Before After
Before After
Number of water
2642 2587 2,08 2861 1907 33,34
31,26
containers
Aedes larvae
detected water
978
872 10,84 994
203 79,58
68,74
containers
CI (%)
37,0
33,7 8,92 34,7 10,6 69,45
60,53
BI
105
94 10,48 107
22 79,44
68,96
There percentage of water containers, which were detected with
larvae, decreased by 79.58% after the intervention. Intervention efficiency
reached 68.74%.
Container index and Breteau index of intervened group decreased
by 69.45% and 79.44% respectively after the intervention. The
intervention efficiency of the two indexes were 60.53% and 68.96%
respectively.
Table 3.47 The protection of water containers after the intervention
Control
Intervened
Intervention
commune
EI
commune
EI
Water containers
Efficiency
(%)
(%)
(n=930)
(n=930)
(%)
Before After
Before After
Active water
1498 1385 7,54
1520 1006 33,82
26,27
containers
Covered with lid
295
272 -7,80
312
459 47,12
54,91
Fish raising
134
138 2,99
137
375 173,72 170,74
Aedes larvae
528
482 8,71
540
73 86,48
77,77
detected containers
Sundry and
abandoned
1144 1202 -5,07 1341 901 32,81
37,88
containers
Aedes larvae
450
390 13,33
454
130 71,37
58,03
detected containers
17
There was a decrease of 86.48% in the number of active water
containers among intervened group that were detected with Aedes larvae.
Similarly, the sundry and abandoned containers detected with Aedes
larvae decreased by 71.37%. The intervention efficiency reached 77.77%
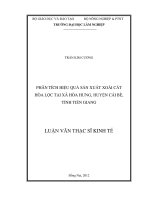
and 58.03% respectively. The lid covered water containers increased by
47.12%. Containers with fish raising increased by 173.72%. Intervention
efficiency reached 54.91% and 170.74% respectively.
3200
2861
2800
Before
After
2400
2000
1907
1520
1600
1006
1200
800
312
400
459
375
137
0
Total water
containers
containers be
useful
containers with
covered lid
Containers with
fish raising
Figure 3.3 Protected water containers in intervened group
Table 3.48 House index of larvae and Aedes mosquito
Control
Intervened
Intervention
commune
EI %
commune
EI %
Index
Efficiency
(p)
(p***)
(n=930)
(n=930)
%
Before After
Before After
Aedes larvae
63,2 61,6 2,53
62,4 19,1 69,39
66,86
house index
(0,385)
(0,001)
Aedes mosqito
51,6 46,3 10,27 57,6 14,7 74,48
64,21
house index
(0,146)
(0,011)
χ2 test, p: Pre-Post comparison in control group; p***: Pre-Post
comparison in intervened group
Aedes larvae house and Aedes mosquito indexs decreased by
69.39% and 74.48% respectively after the intervention (p<0.05) in
intervened group. The intervention efficiency reached 66.68% and 64.21%
respectively. There was no statistical significance in control group (p>0.05).
18
Table 3.49 Vector indicators in students’ households in intervened group
Students’
Other
Total
Indicator
households households
p***
Freq. (%) Freq. (%) Freq. (%)
55
12,5
82 17,0 137 14,7
Aedes larvae Yes
0,042
house index
No
393 87,7 400 83,0 793 85,3
Aedes larvae Yes
73
16,6 105 18,7 178 19,1
0,033
house index
No
375 83,7 377 78,2 752 80,9
χ2test, p***: pre-post comparison in intervened group
After the intervention, the percentage of households with students
detected Aedes larvae and mosquito was lower than households without
students
32.7 Outcomes of intervention program
The program succeeded due to the “Collaboration of provincial
preventive medicine center in the technical training activity that was
organized for teachers and self-management groups who actively played the
roles of trainers for delivery of vector control methods to students and
households’ representatives, and most importantly, for initiation of weekly
larvae control activity” (Indepth interview, deputy director of district
medicine center)
Based on the idea of the students, 4 boxes for fund-raising were
established. The students stated that “We support this activity and we will
save our money for fund-raising activity of the school”
The teachers gave that “The students were interested in fish raising
that the advantage for communicating and encouraging them to raise the fish
for larvae control instead of raising fish for fun. However, we have to
provide fish and tell them how to use the fish because the students do not
have much money”.
The students said that “We will try to follow the guidance of the
trainers for better prevention and control of DHF, but we do not know much
about it. We prefer the solution of using fish to control larvae because we
love seven-color fish, they are so beautiful”
“Monthly surveillance data shows the decrease of larvae quantity in
comparison with previous years. The Aedes larvae control was successful
because adult people were informed by self-management group and the
students were educated by the teachers regularly” (Indepth interview, Leader
of Commune health center).
“This research activity is costless because we combined this activity
19
with other routine activities of self-management group and extra course of
the school. Especially, we do not have to pay salary like it is for
collaborators, however, we should find some fund for monthly steering
committee meetings, or at least, pay the travel cost for representatives of
hamlets and school when they participate the meetings” (Indepth interview,
Leader of Commune health center).
“We must find the financial source to pay salary for collaborators if
we want to expand the model. Whereas we can save the money in the selfmanagement group – and/or school-based vector control approaches”
(Indepth interview, Leader of Commune health center).
“It costs monthly salary for collaborators. While the approach based
on teachers and self-management group does not require the payment.
However, the expenditure for training, monitoring, steering committee
meetings and vector control equipment should be supported by DHF control
program, especially in the phase of maintaining and expanding” (Indepth
interview, vice president of Commune People’s Committee)
“In the near future, we will focus on the control communes which
participated in our research. We found it easy and effective to implement the
larvae control activities through the schools and self-management group”
(Indepth interview, Deputy director of district medicine center)
“Vector control activities are simple and easey to apply and combine
with other regularly activities of self-management group. It saves money for
local health sector, Commune People’s Committee supports these activities”
(Indepth interview, vice president of Commune People’s Committee).
Chapter 4
DISCUSSION
4.1 Knowledge, Attitude and Practice and vector indicators
The results show that the percentage of participants with correct
knowledge, attitude and practice regarding DHF prevention and control in
intervened communes are higher than in control communes, however the
difference is not statistically significant (p>0.05). Although it is not
statistically significant, the primary results reveal the variety between two
groups, however, the efficiency indicator (EI) should be included in postintervention analysis that compares between intervened group and control
group to prove the effectiveness caused by the intervention.
The number of water containers in intervened group and control
group were 2.642 and 2.861 respectively. Among the water containers of
intervened communes, 978 ones were detected with Aedes larvae while it
was 994 containers in control group. The number of larvae detected
20
containers in intervened group was 1.64% higher than in control group. The
Breteau Index (BI=107) of intervened group was 1.9% higher than the
control group. However, the indicator of Aedes larvae detected water
containers of intervened group (CI=34.7%) was 6.22% higher than in the
control group (37.0%). The vector indicator of this study was fairly higher
than other researches that were conducted in the South.
Concerning the active water containers, the percentage of lid covered
containers in intervened group (20.5%) was higher than in control group
(19.7%), equivalent to 4.06% of difference. The active containers, which
contained fish, only accounted for 9% (similar in two groups). Unprotected
containers were reported with 3.32% of difference between two groups
(34.9% and 36.1% for intervened and control group, respectively)
Aedes larvae detected water containers made up 35.5% of households
that was similar to control group. There was a remarkable decrease in the
percentage of sundry and abandoned containers that were infested with Aedes
larvae (decrease by 71.37%) while the decrease in control group was only
13.74%.
Aedes larvae detected household index shows that 62.4% of
intervened households were detected with larvae that was 1.27% lower than
in control group (63.2%). Aedes mosquito detected household index was
57.6% that was 11.63% higher than control group (51.6%).
4.2 The improvement in vector control activity
The percentage of people with correct knowledge on DHF prevention
and control increased 64.8% after the intervention (p<0.05), from 57.1% to
94.1%. The intervention efficiency reached 55.38% while this figure in
control group was 9.41% (p>0.05). The percentage of people with correct
knowledge in this study is higher than a study in Dong Thap (2006, 50%) and
a study in Can Tho (207, 85%). The intervention indicator is also higher than
in a study in Bac Lieu. Communication intervention through health
collaborators and school is in conducive to 15.8% of the increase in correct
knowledge.
The intervention contributed to the change in attitude in DHF
prevention and control, after the intervention, the percentage of correct
attitude increased 44.17% (p<0.05) and the intervention efficiency reach
42.02%, whereas there is no difference in control group both pre and post
intervention in the South. The study result shows the higher percentage than
other intervention in the South.
As a result of the improvement in the community knowledge, the
people will trust the vector control activities, and then they will take actions
21
that will directly benefits their households. The results show that the
percentage of correct practice in DHF prevention and control increased from
32.9% to 88.9% (p<0.05) that equals to 170.21%. The intervention efficiency
reached 166.85% while it is 3.36% between the two groups.
The intervention program succeeded in control the vector that were
illustrated by the decrease in DHF vector indicator after the implementation
of the intervention.
Among the intervened group, the total number of water containers that were
found with Aedes larvae decreased by 79.58% and CI% indicator decreased
by 69.45% after the intervention (from 34.7% to 10.6%). BI indicator
decreased by 79.44% (from 107 to 22). Whereas, there was slight decrease in
CI and BI indicators in control group by 8.92% and 10.48% respectively.
Although the decrease of CI and BI was seen in both groups, the analysis
proves the effectiveness caused by the intervention program as follows:
efficiency indicator of CI reached 60.53% and BI reached 68.96%.
According to the DHF vector surveillance guideline of Ministry of Health
and World Health Organization, the BI indicator in this study (BI=22) is
remarkably lower than DHF epidemic alarming level (BI<50) and nearly
reaches the safety level (BI<20).
The total number of active water containers with lid coverage
increased by 47.12% after the intervention that the intervention efficiency
reached 54.91% in comparison with control group (the increase in control
group was 7.8%). Fish raising can be considered as long-term solution for
effective control of the larvae of Aedes mosquito in water containers. The
percentage of water containers included fish increased by 173.72% in
comparison with before the intervention’s implementation. The intervention
efficiency reached 170.74% while this number in control group was 2.99%.
After the intervention, the unused water containers are regularly
discarded, the sundry and abandoned containers are destroyed. Generally, the
total number of water containers decreased by 33.8% after the intervention
that helps the intervention efficiency reached 26.3%. Among those, the
number of sundry and abandoned containers decreased by 32.81% after the
intervention. In contrast, the number increased by 5.07% in control group.
The practice in protecting the water containers was in conducive to the
86.48% decrease of Aedes larvae detected active water containers. The
intervention efficiency reached 77.77% while it was 8.71% in control group
Aedes aegypti was found but Aedes albopictus was not. The house
infested by Aedes decreased by 74.48% and the house with Aedes larvae
decreased to 19.1% after the intervention (p<0.05). The intervention
22
efficiency reach 64.21% and 66.86% respectively. To compare with the
control group, the numbers wre 10.27% and 2.53% respectively (p>0.05).
The Aedes larvae detected house index were much lower than other research
in the south where the indexes were 31.6%-40% and 27.5%-56.14%
The cost for implementation of program in intervened group was 50
million dong, among those the self-management group vector control
implementation was 30%, chool based vector cotrol accounted for 20%,
communication cost 30%, budget line for investigating, 10% for larvae
control campaign. The budget for inspection and 5% for miscellaneous. To
date, the budget for DHF prevention and control is used by communication,
collaborators, epidemic response, larvae campaign, the small scale
epidemics. There are 10-12% of the commune implemented the activity, each
collaborator received 100.00 dong/month. Thus, 48 million dong is needed to
pay the salary for collbaorators (100.000 dong/ collaborator x 12 months,
being uncounted other expenditure such as training, regular inspection,
communication. So the self-management group based and school based
model of this study, if expanded to other communes, will cost less in
comparison with the model that includes payment for collaborators’ salary
for vector surveillance at households.
The vector control methods archieves the success should engage the
community, the vector control activity was done by the households (master,
representatives) and students. All the solution for vector control was
developed based on the demand and available resource of the local
organizations. The activities should consider the community coverage that
means the intervention is conducted in all households.
The intervention was successful due to the link of intervention and
regular activities of the school and self-management group. The organization
and implementation of vector control activities were conducted with the
participation of local authority and Education and Training sector that
contributed to the success of the activities.
23
CONCLUSION
Knowledge, attitude and practice in the DHF/DF prevetion and
the vector index before intervention
Assessing the situation before the intervention showed that the
knowledge and practice in the DHF/DF prevetion was indifferent between
the intervention group and the control and less than 65% (corresponding
to 57.1% respectively; 64.4%; 32.9% in comparison with 56.3%; 60.5%;
35.7%). The implementation of vector control measures through actual
inspection is lower than with the rate of larvavorous fish in the water
container was 9% (the rate in the control group was 19.7% and 8.9%).
The vector index were above the waring threshold. At the study
site, the Aedes larvae container index was 34.7% and the BI was 107
(with the index in the control group respectively 37% and 105). The
house index of larvae and Aedes adult were 62.4% and 57.6%
respectively (the control group: 63.2% and 51.6%).
The effectiveness of the DHF/DF prevention method:
After the intervention, vector control model community-based has
helped raise awareness of the people and has reduced the vector indices
have statistical significance, the rate of having the lid increased 47.12%
and the rate of having larvavorous fish increased 137.72%, the effective
intervention was respectively 54.91% and 170.74%.
The intervention program delivered the effect in improving the
knowledge, attitude and practice in the DHF/DF prevention. The Aedes
larvae water container decreased to 69.45% and the BI was at 79.44%, the
effective intervention reached to 60.53% and 68.98%. The house index
with larvae reduced to 69.39% and the house with the Aedes adult was at
74.48%, the effective intervention reached to 66.86% and 64.21%.