Stabilization, Adjustment and Growth Prospects in Transition Economies
Bạn đang xem bản rút gọn của tài liệu. Xem và tải ngay bản đầy đủ của tài liệu tại đây (135.44 KB, 53 trang )
Stabilization, Adjustment and Growth Prospects in
Transition Economies
Cevdet Denizer
Macroeconomics and Growth Division
Policy Research Department
The World Bank
February 1997
The findings, interpretations, and conclusions expressed in this paper are entirely the authors. They do
not necessarily represent those of the World Bank, its Executive Directors, or the countries they
represent.
Table 9. Forecasting GDP convergence to OECD countries
Levine-Renelt
Per Capita
Investment
Income
At current investment
=30 percent
in US$
rates
(in percent of GDP)
(PPP based)
Number of
Number of
Forecasted
years to
Forecasted
years to
(WB, IMF:1994) Per Capita reach current Per Capita
reach current
Growth
OECD levels
Growth
OECD levels
1. Albania
495
4.08
91
6.3
59
2. Azerbaijan
1720
4.83
51
5.96
41
3. Bulgaria
4280
2.16
69
5.31
28
4. Croatia
3872
1.99
80
5.58
29
5. Czech Republic
7940
4.66
19
4.48
19
6. Estonia
6634
5.18
20
5.13
21
7. Hungary
7010
3.51
28
4.74
21
8. Latvia
5170
3.63
36
5.73
23
9. Macedonia, FYR
1604
7.28
35
5.97
42
10. Moldova
2270
2.94
73
6.04
36
11. Poland
5480
2.59
48
5.06
25
12. Romania
2950
5.8
33
5.85
32
13. Russia
4510
4.83
30
5.55
26
14. Slovak Republic
6730
3.63
29
4.98
21
15. Slovenia
5982
3.78
31
4.71
25
16. Armenia
2204
2.31
93
5.81
38
17. Belarus
4830
6.44
22
5.57
18. Georgia
1354
6.97
39
6.62
41
19. Kazakhstan
2946
5.15
37
6.2
31
20. Kyrgyz Republic
2358
6.23
34
6.23
34
21. Lithuania
3551
3.55
47
5.65
30
22. Tajikistan
993
4.28
70
5.63
54
23. Turkmenistan
2939
6.66
29
3.86
24. Ukraine
3149
6.79
27
5.85
31
25. Uzbekistan
2293
4.54
47
5.76
37
26. Mongolia
2090
3.86
58
5.44
41
27. China
2510
6.93
30
4.83
28. Viet Nam
1040
3.32
88
4.37
67
Average for transition
4104
4.06
45
5.43
30
OECD average (1994)
18602
not applicable
1/27/98
29
Table9.xls
1. Albania
2. Azerbaijan
3. Bulgaria
4. Croatia
5. Czech Republic
6. Estonia
7. Hungary
8. Latvia
9. Macedonia, FYR
10. Moldova
11. Poland
12. Romania
13. Russia
14. Slovak Republic
15. Slovenia
16. Armenia
17. Belarus
18. Georgia
19. Kazakhstan
20. Kyrgyz Republic
21. Lithuania
22. Tajikistan
23. Turkmenistan
24. Ukraine
25. Uzbekistan
26. Mongolia
27. China
28. Viet Nam
Average
Table 8. Forecasting Long-term Trend Growth (Levine-Renelt)
Population Secondary School
Gross
Per Capita Forecasted Forecasted
Growth
Enrollment
Capital Formation Income
Per Capita
Growth
Rate
(share of school
(share of GDP)
in US$
Growth
Rate
age population
in current prices PPP based
Rate
(WB)
(WB, KZ)
(OECD, WEO) (WB, IMF)
1.19
0.79
0.17
495
4.08
5.27
1.28
0.83
0.24
1720
4.83
6.10
-0.35
0.71
0.12
4280
2.16
1.80
0.06
0.80
0.10
3872
1.99
2.06
-0.06
0.89
0.31
7940
4.66
4.60
-0.31
0.92
0.30
6634
5.18
4.86
-0.53
0.81
0.23
7010
3.51
2.98
-0.53
0.92
0.18
5170
3.63
3.10
1.12
0.80
0.38
1604
7.28
8.40
0.41
0.81
0.12
2270
2.94
3.35
0.20
0.83
0.16
5480
2.59
2.79
0.19
0.80
0.30
2950
5.80
5.99
0.55
0.92
0.26
4510
4.83
5.38
0.35
0.96
0.22
6730
3.63
3.98
0.41
0.80
0.25
5982
3.78
4.19
1.40
0.85
0.10
2204
2.31
3.74
0.20
0.92
0.35
4830
6.44
6.66
-0.20
0.82
0.32
1354
6.97
6.76
0.10
0.90
0.24
2946
5.15
5.26
0.40
0.88
0.30
2358
6.23
6.66
0.00
0.78
0.18
3551
3.55
3.55
2.00
0.73
0.22
993
4.28
6.36
4.60
0.70
0.46
2939
6.66
11.57
0.00
0.80
0.35
3149
6.79
6.79
2.20
0.94
0.23
2293
4.54
6.84
1.90
0.78
0.21
2090
3.86
5.84
1.20
0.55
0.42
2510
6.93
8.21
2.10
0.35
0.24
1040
3.32
5.49
0.26
0.84
0.22
4443
4.06
4.32
Sources: International Monetary Fund (IMF), The World Bank (WB), Organization for Economic Co-operation
and Development (OECD), and Krajnyak and Zettelmeyer (KZ, 1996), and author's estimates.
1/27/98
28
Table8.xls
TABLE 7:
Fiscal Deficits and Quasi-Fiscal Expenditures for Selected Countries, 1992-94
(as percentage of GDP)
CB Implicit Subsidy
Fiscal Deficits
1992
a)
Total
1993
1994
1992
1993
1994
1992
1993
1994
2.9
7.0
-0.6
7.6
2.9
6.5
-0.5
2.5
0.0
0.0
0.3
0.3
0.0
0.0
0.8
1.7
0.0
0.0
0.1
0.0
6.8
5.7
0.8
13.4
2.9
7.0
0.2
9.3
2.9
6.5
-0.4
2.5
Bulgaria
5.0
c)
Estonia
-0.5
Romania
5.5
Russia c) 3.4
Kazakhstan
7.3
11.1
1.4
1.0
8.1
1.2
6.1
0.0
3.0
8.8
4.5
1.3
5.9
11.3
32.7
0.8
0.2
3.9
1.7
0.7
0.3
0.0
0.0
2.6
6.3
11.4
14.7
40.0
11.9
1.6
4.9
9.8
6.8
0.3
3.0
8.8
7.1
Slow Reformers
Belarus c) 6.4
Turkmenistan c) 10.1
Uzbekistan c) 10.2
9.4
3.6
8.4
1.5
1.1
2.0
26.5
12.5
13.1
9.3
21.2
18.5
3.4
6.4
19.0
32.9
22.6
23.3
18.7
24.8
26.9
4.9
7.5
21.0
Advanced Reformers
Poland
6.8
Hungary
5.7
b)
Czech Republic
0.5
b)
Slovakia
13.1
Intermediate Reformers
a) Implicit subsidy from the Central Bank to commercial banks and economy due to difference between the
Central Bank refinancing rate and inflation. Annual figures are averages of monthly (quarterly) figures
b) For 1992 the nominal federation subsidy is divided 2 to 1 in favor of the Czech Republic.
c) Calculations done on quarterly basis.
Source: De Melo, Denizer and Gelb (1996).
1/27/98
27
Table7.xls
TABLE 6:
Money, Interest Rates and Real Balances
Group
Advanced
Reformers
Countries
Slovenia
Poland
Hungary
Czech Republic
Slovak Republic
Averages
a
a
Cumul
Lib Index
Broad Money
Growth
(Average Monthly
Change 1992-94)
4.16
4.14
4.11
3.61
3.53
3.91
5
3
2
1
1
2
92
98
105
106
95
99
127
101
106
104
84
104
164
104
102
111
86
113
-3
1
0
-1
-1
-1
-1
3
1
-1
-1
0
Real Money Balances
Discount Rate in Real
1991=100
Terms, percent (average)
92
93
94
1992-1994 end-1994
High
Intermediate
Reformers
Bulgaria
Estonia f/
Lithuania
Latvia
Romania e
Albania
Mongolia g
Averages
2.96
2.93
2.62
2.39
2.35
2.30
2.27
2.55
4
7
9
6
7
5b
6b
6
91
25
30
29
63
82
56
54
76
20
17
28
43
89
36
44
68
21
20
34
41
105
40
47
-3
n/a
n/a
-8
-8
-4
-16
-8
0
-3
n/a
0
12
2
-8
1
Low
Intermediate
Reformers
Russia
Kyrgyz Republic
Moldova
Kazakhstan
Averages
1.92
1.81
1.62
1.31
1.67
15
11
13
19
15
32
36
23
21
28
23
16
9
14
16
16
8
3
8
9
-17
-19
-18
-31
-21
-2
9
0
4
3
Uzbekistan
Belarus
Ukraine
Turkmenistan
Averages
1.11
1.07
0.80
0.63
0.90
19
20
22
23
21
45
35
40
63
46
53
33
26
73
46
71
17
13
9
28
-35
-34
-29
-45
-36
-12
-5
-40
-48
-26
Croatia a
FYR Macedonia
Armenia
Georgia
Azerbaijan
Tajikistan
Averages
4.02
3.92
1.44
1.32
1.03
0.95
2.11
16
19 c/
24
29
17
19
21
68
89
22
29
40
39
48
60
91
7
24
40
30
42
76
89
2
6
19
n/a
39
-9
-1
-33
n/a
-40
-30
-23
2
1
-26
n/a
-52
-16
-18
Viet Nam c/
China
Averages
3.42
3.08
3.25
n/a
2 c/
n/a
97
123
110
107
141
124
n/a
168
n/a
1
-5
-2
0.6
-5
-2.2
Slow
Reformers
Affected
by War
East
Asia
NB: The discount rates in real terms are calculated assuming quarterly compounding. All averages are
simple averages.
a/ Data for 1992 are for the federation.
b/ Broad money growth rate is taken from a quarterly average made monthly by taking a cubic root.
c/ The average discount rate is for 1992-93. For Vietnam, the lending rate for working capital is used.
d/ The rates for 1992-93 are decompounded on monthly basis.
e/ Average interest rate collected over different types of credit.
f/ The NBE credit auction rate is used for end 1994.
g/ The discount rate used is the clearing and settlement account; a mid point of range is used.
Source: De Melo, Denizer and Gelb (1996).
1/27/98
26
Table6.xls
TABLE 5:
Levels and Change in Revenue, Expenditures and Fiscal Balance, 1989-94
Cumul
Group
Advanced
Reformers
Countries
Low
Intermediate
Reformers
Slow
Reformers
Affected
by War
1/27/98
(% of GDP)
Revenue Expenditure Balance
4.16
4.6
5.8
-1.2
46.6
47.5
-0.9
Poland
4.14
6.5
1.5
5.0
47.9
50.4
-2.5
4.11
-6.8
-1.7
-5.1
52.3
58.8
-6.5
a/
3.61
-10.9
-13.8
2.9
51.2
50.7
0.5
a/
3.53
-11.6
-11.5
-0.1
50.5
53.0
-2.5
Averages
3.91
-3.6
-3.9
0.3
49.7
52.1
-2.4
Bulgaria
2.96
-21.9
-17.3
-4.6
38.0
44.1
-6.1
Estonia
2.93
-8.0
-7.5
-0.5
35.0
35.0
0.0
Lithuania
2.62
-25.2
-17.1
-8.1
25.1
30.4
-5.3
Latvia
2.39
-15.1
-12.3
-2.8
36.7
38.7
-2.0
Romania
2.35
-18.5
-7.1
-11.4
32.6
35.6
-3.0
Albania
2.30
-20.3
-16.0
-4.3
27.7
41.0
-13.3
Mongolia
2.27
-12.4
-17.3
5.0
36.2
48.0
-11.8
Averages
2.55
-17.3
-13.5
-3.8
33.0
39.0
-5.9
Russia
1.90
-4.5
-4.4
-0.1
36.3
45.1
-8.8
Kyrgyz Republic
1.81
-14.2
-3.7
-10.4
24.3
32.7
-8.4
Moldova
1.62
-18.2
-7.8
-7.1
17.1
25.9
-8.8
Kazakhstan
1.31
-21.7
-15.7
-6.0
19.0
23.5
-4.5
Averages
1.66
-14.6
-7.9
-5.9
24.2
31.8
-7.6
Uzbekistan
1.11
7.8
9.2
-1.4
43.0
45.0
-2.0
Belarus
1.07
-1.6
3.4
-1.5
36.6
38.1
-1.5
Ukraine
0.80
15.9
25.7
-8.4
42.3
51.4
-9.1
Turkmenistan
0.63
-26.2
-23.9
-2.3
6.2
7.3
-1.1
Averages
0.90
-1.0
3.6
-3.4
32.0
35.5
-3.4
Slovak Republic
Reformers
(% of GDP)
Slovenia
Czech Republic
Intermediate
Levels, 1994
Lib Index Revenue Expenditure Balance
Hungary
High
Change in
Croatia
b/
4.02
12.3
8.1
4.1
27.2
27.6
-0.4
FYR Macedonia
3.92
6.6
5.6
1.1
42.8
45.4
-2.6
Armenia
1.44
-15.2
11.2
-21.6
37.0
61.0
-24.0
Georgia
1.32
-16.5
-6.6
-8.1
15.0
24.0
-9.0
Azerbaijan
1.03
10.2
24.7
-11.5
36.0
49.0
-13.0
Tajikistan
0.95
-4.9
-0.5
-1.0
35.4
38.1
-2.7
Averages
2.11
-1.2
7.1
-6.2
32.2
40.9
-8.6
East
Viet Nam
3.42
8.7
-3.2
5.5
24.7
25.2
-0.5
Asia
China
3.08
-5.1
-4.7
-0.4
11.4
13.3
-1.9
Averages
3.25
1.8
-2.2
2.5
18.1
19.3
-1.2
25
Table5.xls
a/ 1989 figures for Czechoslovakia.
b/ Change over 1991-94
Source: IMF, World Bank, De Melo, Denizer and Gelb (1996).
1/27/98
26
Table5.xls
TABLE 4:
Registered Unemployment through Transition
(as percentage of labor force, end of year)
Group
CLI
1989
1990
1991
1992
1993
1994
Sloveniaa/
Poland
Hungary
Czech Republic
Slovakia
Averages
5.01
5.03
5.04
4.54
4.39
4.80
2.9
0.1
0.3
0.0
0.0
0.7
4.7
6.1
2.5
0.8
1.5
3.1
8.2
11.8
8.0
4.1
11.8
8.8
11.1
13.6
12.3
2.6
10.4
10.0
14.5
16.4
12.1
3.5
14.4
12.2
14.5
16.0
10.9
3.2
14.8
11.9
High
Intermediate
Reformers
Bulgaria
Estonia
Lithuania
Latvia
Romania
Albania
Averages
3.57
3.86
3.58
3.26
3.00
3.04
3.4
0.0
0.0
0.0
0.0
0.0
1.9
0.3
1.5
0.0
0.0
0.0
0.0
7.7
1.5
11.1
0.1
0.3
0.1
3.0
8.6
3.9
15.3
4.8
1.3
2.1
8.4
26.9
9.8
16.4
8.8
4.4
5.3
10.2
28.9
12.3
12.8
8.1
3.8
6.5
10.9
19.5
10.3
Low
Intermediate
Reformers
Russia
Kyrgyzstan
Moldova
Kazakhstan
Averages
2.61
2.63
2.30
1.88
2.36
0.0
0.0
0.0
0.0
0.0
0.0
0.0
0.0
0.0
0.0
0.1
0.0
0.0
0.1
0.1
0.8
0.1
0.7
0.5
0.5
1.1
0.2
0.8
0.6
0.7
2.2
0.7
1.2
1.0
1.3
Uzbekistan
Belarus
Ukraine
Turkmenistan
Averages
1.64
1.55
1.31
0.85
1.34
0.0
1.0
0.0
0.0
0.3
0.0
1.0
0.0
0.0
0.3
0.0
1.0
0.0
0.0
0.3
0.1
0.5
0.3
0.0
0.2
0.2
1.5
0.4
0.0
0.5
0.3
2.1
0.4
n.a.
0.9
Croatia
FYR Macedoniaa/
Armenia
4.83
4.70
2.02
0.0
n.a.
1.0
9.3
n.a.
1.0
15.5
18.0
3.5
17.8
19.0
3.5
17.5
19.0
6.2
18.0
19.0
5.6
Advanced
Reformers
Slow
Reformers
Affected
by War
1/27/98
Country
23
Table4.xls
Group
Country
Georgia
Azerbaijan
Tajikistan
Averages
CLI
1.81
1.47
1.34
2.70
1989
0.0
0.0
0.0
0.2
1990
0.0
0.0
0.0
1.7
1991
0.0
0.1
0.0
6.2
1992
5.4
0.2
0.3
7.7
1993
8.4
0.7
1.1
8.8
1994
n.a.
0.9
1.7
9.0
East
Asia
Viet Nam
China
Averages
4.07
3.67
3.87
n/a
2.6
n/a
n/a
2.5
n/a
n/a
2.3
n/a
n/a
2.3
n/a
n/a
2.6
n/a
n/a
2.8
n/a
Source: De Melo, Denizer, Gelb (1996).
1/27/98
24
Table4.xls
TABLE 3:
Sectoral Shifts at Constant Prices, 1989-94
Group
Advanced
Reformers
Countries
Slovenia a/
Poland a/
Hungary
Czech Republic
Slovak Republic
Averages
Cumul
Lib Index
5.01
5.03
5.04
4.54
4.39
4.8
Industry
-23.3
-21.4
-0.2
-10.5
-14.8
-14.0
Change in share
% of GDP
Agriculture
-3.8
-2.0
-1.7
-0.5
0.2
-1.6
Services
27.1
23.4
1.9
11.0
14.6
15.6
High
Intermediate
Reformers
Bulgaria
Estonia a/
Lithuania b/
Latvia a/
Romania
Albania
Mongolia
Averages
3.57
3.86
3.58
3.26
3.00
3.04
2.94
3.3
-10.3
-12.7
-11.5
-18.8
-6.5
-20.1
3.0
-11.0
4.3
-10.1
2.6
1.9
6.2
14.8
4.3
3.4
6.0
22.8
8.9
16.9
0.3
5.3
-7.3
7.6
Low
Intermediate
Reformers
Russia b/
Kyrgyz Republic
Moldova
Kazakhstan
Averages
2.61
2.63
2.30
1.88
2.4
3.5
-7.8
3.5
-6.3
-1.8
6.5
7.2
6.5
17.5
9.4
-10.0
0.6
-10.0
-11.2
-7.7
Uzbekistan a/
Belarus a/
Ukraine
Turkmenistan
Averages
1.64
1.55
1.31
0.85
1.3
-7.6
5.8
-11.2
-4.5
-4.4
12.7
-2.8
10.0
0.1
5.0
-5.1
-3.0
1.2
4.4
-0.6
Croatia
FYR Macedonia
Armenia c/
Georgia
Azerbaijan
Tajikistan
Averages
4.83
4.70
2.02
1.81
1.47
1.34
3.0
-4.0
9.1
-6.4
-8.7
-14.8
n.a.
-5.0
0.8
-6.0
0.0
18.3
0.2
n.a.
2.7
3.2
-3.1
6.4
-9.6
14.6
n.a.
2.3
Viet Nam
China
Averages
4.07
3.67
3.9
-1.1
18.6
8.8
-6.0
-6.1
-6.1
Slow
Reformers
Affected
by War
East
Asia
c/
7.1
-12.5
-2.7
a/ Change over 1989-93
b/ Change over 1989-92
c/ Change over 1989-91
Source: De Melo, Denizer and Gelb (1996)
1/27/98
22
Table3.xls
TABLE 1:
Liberalization, and Growth, 1989-95
CLI
Group
Advanced
Reformers
Av growth 93/94 GDP
Lowest level
1995
1989
1990
1991
1992
1993
1994
1995
93/94
/89 GDP
of GDP/89 GDP
Slovenia
5.01
-2.70
-4.70
-8.10
-5.40
1.30
5.50
4.00
3.0
84
81
Poland
5.03
0.20
-11.60
-7.00
2.60
3.80
6.00
6.50
4.2
88
82
Hungary
5.04
0.70
-3.50
-11.90
-3.00
-0.80
2.90
1.70
0.0
81
80
Czech Rep. 4.54
1.40
-1.20
-14.20
-6.40
-0.90
2.60
4.80
0.8
81
80
Slovakia
4.39
4.50
-0.40
-15.90
-6.70
-4.70
4.80
7.40
0.4
79
77
Averages
4.80
0.82
-4.28
-11.42
-3.78
-0.26
4.36
4.88
1.7
83
80
High
Bulgaria
3.57
-0.50
-9.10
-11.70
-7.30
-2.40
1.40
2.50
-1.4
73
73
Intermediate
Estonia
3.86
-1.10
-3.60
-11.90
-21.60
-8.40
3.00
4.00
0.9
69
67
Lithuania
3.58
1.50
-5.00
-13.40
0.00
-18.40
1.00
3.50
-7.3
44
44
Reformers
Low
Intermediate
Reformers
Slow
Reformers
Affected
by War
1/27/98
Annual Output Growth
Countries
Latvia
3.26
3.00
-2.30
-11.10
-35.20
-14.80
2.00
0.40
-4.4
60
59
Romania
3.00
-5.80
-7.40
-12.90
-8.80
1.30
3.90
6.90
2.2
69
67
Albania
3.04
9.80
-10.00
-28.00
-7.20
9.60
9.40
8.60
9.5
74
65
Mongolia
2.94
4.20
-2.00
-9.20
-9.50
-3.00
2.10
6.30
0.6
84
83
Averages
3.32
1.59
-5.63
-14.03
-12.80
-5.16
3.26
4.60
0.03
68
65
Russia
2.61
3.00
-2.00
-12.90
-19.00
-12.00
-15.00
-4.00
-13.5
57
52
Kyrgyzstan 2.63
3.00
4.00
-5.00
-19.30
-16.10
-26.20
1.30
-13.2
61
57
2.30
8.80
-1.50
-18.00
-29.10
-1.20
-31.20
-3.10
-17.0
53
46
Kazakhstan 1.88
Moldova
-0.40
-0.40
-18.80
-13.90
-12.00
-25.00
-8.90
-18.5
57
49
Averages
3.60
0.03
-13.68
-20.33
-10.33
-24.35
-3.68
-15.6
57
51
2.36
Uzbekistan 1.64
3.70
4.30
-0.90
-11.00
-2.40
-3.50
-1.20
-2.5
89
88
Belarus
1.55
7.90
-3.20
-1.20
-9.60
-10.70
-19.10
-10.20
-16.6
73
64
Ukraine
1.31
4.10
-3.60
-11.90
-17.00
-13.00
-21.80
-11.40
-18.6
56
48
Turkmenistan0.85
-7.00
-2.30
-4.80
-5.30
-10.20
-20.00
-13.90
-15.0
69
62
Averages
1.34
2.18
-1.20
-4.70
-10.73
-9.08
-16.10
-9.18
-13.2
72
66
Croatia
4.83
-1.50
-8.50
-20.90
-9.70
-3.70
0.80
-1.50
-0.7
69
68
FYR Macedonia
4.70
0.90
-9.70
-10.70
-21.10
-8.40
-8.20
-3.00
-10.7
57
55
Armenia
2.02
14.20
-7.20
-11.80
-52.30
-14.80
5.30
5.00
-7.4
38
38
Georgia
1.81
-4.80
-12.40
-20.60
-44.80
-25.40
-11.30
-5.00
-24.6
24
23
Azerbaijan
1.47
-4.40
-11.70
-0.70
-22.10
-23.10
-21.10
-13.20
-17.7
50
44
Tajikistan
1.34
-2.90
-1.60
-7.10
-29.00
-11.00
-21.50
-12.50
-26.3
35
30
Averages
2.70
0.25
-8.52
-11.97
-29.83
-14.40
-9.33
-5.03
-14.5
45
34
East
Viet Nam
4.07
8.5
145
100
Asia
China
3.67
11.7
157
100
Averages
3.87
10.1
151
100
Note: CLI = cumulative liberalization index.
20
Table1.xls
Source: De Melo, Denizer, Gelb (1996)
1/27/98
21
Table1.xls
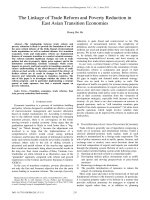
Figure 1. Change in share of service sector in GDP
Group 1
18 2
Group
Group
16 3
Group 4
16
10
4
-1
14
12
10
8
6
4
2
0
-2
Low Reformers
Advanced
Reformers
1/27/98
High Intermediate
Reformers
28
Low Intermediate
Reformers
Figure1.xls
Change in share of service sector in GDP
Low Reformers
High Intermediate
Reformers
1/27/98
Low Intermediate
Reformers
29
Figure1.xls
I. INTRODUCTION
It is now almost eight years since the transition from plan to market and from one party to
democratic rule has begun in Eastern Europe (EE), and over five years in the former Soviet Union
(FSU). It is widely agreed that this political and economic transition, affecting about one fourth of the
world's population, has been a unique and historic experience1. In EE political regimes changed in a
very short time ending one party system socialism. In further east, the collapse of the FSU resulted in
fourteen newly independent states. Output declines surpassed expectations and some countries lost
more than half of their GDPs by 1995. Over the course of the transition inflation has reached
thousands of percent, especially in FSU countries, sharply lowering wages and hence living standards.
The scope and scale of necessary policy reforms to complete the transition have been
unprecedented. Since the entire economic and political edifice has collapsed, the transition required a
"systemic change; liberalization of tightly controlled prices under socialism, freeing of foreign trade and
opening up current and capital accounts, allowing private sector entry, privatization and enactment of
laws for private property ownership, and restructuring of financial systems. However, the issue was
not simply implementing these reforms. As noted by Bruno (1993) the main novelty in EE and FSU
lied in "the revolutionary change in institutions and in the required norms of economic behavior...",
Clearly, this includes, in fact requires, redefining the role of the State, a major task by itself.
On this front, the EE and FSU countries faced different challenges. While the EE countries
were sovereign states prior to the collapse of socialism, with the exception of Russia and the Baltics,
1
For a review of socialist sytem and some aspects of transition experience in a historical context see Kornai
(1992). For a review of conceptual linkages among reform policies see Kornai (1995), and Blanchard (1997). For a
comprehensive review of the economic issues during transition see Lavigne (1995). Stiglitz(1994) also discusses some
important aspects of transition. Gros and Steinherr(1995) provide a thorough review of transition in EE. Eurpean Bank
for Reconstruction and Developmet (EBRD) provides a review of transition in its annual Transition Report since 1994.
For a comprehensive review of transition, including China's experience, see World Development Report (1996).
2
the FSU states that became sovereign nations after the dissolution of in 1991 faced a double task: (i)
developing an administrative capacity so as to function as a sovereign nation state; and (ii) creating
national economies out of a highly integrated all Union plan based economy and converting it into a
market based one. Hence, it was clear in the beginning that transition in the FSU would be more
problematic.
To this day, the transition has been an uneven process and cross country experience has varied
significantly. Despite early difficulties, some countries have made impressive progress. Almost all EE
countries stabilized their economies and by 1994 most were enjoying growth. In the FSU, output and
inflation performance has been much more variable and transition has been more difficult as was
expected. With the exception of a handful of countries, the majority of the countries in the FSU
delayed reforms or adopted reforms gradually, and they suffered higher output falls and higher inflation
than in EE. Nevertheless, by the beginning of 1995 stabilization efforts picked up in almost all FSU
countries and most managed to control inflation. Structural reforms, however, with the exception of a
few countries, have progressed at a slower pace and growth performance has not been as strong as in
EE.
Against this background, the objective of this paper is twofold. As the discussion above
suggests and noted in the literature, reforms and economic outcomes varied widely across countries
and this gave rise to "transition patterns" in terms of growth and inflation (World Bank). What
accounts for these patterns? Is it largely due to policy variations or inherited initial conditions, or both?
These questions are the focus of the first part of the paper. In the second part, the paper considers the
growth prospects of transition economies. Since they all suffered from output declines and improving
welfare requires growth, this issue is high on the agenda for all transition economies. The focus is on
3
the analysis of factors of that could facilitate or hinder growth based on the findings of the current
empirical growth literature.
The limitations of the data used in this paper and in other transition related studies is well
known and are discussed elsewhere2.
However, since the focus of the paper is on comparative
patterns broadly rather than precise estimates of various aggregates or their analysis, it is thought that
available data could serve the purpose on hand reasonably well.
II. PERFORMANCE DURING THE TRANSITION
This section provides a review of main macroeconomic aggregates, GDP growth and inflation
rates in the EE and FSU up to 1996. The data organized according to the Cumulative Liberalization
Index (CLI) originally prepared by de Melo, Denizer and Gelb (DDG). The CLI is annual and covers
the period between 1989 - 1995. It is composed of three sub-indices and each vary between zero,
representing a centrally planned economy and one, representing a reformed, market based economy.
These are internal or domestic price liberalization and competition (I); foreign trade liberalization and
current and capital account convertibility (E) and privatization, new entry regulations and small and
large enterprise development (P). Using these three sub-indices and assigning them weights (0.3, 0.3,
and 0.4 respectively) DDG create a cumulative liberalization index (CLI) for the same time period. In
this way, the CLI captures both the intensity and duration of reforms.
Following this exercise, the countries are grouped into reform categories. Countries that were
affected by regional tensions or civil wars, are shown separately. The groupings are arranged by the
following values of the CLI:
2
For a discussion of the nature of data biases in transition countries see World Development Report (1996).
4
Group 1: advanced reformers, CLI>4
Group 2: (high) intermediate reformers, 2.7
As shown in table 1, when transition started out, 1989 in EE and late 1991 in FSU, there was a
recession in all countries. This was expected and many analysts pointed this out early in the transition
(Bruno 1991, Fischer and Gelb 1991). What was not expected, however, was the severity of the
declines in output. Initial years of transition saw massive declines in reported GDP, which reached to
an average of 41 percent of GDP by 1995, as noted by Fischer et al (1996). In the case of FSU, output
collapse started in 1992 although in most countries output has been falling since 1989. This was
mainly due to the breakdown of the CMEA trading system, and given the interlinked nature of
production structure in the FSU, output falls were simply unavoidable early on in the process.
Inflation has also increased rapidly initially.
This largely reflected the effects of price
liberalization and hence it was a necessary level adjustment towards international prices. However,
continued increases in prices after the initial spurt largely reflected the effects of monetary financing of
deficits. Only three countries in Europe (Czech Republic) managed to contain inflation in double digits
throughout. In the FSU inflation first increased in 1991 from previous low levels. Starting in 1992,
price increases reached record levels, with Armeina and Ukraine recording inflation rates of 10,000
percent in the year of maximum inflation. Every country in FSU, except the Baltics, at one point
experienced inflation rates of more than 1000 percent.
5
Starting in 1992 growth was turned positive in Poland and by 1994 all advanced reformers
were growing strongly which continued in 1995 and preliminary estimates of output suggest this trend
has contimued in 1996 (EBRD, 1996). As shown table 1 , the cumulative output drop, at about 20
percent between 1989 and 1994, was the lowest in this group relative to all other countries included in
this study. The next group, high intermediate reformers also started to grow in 1994 but this group,
on average, registered a cumulative output fall of 35 percent in the same period. On the other hand,
with the exception of the Kyrgy Republic, low intermediate reformers were still registering negative
growth in 19953. Moreover, these countries lost half of their output. Slow reformers seem to have
suffered less in terms of output drop but growth was still negative in 1995, and 1996 according to
preliminary estimates of GDP in those countries. Not surprisingly, countries affected by regional
conflicts or internal disturbances lost more than half of their output although some attained relatively
high CLI values.
Inflation data, shown in table 2, more or less mirrors the patterns of growth with one major
difference. That is, in every county whrere growth turned positive, this was preceded by a sharp fall in
inflation rates, or stabilization. In fact, as data shows growth returned in EE about two years after
inflation stabilization was achieved.
In other s in FSU and Mongolia resumption of growth took
longer, about 3 years after stablization which is a year longer than the EE countries.
These patterns are also visible if fiscal deficits and and base money data are arranged by the
CLI, which are presented in tables 7 and 8. As can be seen, there was almost one to one relationship
between fiscal deficits and base money growth. In the advancded reformers. deficits are much smaller
3
Output data does not include estimates of the informal sector and hence actual decline is probably lower. See Kaufman and
Kaliberda (1996) for estimates of the unoffical economy in transition economies.
6
and the monetary policy is not under pressure to accommodate the deficits. In the second and third
group deficits are larger but base money growth was still under control as domestic and foreign
financing were available which in turn depended upon reforms. The slow reforming group seem to
have lesser deficits than the second and third group but this hides subsidized central bank lending. As
shown by DDG (1996) and reproduced in this paper as table 9, such lending, which is an element of
quasi-fiscal deficits, ranged 9-20 percent of GDP in slow reforrmers and as a result base money growth
was rapid.
III. REFORMS, GROWTH AND INFLATION
What lies at the source of this differential reform, output and inflation performance across
countries? It is obvious that one source is the economic policies followed by countries. To explore the
relationship between policies and outcomes, a cross country regression analysis is carried out similar to
DDG (1996). In this framework growth and inflation equations are estimated as functions of the CLI
and some other control variables. Since the other source of cross country variation could be due to
initial conditions (ICs), this paper extends the DDG study including proxies for ICs into the regression
equations.
The other variables included in the regression analysis are the following. In the first equation,
the dependent variable is the GDP growth rate (GR). The CLI is the key variable. A positive
relationship would be an indication of the beneficial effects of economic policies or reforms on growth.
Since overindustrialization was one of the features of centrally planned economies, the share of
industry in GDP (IS) was included in the equations. The rationale is that the more industrialized a
country, the disruption of trade and financial flows due to the collapse of planning would be larger and
7
reduce growth rate during the transition period. In this way the effects of trade dependence are also
captured.
There are two initial condition proxies included in the equations. The first is a dummy variable
for institutional factors (IF). It is given a value of one for the countries which were market oriented
and sovereign states before becoming socialist countries. The idea is to understand the importance of
market memory and administrative capacity during the transition. As noted already most FSU
countries, except the Baltics, were never independent states in their history and this could be an
important determinant of their ability to reform. The second factor considered is the distance, (DM)
from markets. For this purpose, following Murrell (1996) the distance (in miles) from Vienna is used.
The goal is to understand the importance of geographical distance from rich markets on growth
performance. Regional tensions are also captured with a dummy variable (RT).
The following equation is estimated with t ratios in parenthesis:
GR = -3.2 + 1.9CLI - 1.2IS - 4.7DM + 3.9IF - 9.1RT ......... ..(1)
(-2.8) (3.1) (-2.2)
(-4.2)
(1.9)
(-3.7)
Adjusted R2: 0.57
For inflation a different specification is proposed. In addition to the CLI, fiscal deficits (FD)
and repressed inflation (RI) are added. Fiscal deficits are consolidated budget deficits of each country.
8
Repressed inflation is calculated by change in wages less change in GDP. Since only wage payments
were made in cash under central planning, wage rises beyond GDP growth would mean the
accumulation of financial assets by households given shortages of goods. This is also known as
monetary overhang. Hence, the larger the repressed inflation, the larger the price increases would be.
The estimated equation is:
LogINF = 3.7 - 4.2CLI + 1.2FD + 2.9RINF + 9RT................(2)
(2.9) (-2.4)
(4.33)
(1.8)
(2.5)
Adjusted R2: 0.63
According to the results in the first equation, CLI was positively related to growth. The
coefficient of industry confirms our expectation that more developed countries would face larger
declines in their growth rates. Both initial condition variables enter with the expected sign. This
suggest that countries that were not independent states in their history and far from rich markets
suffered more during the transition. This is an important finding as it suggests that initial conditions
matter in the transition period and this may have limplications for long run growth potential of the
countries in question. Regional tension variable enters with a negative sign as anticipated. While the
estimated coefficient needs to be interpreted with caution as they only capture broad relationships
between the variables used, the large coefficient of regional tension variable is suggestive of how much
it could add to the decline in the growth rate in addition to other factors.
9
Results of the inflation equation are also in line with our apriori expectations. Comprehensive
and sustained reform efforts were negatively related to inflation rates. Smaller fiscal deficits also
reduce inflation although it is significance level is lower than the CLI coefficient. This is expected
because reforms reduce subsidies which in turn reduce fiscal deficits. Repressed inflation enters with a
positive sign which suggests that this variable as expected.
Regional tension (RT) variable has a
positive coefficient as expected and highly significant4
Regressions were also run with the individual components of the index. The results show that
this does not change the qualitative conclusions and hence they are not presented . In each case they
are significant and enter with the expected sign. There is a change in the coefficients but this is
relatively small in magnitude.
IV. REFORMS AND STRUCTURAL CHANGE: THE LINKS AND THE PROGRESS
The effects of the intensity and duration of reforms on economic structure can be analyzed by
examining three indicators. The first one is the share of services. Previously, this was a repressed
sector, and with the liberalization of the economy, it was expected that services would expand rapidly.
As shown in table 3, this was realized and rapidly reforming economies recording the largest increases
as a percentage in their GDPs. In fact, given the decline in the shares of industry and agriculture, it
seems that the link between growth and reforms were largely driven by the growth of the services
sector.
The other indicator of structural change is the change in the share of private sector in GDP. It
goes without saying that private sector’s share was low under socialism. However, again there were
4
Controlling for the effects of different reform start dates did not change the results. Hence time profile of inflation and
growth support the results presented in this paper. For a description of the technique how this could be done see DDG (1996).
10