Phương pháp chẩn đoán hình ảnh (phần 12)
Bạn đang xem bản rút gọn của tài liệu. Xem và tải ngay bản đầy đủ của tài liệu tại đây (3.01 MB, 39 trang )
2089_book.fm Page 433 Tuesday, May 10, 2005 3:38 PM
12
Evaluation Strategies
for Medical-Image
Analysis and Processing
Methodologies
Maria Kallergi
CONTENTS
12.1
12.2
12.3
12.4
Introduction
Validation Models and Clinical Study Designs
Clinical Performance Indices
Nonobserver Evaluation Methodologies
12.4.1 Computer ROC Test
12.4.2 Computer FROC Test
12.4.3 Segmentation Validation Tests
12.5 Observer Evaluation Methodologies
12.5.1 ROC Test
12.5.2 LROC Test
12.5.3 FROC Test
12.5.4 AFC and MAFC Tests
12.5.5 Preference Tests
12.6 Study Power and Biases
12.6.1 Database Generation
12.6.1.1 Database Contents and Case/Control Selection
12.6.1.2 Database Size and Study Power
12.6.1.3 Ground Truth or Gold Standard
12.6.1.4 Quality Control
12.6.2 Algorithm Training and Testing and Database Effects
12.6.3 Estimation of Performance Parameters and Rates
12.6.4 Presentation Setup
12.6.5 Statistical Analysis
12.7 Discussion and Conclusions
Acknowledgments
References
Copyright 2005 by Taylor & Francis Group, LLC
2089_book.fm Page 434 Tuesday, May 10, 2005 3:38 PM
434
Medical Image Analysis
12.1 INTRODUCTION
Image-processing and pattern-recognition methodologies have found a variety of
applications in medical imaging and diagnostic radiology. Medical-image processing
has been an area of intensive research in the last two decades with remarkable results.
A variety of classical methodologies from the signal-processing and pattern-recognition domains and new ones have been implemented and tested for diverse applications. Based on the output, the various approaches can be categorized in one of
the three groups shown in the block diagram in Figure 12.1. These groups involve
one of the following processes:
Image analysis can be defined as the process where the input to an operator
is an image and the output is a measurement. This group includes such
processes as automated detection and diagnosis of disease, organ area and
volume segmentation, size measurements, and risk estimates [1–6].
Image processing can be defined as the process where the input to an operator
is an image and the output is another image with similar contents to the
original but different in appearance. This group includes such processes as
image enhancement, restoration, compression, registration, and reconstruction [7–10].
Image understanding can be defined as the process where the input to an
operator is an image and the output is a different level of description, such
as transforms and pixel mappings [11].
Depending on the goal of the application, the operator in Figure 12.1 could be
a signal processing algorithm, a pattern-recognition algorithm, a contrast-enhancement or noise-reduction function, a transformation, a mathematical measurement,
or combinations of these. The most extensive and successful development so far has
Image-in
Operator
Image-out
Measurement-out
Data Transform
FIGURE 12.1 Block diagram of the various medical-image processes. Depending on the
operator type, the output may be an image, a measurement, or a transformation.
Copyright 2005 by Taylor & Francis Group, LLC
2089_book.fm Page 435 Tuesday, May 10, 2005 3:38 PM
Evaluation Strategies for Medical-Image Analysis
435
occurred in the fields of computer-aided detection (CAD detection) and computeraided diagnosis (CAD diagnosis), i.e., in the image-analysis field, with image
enhancement following closely behind. CAD detection is now a clinical reality for
breast and lung cancer imaging. Several commercial systems are now available for
breast cancer imaging and screen/film (SFM) or full-field direct digital mammography (FFDM) [2]. Similar systems are currently in beta testing stages for lung
cancer imaging using computed radiography, standard chest radiography, or computed tomography (CT). CAD detection usually refers to the process where areas
suspicious for disease are automatically detected on medical images, and their
locations are pointed out to the observer for further review [1, 2]. In addition to
pointing out the location of a potential abnormality, CAD detection algorithms may
include a segmentation step, namely a process where the margins of the detected
lesion, such as lung nodules in lung cancer images, calcifications or masses in
mammograms, are outlined, and the outline may be presented to the reader as
opposed to merely a pointer of the lesion’s location [12].
CAD diagnosis differs from CAD detection in that the detected lesions (either
by the observer or by the computer) are differentiated (classified) in groups of disease
and nondisease lesions [13, 14]. In this chapter, following historical precedence, the
plain CAD term will be used to refer to both technologies, i.e., both detection and
diagnosis algorithms, but we will differentiate by adding a detection or diagnosis
extension to the term where a specific and unique reference is required.
As new medical-image analysis and processing tools become available and new
versions of existing algorithms appear in the market, the validation of the new and
updated methodologies remains a critical issue with ever-increasing complications
and needs. The general goal of validation is twofold: (a) ensure the best possible
performance (efficacy) of each step of the process outlined in Figure 12.1 that would
yield optimum output results and (b) determine the real-world impact of the entire
process (effectiveness) [15]. The first goal is usually achieved in the laboratory with
retrospective patient data of proven pathology and disease status and various statistical analysis tools that do not involve human observers or experts. The second goal
usually requires the execution of clinical trials that involve experts and usually
prospective patient data. Clinical studies are, in most medical applications, inevitable
and are the gold standard in medical technology validation. However, the laboratory
or nonobserver studies that precede them are critical in establishing the optimum
technique that will be tested by the observers so that no funds, time, or effort are
wasted [15, 16]. Furthermore, laboratory tests are sufficient when validating updated
versions of algorithms once the original versions have demonstrated their clinical
significance.
This chapter will not elaborate on the aspects of clinical trials or theoretical
validation issues. Rather, it focuses on the major and practical aspects of the preclinical and clinical evaluation of diagnostic medical-image analysis and processing
methodologies and computer algorithms. We will further narrow down our discussion
to selected tests and performance measures that are currently recognized as the
standard in the evaluation of computer algorithms that are designed to assist physicians in the interpretation of medical images. We will discuss observer vs. nonobserver tests and ROC vs. non-ROC tests and related interpretation and analysis
Copyright 2005 by Taylor & Francis Group, LLC
2089_book.fm Page 436 Tuesday, May 10, 2005 3:38 PM
436
Medical Image Analysis
aspects. Our goal is to provide a basic and practical guide of the methods commonly
used in the validation of computer methodologies for medical imaging in an effort
to improve the evaluation of these techniques, advance development, and facilitate
communication within the scientific community.
Section 12.2 provides a brief overview of the current validation models and
designs of clinical trials. Section 12.3 introduces the standard performance measurements and tests applicable in medical imaging. Section 12.4 summarizes the most
important nonobserver validation methodologies that usually precede the observerbased validation techniques described in Section 12.5. Section 12.6 discusses practical issues in the implementation of the various validation strategies. Conclusions
and new directions in validation are summarized in Section 12.7.
12.2 VALIDATION MODELS AND CLINICAL STUDY DESIGNS
Entire industry conferences are dedicated to issues of validation and clinical study
design, including the annual meetings of the Medical Image Perception Society
(MIPS) and the Medical Imaging Symposium of the Society of the Photo-optical
Instrumentation Engineers (SPIE). At least two workshops have also been organized
in the U.S. since 1998 on clinical trial issues for radiology, sponsored by the U.S.
Public Health Service’s Office on Women’s Health, the National Cancer Institute,
and the American College of Radiology. One workshop, entitled Methodological
Issues in Diagnostic Clinical Trials: Health Services and Outcome Research in
Radiology, was held on March 15, 1998, in Washington, DC, and participating papers
were published in a dedicated supplement issue of Academic Radiology [17]. A
second workshop, entitled Joint Working Group on Methodological Issues in Clinical
Trials in Radiological Screening and Related Computer Modeling, was held on
January 25, 1999, and yielded recommendations on various aspects of clinical trials,
a summary of which can be found at />Validation models usually start with tests of the diagnostic performance of the
imaging modality or computer methodology, followed by measurements of the
clinical impact or efficacy of the diagnostic test on patient management and followup, and ending with broader clinical studies on patient health effects (morbidity and
mortality) and societal impact, including cost analysis. Clinical study types are
differentiated usually by the nature of the patient data used and can be categorized
as: (a) observational vs. experimental, (b) cohort vs. case control, and (c) prospective
vs. retrospective. There is an extensive, in-depth bibliography on the various aspects
of clinical studies, the various types, and their advantages and disadvantages [18–20].
An excellent glossary summary of the various terms encountered in clinical epidemiology and evidence-based medicine is given by Gay [21].
Fryback and Thornbury proposed a six-tiered hierarchical model of efficacy that
is now embraced by the medical-imaging community involved in outcomes research
and technology assessment [15, 17, 22]. Different measures of analyses are applied
at the various levels of the model. Level 1 is called “technical efficacy” and corresponds to the “preclinical evaluation” stage. In this level, the technical parameters
of a new system are defined and measured, including resolution and image noise
measurements, pixel distribution characteristics, probability density functions, and
Copyright 2005 by Taylor & Francis Group, LLC
2089_book.fm Page 437 Tuesday, May 10, 2005 3:38 PM
Evaluation Strategies for Medical-Image Analysis
437
error and standard deviation estimates [15, 22]. Clinical efficacy is measured in the
next three levels of the model, with tests to determine the “diagnostic accuracy
efficacy” (Level 2), the “diagnostic thinking efficacy” (Level 3), and the “therapeutic
efficacy” (level 4) [15, 22]. Levels 2 and 3 correspond to what imaging scientists
often term “clinical evaluation” and include measurements of performance parameters and observer experiments that are the focus of this chapter and will be further
discussed in the following subsections. Level 4 is more specific to therapy-related
systems and is not within the scope of this discussion, which deals with diagnostic
systems. Level 5 deals with “patient outcome efficacy” and Level 6 with “societal
efficacy” [15], both beyond the scope of this review. This six-tiered model provides
an excellent guide for pharmaceutical and therapy trials. Its extension to screening
and diagnostic medical-imaging technologies is less straightforward due to the
unique characteristics of the target population, the diversity of the applications, the
observer variability, and the issues of low-prevalence for several disease types
including cancer. In some cases the model appears to be noninclusive; in other cases
it is not entirely applicable or is not linearly applicable. Hendee [23] suggested the
expansion of the model to include a factor related to the development stage or phase
of evolution of the validated technology. This may lead to a model more applicable
to imaging.
Another approach recommended for medical-imaging technology validation was
developed by Phelps and Mushlin [23, 24]. This approach is recommended as a way
to define “challenge regions” and as a preliminary step guiding the design of the
more expensive and time-consuming clinical trials to test the efficacy of the technology as proposed by Fryback and Thornbury [15]. The Phelps and Mushlin model,
however, seems to be limited in scope and applicability, and an expansion is necessary to accommodate a broader spectrum of imaging technologies [23].
Different clinical study designs may be applicable to levels 2 and 3 of the Fryback
and Thornbury model. The most commonly used design is the observational, casecontrol, retrospective study that could use a variety of performance measures. The
current standard for these studies in medical imaging is the receiver operating
characteristic (ROC) experiment with the corresponding measure being the ROC
curve [25, 26]. ROC experiments are time consuming and expensive. Hence, nonROC approaches are explored and applied either as less-expensive precursors or as
replacements to the more extensive and expensive ROC studies. Non-ROC studies
may or may not involve observers. The selection of one method over the other
depends on the application and the question to be answered.
There is a vast literature on CAD development. Numerous algorithms have been
reported, and the majority of reports include some type of validation that depends
on the investigators’ knowledge of the field but mostly on available medical and
statistical resources at the time. The lack of an agreement on “appropriate” methodologies leads to a lack of standard criteria and a “how-to” guide that could
significantly improve scientific communications and comparisons. Only recently do
we find publications that present broader methodological issues of validation and
offer some guidelines. Nishikawa [27] discusses the differences in the validation of
CAD detection and CAD diagnosis methodologies and offers a good summary of
the ways ROC and free-response ROC (FROC), computer- or observer-based, can
Copyright 2005 by Taylor & Francis Group, LLC
2089_book.fm Page 438 Tuesday, May 10, 2005 3:38 PM
438
Medical Image Analysis
TABLE 12.1
Clinical Performance Indices
Observer or computer response positive
Observer or computer response negative
Signal or Disease Present
Signal or Disease Absent
Hit (TP)
Miss (FN)
False alarm (FP)
Correct rejection (TN)
Source: Beytas, E.M., Debatin, J.F., and Blinder, R.A., Invest. Radiol., 27, 374, 1992. (With permission.)
be used in algorithm validation. Houn et al. [28] and Wagner et al. [29] discuss
issues of ROC study design and analysis in the evaluation of breast cancer imaging
technologies particular to the U.S. Food & Drug Administration (FDA) concerns
but also applicable to the broader scientific community. King et al. [30] present
alternative validation approaches through observer-based non-ROC studies. This
chapter follows the spirit of these latest efforts. It attempts to provide a short, practical
guide through the maze of problems and methodologies associated with the validation of medical-image analysis and processing methodologies in the form of a
summary of the most critical elements of validation and the most “popular” and
“recognized” methodologies in the field. The prerequisite for this chapter is that the
reader be familiar with the basic theoretical concepts of ROC analysis that plays a
major role in medical-image validation studies. There is a vast literature in the field,
and there are several Web sites with free ROC software and lists of related articles
that the novice reader could use to become familiar with the topic [31, 32].
12.3 CLINICAL PERFORMANCE INDICES
The clinical performance of a medical test, including imaging, is usually determined
by estimating indices for the true positive (TP), true negative (TN), false positive
(FP), false negative (FN), sensitivity (SENS), specificity (SPEC), positive predictive
value (PPV), negative predictive value (NPV), and accuracy. In medical imaging,
the response to the question, “Is there a signal in the image or not?” or “Is there
disease present in the image or not?” is given by a human observer or by a computer.
The answer to these questions is often depicted in the terms presented in Table 12.1,
borrowed from signal-detection theory [33].
A TP is a case that is both test positive and disease positive. Test here represents
the outcome of the observer or the computer process.
A TN is a case that is both test negative and disease negative. Test here represents
the outcome of the observer or the computer process.
A FP is a case that is test positive but disease negative. Such case misclassification is undesirable because it has a major impact on health-care costs and healthcare delivery. These cases are equivalent to a statistical Type I error (α).
A FN is a case that is test negative but disease positive. Such case misclassification is undesirable because it leads to improper patient follow-up and missed cases
with disease. These cases are equivalent to a statistical Type II error (β).
Copyright 2005 by Taylor & Francis Group, LLC
2089_book.fm Page 439 Tuesday, May 10, 2005 3:38 PM
Evaluation Strategies for Medical-Image Analysis
439
Sensitivity is the probability of a positive response for the cases with presence
of signal or disease, and it is defined as
SENS =
TP
TP + FN
Specificity is the probability of a negative response for the cases with absence
of signal or disease, and it is defined as
SPEC =
TN
TN + FP
Positive and negative predictive values of radiological tests are then defined as
PPV =
TP
TN
; NPV =
TP +FP
TN + FN
PPV and NPV depend on sensitivity and specificity but are also directly related
to prevalence, namely the proportion of cases in the test population with signal or
disease that is defined as
PR =
TP + FN
TP + FP + TN + FN
The higher the prevalence, the higher the predictive value is. Accuracy depends
linearly on prevalence and it is defined as
ACCURACY = PR × (SENS − SPEC) + SPEC
Accuracy is equal to specificity at 0% prevalence and is equal to sensitivity at 100%
prevalence.
Note that for oncology applications, one needs to be a little more explicit on
what can be considered a positive response because a positive interpretation may be
an interpretation that leads to the recommendation for biopsy or an interpretation
where a suspicious finding is identified and further work-up is requested before
biopsy is recommended. These two definitions lead to different estimates of the
sensitivity, specificity, and predictive values and need to be carefully reviewed prior
to the design of a validation experiment in this field.
A condition that is often considered in medical studies and causes some confusion in their design is incidence, and this is worthy of a brief discussion here.
Incidence is the proportion of new cases in the test population with the signal or
disease of interest. The incidence rate is a smaller number than the prevalence rate
Copyright 2005 by Taylor & Francis Group, LLC
2089_book.fm Page 440 Tuesday, May 10, 2005 3:38 PM
440
Medical Image Analysis
because the latter includes old and new cases having the disease within a certain
period of time (usually one year). The use of incidence or prevalence rate to configure
a study population depends on the study aims, the imaging modality, and the tested
parameters. In CAD validation experiments, the incidence-vs.-prevalence dilemma
may be bypassed altogether by focusing on sensitivity and specificity estimates and
avoiding PPV and accuracy measurements that depend on prevalence.
Validation of medical-image-processing schemes aims at relative or absolute
estimates of one or more of the above indices of performance before and after the
process is applied; sensitivity and specificity are usually the parameters most often
targeted. Theoretically, one should be able to estimate these parameters accurately
for any diagnostic procedure with a sufficiently large sample size. But the latter was
and continues to be the biggest, and often unsurpassable, obstacle in medicalimaging research. For example, a prohibitively large sample size is required to
evaluate the impact of a CAD detection algorithm on mammography’s sensitivity
using standard statistical methods. Specifically, approximately 10,000 screening
mammograms are needed to detect a change in sensitivity of 0.05 caused by the use
of a CAD system, from 0.85 to 0.90, with a standard error of 5% assuming that
breast cancer incidence is 0.5% (i.e., 5 out of 1000 screened women will have breast
cancer) [16]. Similar estimates are obtained for other imaging modalities and processes. Consequently, statistical methodologies such as the ROC type of tests are
highly desirable because they require significantly fewer resources than classical
statistical approaches, and their results can be used to determine the above performance indices. ROC curves, for example, combine (SENS) and (1-SPEC) data in
the same plot for different test cutoff values. Hence, the curves can be used to
establish the best cutoff for a test with variable parameters. The optimum cutoff
depends on the relative costs of FP and FN cases. Accuracy could also be determined
by a single point on an ROC curve. However, accuracy is a composite index (depends
on prevalence) and could generate confusion, as mentioned earlier. So it is better to
be avoided and replaced by sensitivity and specificity indices instead, which are
prevalence independent.
In addition to the sample size, the availability of expert observers to participate
in a study is often another major obstacle in the validation process. Hence, there is
a need for nonobserver validation strategies that could still measure performance
indices without the experts and without large sample sizes. Computer ROC and
FROC are two such methods that will be discussed in more detail in the following
sections.
12.4 NONOBSERVER EVALUATION METHODOLOGIES
Nonobserver evaluation methodologies are primarily used for the optimization and
validation of a computer algorithm before testing its clinical efficacy. They are the
first step toward final development and provide valuable information to the researcher
on the direction of the work and the likelihood of its success. These approaches are
usually low-cost, easy, and fast to implement. They may not yield the higher power
of the observer-based studies, but they provide sufficient information to optimize
the methodology and ensure that the best technique will be tested clinically. The list
Copyright 2005 by Taylor & Francis Group, LLC
2089_book.fm Page 441 Tuesday, May 10, 2005 3:38 PM
Evaluation Strategies for Medical-Image Analysis
441
of techniques presented in this section is by no means comprehensive. It includes,
however, the most commonly used nonobserver methodologies and those that are
accepted for the validation of medical-image analysis and processing schemes. It
should be noted that measurements of the physical image quality parameters, as in
the case of image display or restoration techniques [34], and mathematical error
analysis, as in the case of compression techniques [8], might also be considered as
nonobserver validation techniques. However, these measurements usually precede
the nonobserver experiments described in this section. Physical and mathematical
error analysis is specific to the algorithm and application, and these will not be
discussed in this chapter, the only exception being error-analysis issues pertaining
to the validation of image-segmentation techniques. Image segmentation holds a
major role in medical-image analysis and processing and poses unique challenges
in validation. In this chapter, we will give an overview of these challenges and of
the options and metrics available and commonly used for segmentation validation.
12.4.1 COMPUTER ROC TEST
Computer ROC analysis is an adaptation of the standard observer ROC analysis that
will be discussed in more detail in the following section [26, 35]. In this form, ROC
principles are implemented for the laboratory testing of pattern-recognition and
classification algorithms [27]. Classification schemes usually differentiate between
two conditions such as benign and malignant lesions, diseased and nondiseased
cases, and disease type 1 and disease type 2 cases. Pairs of sensitivity and specificity
indices can thus be generated by adjusting an algorithm’s parameters and setting
conventions on how the numbers of correctly and incorrectly classified cases are to
be determined. The results are plotted as a true positive fraction (TPF) vs. false
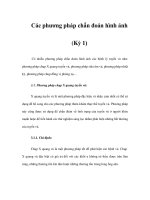
positive fraction (FPF) curve using standard ROC analysis software [32]. Figure
12.2 shows typical computer ROC curves obtained from the preclinical, computer
ROC evaluation of four CAD diagnosis systems that differentiate between benign
and malignant mammographic microcalcification clusters [13, 36].
The global, regional, and local metrics of the standard observer ROC analysis
can also be used to quantify absolute and relative performance in computer ROC
experiments. These metrics include:
The area under the curve (global performance index), which ranges from 0.5
to 1, where 0.5 corresponds to random responses (guessing) and 1 to the
ideal observer [26, 27]. The curves of Figure 12.2 have all areas greater
than 0.9.
The partial area under the curve (regional performance index), which is
estimated at selected sensitivity or specificity thresholds, e.g., 0.9 TPF or
0.1 FPF and provides more meaningful results in clinical applications where
high sensitivity is desirable and needs to be maintained [37]. The partial
sections of the curves in Figure 12.2 at a 0.9 TPF threshold are shown in
Figure 12.3. There is no publicly available software today for estimating
the area under these curves. However, a polygon method [25] or the method
described by Jiang et al. [37] can be implemented for this purpose.
Copyright 2005 by Taylor & Francis Group, LLC
2089_book.fm Page 442 Tuesday, May 10, 2005 3:38 PM
442
Medical Image Analysis
1
0.9
True Positive Fraction
0.8
0.7
0.6
0.5
0.4
0.3
System #1
System #2
System #3
System #4
0.2
0.1
0
0
0.1
0.2
0.3 0.4 0.5 0.6 0.7
False Positive Fraction
0.8
0.9
1
True Positive Fraction
FIGURE 12.2 Computer ROC curves obtained from the laboratory evaluation of four CAD
diagnosis schemes designed to differentiate between benign and malignant microcalcification
clusters in digitized screen/film mammography.
1
0.98
System #1
0.96
System #2
0.94
System #3
0.92
System #4
0.9
0
0.1
0.2
0.3
0.4
0.5
0.6
0.7
0.8
0.9
1
False Positive Fraction
FIGURE 12.3 Partial curves used to estimate the partial area indices of the computer ROC
data shown in Figure 12.2.
Operating points (local performance indices), i.e., selected (TPF, FPF) pairs
that provide insight on the potential clinical impact and benefits of the
method.
12.4.2 COMPUTER FROC TEST
Computer FROC is the laboratory adaptation of the observer FROC analysis, which
will also be discussed in more detail below. Computer FROC is the method of choice
Copyright 2005 by Taylor & Francis Group, LLC
2089_book.fm Page 443 Tuesday, May 10, 2005 3:38 PM
Evaluation Strategies for Medical-Image Analysis
443
100
90
Second Generation
∗
80
∗
∗
True Positive Rate (%)
70
∗
60
∗
50
First Generation
40
30
20
10
0
0
1
2
3
4
False Positives (per image)
5
6
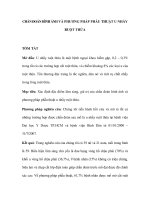
FIGURE 12.4 Computer FROC plots generated to compare the performance of two generations of a CAD detection algorithm for breast masses in screen/film mammography. (Data
provided by Dr. Lihua Li of the Department of Radiology, University of South Florida, internal
report, 2003.)
for the laboratory or preclinical evaluation of CAD detection algorithms. These
algorithms are usually adjusted to provide a TP rate (number of true signals correctly
detected by the algorithm) and a corresponding average number of FP detections
per image (total number of FP detections divided by the number of tested images)
[38]. The plot of TP rate vs. the average FP signals per image gives an FROC curve.
FROC curves differ from the ROC curves in the variable plotted on the x-axis of
the graph, because in this case, we consider the algorithm’s detection performance
on an image-by-image basis. The analysis of the computer FROC data is a relatively
easy and straightforward process. One critical element in the process is the conventions followed for the estimation of the numbers of true and false detections, because
they significantly alter the results [38].
Figure 12.4 shows typical computer FROC curves generated to compare the
performance of two generations of a CAD detection algorithm that performs mass
detection in screen/film mammography [39]. The TP rate is plotted vs. the average
number of FP signals per image. The plots allow the direct comparison of the two
algorithm versions. The better the performance, the higher the curve is and the closer
it is to the upper left corner of the graph, where the ideal performance would be
plotted, i.e., one for which sensitivity or TP rate is 100% with no FP signals per
image.
Copyright 2005 by Taylor & Francis Group, LLC
2089_book.fm Page 444 Tuesday, May 10, 2005 3:38 PM
444
Medical Image Analysis
Both computer ROC and FROC tests require a statistical analysis step at the end
to determine the significance of differences between the ROC or FROC curves.
Common statistical significance tests are the paired or unpaired student’s t-test when
only reader variation is considered, nonparametric tests when only case-sample
variation is considered, and semiparametric multivariate tests when both sources of
variation are considered [40].
12.4.3 SEGMENTATION VALIDATION TESTS
Segmentation poses its own special requirements on validation. Image segmentation
is the process during which an object of interest (organ, anatomical features, tumor)
is extracted from an image and an outline of its area or volume margins is generated
[41]. Segmentation algorithms are usually evaluated with analytical and empirical
methods. The analytical methods examine algorithm design issues and parameters.
The empirical methods evaluate the quality of the segmentation output [42–44].
Udupa et al. [44] distinguish three groups of performance metrics according to
whether they are used to evaluate the precision, the accuracy, or the efficiency of
the segmentation process. Generally, the size, shape, area, or volume of the object
are parameters commonly used to evaluate the segmented outcome. The same parameters also have clinical value because they help in diagnosis, therapy decisions, or
assessment of treatment response. Here, we will only discuss major issues raised by
the empirical methods, as they are the most relevant to the clinical application.
The main requirement to validate a segmentation output is to know the “ground
truth,” namely the true size, shape, or other spatial features of the object of interest.
Such ground truth is an elusive concept in medical imaging because there is no clear
and absolute way to define it. The only, and often the best, option is to have human
expert observers define ground truth by generating manual outlines of the organs,
areas, or objects of interest such as tumors. This process is not only costly and time
consuming, but often biased, incomplete, and inconsistent with significant inter- and
intra-observer variability [45]. Researchers have proposed various remedies to
increase the accuracy and reduce variability of the experts’ ground truth, increase
the speed of the process, and reduce its cost. Using multiple observers repeatedly,
in combinations or independently, is proposed as a way to improve accuracy and
reduce variability [44]. Using trained technicians unsupervised or supervised by
experts has been proposed as a way to reduce the cost of the experts and speed up
the process [45]. Similarly, semiautomated approaches have been proposed where
the expert defines only a few points on the contour of interest, and the algorithm
extrapolates to the full outline under the supervision (or not) of the expert. The
equivalency or superiority of any of these approaches relative to the single “human
expert” has not been demonstrated yet.
An alternative to using clinical ground truth by experts for validation is to use
simulation or phantom studies [46], relative performance measures, or indirect
measures such as the evaluation of segmentation by its impact on the final outcome
that has clinical significance, such as clinical diagnosis or patient-management
decision [47]. Each one of the alternative approaches has its limitations, and none
is generally applicable. Investigators need to generate simulation or phantom data
Copyright 2005 by Taylor & Francis Group, LLC
2089_book.fm Page 445 Tuesday, May 10, 2005 3:38 PM
Evaluation Strategies for Medical-Image Analysis
445
independently if a specific application is to be tested, or use publicly available data
sets from certain imaging modalities if only a segmentation methodology is to be
tested. For the latter, the images and data generated by the Visible Human Project
offer a high-quality, standardized data set [48]. The free set of manual segmentations
of CT images of a male human is another good reference resource [49].
Once a ground-truth file is available, a variety of metrics can be used to validate
the segmentation results [43]. Researchers are supposed to select those that are
particularly suited for the specific application and the way the ground truth was
generated [50–52]. Preferred measures that are relatively easy to compute and not
limited to specific shape patterns include [51]:
1. The Hausdorff distance h(A,B) between two contours of the same object
(tumor), one generated by an expert (A) and one generated by the computer
(B)
Let A = {a1, a2, …, am} and B = {b1, b2, …, bm} be the set of points on the
two contours (each point representing a pair of x and y coordinates);
then the distance of a point ai to the closest point on curve B is defined
as
d ( ai , B) = min b j − ai
j
Similarly the distance of a point bj to the closest point on curve A is defined
as
d (b j , A) = min ai − b j
i
The Hausdorff distance h(A,B) is defined as the maximum of the above distances between the two contours, i.e.,
{
}
{
}
h ( A, B) = max max d ( ai , B) , max d (b j , A)
i
j
2. The degree of overlap OL between the areas G and E encompassed by
contours A and B
The overlap is defined as the ratio of the intersection and the union of the
two areas, i.e., the ground-truth area G and the experimental computergenerated area E
G∩E
G∪E
The ratio is 1 if there is perfect agreement and 0 if there is complete disagreement.
3. The mean absolute contour distance (MACD)
MACD is a measure of the difference between the two contours. To estimate MACD, a one-to-one correspondence between the points of the
two curves is required. Once this correspondence is established, the distances between corresponding points are estimated; their average corresponds to the MACD. In addition to the absolute differences entering
the MACD calculation, the signed distances between the curves can
OL =
Copyright 2005 by Taylor & Francis Group, LLC
2089_book.fm Page 446 Tuesday, May 10, 2005 3:38 PM
446
Medical Image Analysis
also be computed and used to determine the bias of an algorithm or any
regional effects on the segmentation process, i.e., pancreatic areas closer to the liver may be less accurately segmented than areas away from
large organs [51].
The first two metrics are sensitive to the size and shape of the segmented objects
and also depend on the image spatial resolution. The third metric is independent of
object size and image resolution, and it is preferred when an application uses images
from different sources that have different resolution characteristics. We have tested
all three measures for brain tumor segmentations in MRI scans, segmentations of
the pancreas and pancreatic tumors in CT scans, and bone segmentation in computed
radiographs. They seem to offer a reliable, nonobserver validation approach to all
cases where human expert outlines are available as ground truth.
A statistical analysis of the agreement between the measured parameters from
different segmentation algorithms or the agreement between computer and observer
performances is the last segment of the validation process. Computer and expert
data are compared with a variety of statistical tools that are generally applicable and
not unique to segmentation. The most frequently reported ones include: (a) linear
regression analysis to study the relationship of the means in the various segmentation
sets [40, 53], (b) paired t-test to determine agreement between the computer
method(s) and the experts [53, 54], (c) Williams index to measure interobserver or
interalgorithm variability in the generation of manual outlines [51], and (d) receiver
operating characteristic (ROC) analysis and related methods to obtain sensitivity
and specificity indices by estimating the true-positive and false-positive fractions
detected by the algorithm or the observer [26]. In the place of or in addition to these
types of analysis, one could apply the method proposed by Bland and Altman [55],
assuming that the comparison of segmentation data sets is analogous to the problem
of “assessing agreement between two methods of clinical measurement.” In their
famous 1986 paper, Bland and Altman [55] showed that the correlation coefficient
and regression analysis are not appropriate techniques for the comparison of measurement methods when “true” values are unknown. Their “95% limits of agreement”
method offers an alternative and elegant, if not more accurate, approach to what is
usually followed in the medical-image segmentation literature.
We should finally mention the major, publicly available software tools that,
although not comprehensive, provide a valuable resource to the researcher. First, the
VALMET tool allows the estimation of several segmentation metrics, including those
listed above, in two- and three-dimensional data sets [50]. The Insight Segmentation
and Registration Toolkit (ITK) is another free tool that can be used for medicalimage registration and segmentation and statistical analysis. ITK is an open-source
software with widespread use [56]. ITK development is an effort initiated and funded
by the National Library of Medicine (NLM) to support its Visible Human project
[48]. ITK includes several segmentation and registration methodologies and statistical measures, and it has been implemented for a variety of medical-imaging
applications. A third software tool, the 3DVIEWNIX, is developed by Udupa [44]
at the University of Pennsylvania and is available for a fee at g.
upenn.edu/~Vnews/.
Copyright 2005 by Taylor & Francis Group, LLC
2089_book.fm Page 447 Tuesday, May 10, 2005 3:38 PM
Evaluation Strategies for Medical-Image Analysis
447
12.5 OBSERVER EVALUATION METHODOLOGIES
This group of methodologies can be considered as the second stage in a validation
process, a stage that follows laboratory testing and is done only with the optimized
and most promising computer algorithms. In this group, we find the traditional
applications of the ROC family of tests as well as other observer-based methods
that are often faster to execute and of lower cost than the ROC approaches.
12.5.1 ROC TEST
ROC was introduced to medical imaging more than a quarter century ago and is the
current standard in the evaluation of new medical-imaging systems and computer
algorithms, including CAD [31, 57–60]. ROC is based on principles of signaldetection theory, and its name originates from the initial use of the methodology
(identification of radar signals in the military) and actually has no real representation
in its current use in medical imaging. In ROC experiments, a signal of interest may
or may not be present in an image, and the observer uses a rating scale to express
his/her confidence regarding the presence or absence of the signal. ROC measures
the performance of the entire imaging system, including observer, environment, and
imaging conditions. The outcome of an ROC experiment may be considered sufficient, under certain conditions, to prove efficiency or show equivalency of one
diagnostic modality over another and, consequently, the need for conventional prospective clinical trials may be eliminated.
The ROC measurements generate plots of the TP response fraction (TPF) or hit
rate as a function of the observer’s decision criterion or decision threshold or
operating point, which also causes the FP fraction (FPF) or false-alarm rate to
change. A typical observer ROC curve is shown in Figure 12.5. A strict decision
threshold would correspond to the lower part of the curve, and a relaxed decision
criterion would correspond to the upper part of the curve, where higher sensitivity
(TPF) but also higher FPF would be observed. An ideal observer corresponds to a
curve that has 100% TPF and 0 FPF. A chance decision corresponds to an area under
the curve (AZ) of 0.5 (curve becomes a diagonal line) [26].
ROC is used to make comparisons of observer performance between two different observation conditions or parameters, e.g., two different imaging systems
(screen/film vs. digital radiography, MRI vs. CT, or computed vs. digital radiography), two different image formats (original vs. enhanced, original unaided vs. original with CAD, original vs. compressed), or two different tasks (detection of cancer
vs. detection of artifacts, detection of cancer vs. diagnosis of cancer). Here, we focus
on major issues related to the design of ROC experiments for the validation of
medical-imaging technologies and make practical recommendations for the least
“painful” but most meaningful implementation of these tests.
The path to a successful ROC study and meaningful outcome, one that preferably
shows statistical significance, takes us through the consideration of various design
parameters prior to the initiation of the study. ROC design is constrained by practicality. The goal is to design efficient and economical experiments that involve the
minimum possible number of physicians, reading sessions, and cases per session
[61]. Table 12.2 summarizes all factors required to set up an ROC experiment. This
Copyright 2005 by Taylor & Francis Group, LLC
2089_book.fm Page 448 Tuesday, May 10, 2005 3:38 PM
448
Medical Image Analysis
1
0.9
0.8
0.7
TPF
0.6
0.5
0.4
a = 1.15 b = 0.94 Az = 0.7995 Film
a = 1.53 b = 0.95 Az = 0.8667 Softcopy
0.3
0.2
0.1
0
0
0.1
0.2
0.3
0.4
0.5
0.6
0.7
0.8
0.9
1
FPF
FIGURE 12.5 Typical observer ROC curve obtained with the LABMRMC tool of the ROCKIT for a study that involved four readers, 212 four-view mammograms (106 normal, 55
cancer, and 51 benign), and two treatments (film and soft-copy mammography).
list was formed by the author based on an initial idea from Dr. Dorfman (University
of Iowa) and provides a way to ensure that all aspects of an ROC study are addressed
prior to implementation. Specifically, one should:
1. Define clearly the hypothesis and the treatments to be tested.
Here, one should consider whether it is sufficient to show equivalency
or whether superiority of one treatment over another needs to be demonstrated. For example, in testing a CAD algorithm, some aspect of superiority needs to be demonstrated, either relative to the standard of practice
or other application, in order to justify its clinical use. Furthermore, several
treatment pairs can be included in the evaluation.
2. Define the number of observers required to participate in the study in
order to achieve statistical significance and meet power requirements.
Roe and Metz [62] recommended the use of a minimum of five observers based on multireader simulations with continuous ratings. However,
successful ROC tests have been conducted with fewer readers (three or
Copyright 2005 by Taylor & Francis Group, LLC
2089_book.fm Page 449 Tuesday, May 10, 2005 3:38 PM
Evaluation Strategies for Medical-Image Analysis
449
TABLE 12.2
Factors Considered in the Design of an ROC Experiment for the Evaluation
of Medical-Imaging Technologies, Including CAD
Factor
Type of Information
Hypothesis
Treatments
Readers
State hypothesis to be tested
List number and brief description of each
List number and description including subgroups, e.g., a study may use ten
readers from two groups, five from academia and five from the community
List number of cases used in the study and brief description including
breakdown of various case types. For example, an oncology study may use
1000 cases, 500 of which may be negative, 250 benign biopsied cases, and
250 cancer cases. Images may be single views or multiple views.
Discrete (five-point, ten-point), continuous, pseudocontinuous, BIRADS
Data set
Rating method and
scale
Reading protocol
Analysis tools
Performance measures
Presentation setup and
data collection
Sequential, mixed, random, reading schedule (address potential bias issues)
List algorithm to be used for analysis of data, e.g., a study using readers
reading the same cases in both treatments requires the use of MRMC
analysis, but a study using two readers and one treatment requires CORROC2
analysis
Area under the curve, sensitivity, specificity, decision thresholds, confidence
intervals, p-value
Processing and display hardware, software, reporting methodology, forms
(hard copy vs. soft copy)
four). The reason is that the number of readers, reader performance (e.g.,
AZ value), and number of cases (discussed next) are interdependent issues.
Dorfman et al. [63] actually showed that the number of readers is less important than the number of cases or the AZ value, and they avoided specific
recommendations, placing more emphasis on the quality of the readers or
cases. One issue encountered in the selection of readers is reader expertise.
Usually ROC readers have similar educational and professional experiences, unless a large reader population is available from which to select several sufficiently large groups, e.g., five radiology fellows, five junior
radiologists, and five senior radiologists, that will allow generalization of
the results across reader expertise. Depending on availability and other experimental constraints, one might consider a design of matched readers
and matched cases (same readers reading the same cases imaged with different modalities) or matched readers only or matched cases only [59].
3. Define sample size and contents of the data set.
The minimum sample size depends on the anticipated performance and
the number of readers (see item 2). For example, assuming that five readers
will participate in the study and the average expected AZ will be 0.85 or less,
a minimum of 50 positive and 50 negative cases are required [62]. For higher
area values, larger sample sizes should be used [62, 64]. The positive and
Copyright 2005 by Taylor & Francis Group, LLC
2089_book.fm Page 450 Tuesday, May 10, 2005 3:38 PM
450
Medical Image Analysis
negative case definitions depend on the experiment. Positive cases are considered those that contain the “signal” of interest, such as cancer, a disease
type, a fractured bone, etc. Negative cases are usually matched cases with
no signal or with a signal that has different properties than that of the positive cases. For example, negative cases in a classification experiment
might be cases with benign tumors. Some bias issues associated with the
sample size and types are discussed in Section 12.6.
4. Select rating method and scale, e.g., quasicontinuous, discrete five-point,
or discrete ten-point rating scale.
Metz et al. [65] recommended the quasicontinuous rating for optimum
results. Dorfman et al. [63] argued that the discrete or pseudocontinuous
rating scales can be used interchangeably in image-evaluation studies
when AZ is the performance index of interest. Dorfman et al. favored the
discrete rating when operating points as well as AZ were of interest. They
further suggested that, for mammography applications, one can even consider using the classes of the Breast Imaging Reporting and Data System
(BIRADS) of the American College of Radiology for rating, because they
represent actual clinical decision thresholds [63]. The validity of the latter
for ROC experiments is disputed and remains to be shown [28, 66]. Note
that traditional rating scales and ROC analysis methods require the definition of a clear and simple task for the reader, preferably a task that is limited to the detection or the classification of a signal. This is not always
possible or even an accurate representation of the joint detection and classification tasks performed in clinical situations. New observer methodologies are likely to emerge soon that will be able to handle complex clinical
decision processes such as those represented by the BIRADS classes.
5. Select independent or sequential reading modes [67–69].
Because the same subjects or cases are commonly used in the evaluation of imaging techniques, there has been a lot of emphasis on how to
present cases to the readers to eliminate or significantly reduce reading-order effects. Until recently, the recommendations were to change the modality and case reading order as well as interleave a sufficiently large time
interval (4 to 8 weeks) between images from the same patient [67]. Recent
ROC studies of CAD algorithms have suggested that the sequential reading mode, i.e., reading one treatment after the other without a time interval
or order randomization, may be a more sensitive probe of differences between standard and computer-assisted readings than the independent reading mode, where reading-order effects are reduced following the
guidelines above [68]. Although it can be argued that sequential reading is
not appropriate for all imaging applications and evaluation [69], there
seems to be an agreement that it may be beneficial for CAD evaluation, hence
providing a faster, more practical, and more sensitive validation process.
6. Select the appropriate ROC analysis software tool.
We mentioned previously that there are several free software packages
available for the analysis of ROC data [32]. The type of software to be used
depends on the study design. The most popular package is the ROCKIT
Copyright 2005 by Taylor & Francis Group, LLC
2089_book.fm Page 451 Tuesday, May 10, 2005 3:38 PM
Evaluation Strategies for Medical-Image Analysis
451
(current version 0.9.1B) offered by Dr. Metz at the University of Chicago
[70]. This package includes several algorithms that can be used to analyze
single-reader and multireader studies using the same or different cases, i.e.,
independent or correlated data sets, two treatments, and discrete or continuous (quasicontinuous) rating scales. Multireader, multicase studies, for example, should be analyzed with the LABMRMC algorithm [70] or the MRMC
algorithm from the University of Iowa [71]. All of these algorithms perform
individual reader data analysis. Additional data processing is required to generate a pooled instead of an individual ROC curve [61, 72, 73].
7. Select metrics for the estimation of absolute or relative performance and
performance differences.
ROC analysis allows the estimation of various global, regional, and local performance indices, including: (a) the area under the ROC curve, AZ,
(b) the partial area index, (c) the TPF at a selected FPF and vice versa or
sensitivity and specificity pairs, (d) statistical errors and confidence intervals for the differences between treatments, and (e) decision thresholds.
ROC curve fitting is also performed for plot generation.
8. The final step in the design process is the actual implementation and
experimental setup.
One needs to determine the reading environment, e.g., dark room, lightbox conditions, ambient light levels, sitting conditions, length of reading
sessions, film-hanging protocols, and the reporting mechanism, e.g., dictation or manually on forms or computer interface.
For a better understanding of the various factors entering the design of an ROC
experiment, consider the following example often found in the CAD literature of
the last decade. An ROC study is designed to determine the effect of a CAD detection
algorithm on the interpretation of digitized mammograms on computer monitors
(soft-copy digitized mammography). The hypothesis is that soft-copy digitized mammography with CAD detection has higher breast cancer detection sensitivity than
conventional film mammography. The investigators want to display the CAD detection output (segmented areas that correspond to calcifications and masses) on a
computer monitor as an overlay on the corresponding digitized mammogram. So,
there are three image formats and two hypotheses to be evaluated in this experiment:
film mammography, soft-copy digitized mammography, and computer-aided softcopy digitized mammography. The various ROC factors and design parameters for
this experiment are listed in Table 12.3. Although specific to the mammography
example, a similar logic can be followed for all medical-imaging tests.
ROC analysis is probably the most powerful tool we have today for the evaluation
of medical-imaging technologies, including CAD. But ROC has its problems and
limitations, such as:
It requires good ground-truth data for the selected data set that are not always
available in medical imaging or are impractical to generate.
Outcome is sensitive to the data set contents, particularly the subtlety of the
selected cases and how well they represent the general population.
Copyright 2005 by Taylor & Francis Group, LLC
2089_book.fm Page 452 Tuesday, May 10, 2005 3:38 PM
452
Medical Image Analysis
TABLE 12.3
ROC Study Design for the Evaluation of a CAD Detection Algorithm for SoftCopy Digitized Mammography
Factor
Type of Information
Hypothesis
Unaided interpretation of film mammography is equivalent to unaided interpretation
of soft-copy digitized mammography
Computer-aided interpretation of soft-copy digitized mammography is more
sensitive and less variable than standard interpretation of film mammography
Total: 3
Treatment 1: Unaided standard film reading of mammograms
Treatment 2: Unaided soft-copy digitized mammogram reading
Treatment 3: Aided soft-copy mammogram reading with CAD detection overlay for
calcifications and masses
Total: 6
Groups: 2 (three academic and three community radiologists)
Total: 500 four-view mammograms
250 normal with 2 years of negative follow-up
120 benign biopsied cases with calcifications and masses (50/50)
130 malignant cases with calcifications and masses (50/50)
Power of the study is a function of number of readers and data set size; according
to the numbers above, it is expected to detect differences in AZ (δAZ) on the order
of 0.04 with α = 0.05 (Type I error) and β = 0.2 (Type II error)
100-point scale, pseudocontinuous rating of likelihood of presence (100) or absence
(0) of breast cancer
Patients and readers fully crossed with treatments
Readers will read each mammogram in all treatment cells
Reading sessions (1 h) with 20 cases per session
Random mix of cases and treatments different for each reader
Random reading sequence
Time interval (8 weeks) between same cases in different treatments
Highly correlated data, multireader, multicase design
Use MRMC algorithm from UI or LABMRMC from UC
Area under the curve, AZ
Partial area index at TPF of 0.9
Test of difference between treatment means and confidence intervals
Statistical significance at the 0.05 level
Film multiviewer for film display following clinical hanging protocol
Two high-resolution monitors for soft-copy display
Film digitization at 100 µm and 12 bits per pixel
Custom interface for display
Custom interface for electronic reporting and generation of ROC input files for
analysis by ROC algorithm
Treatments
Readers
Data set
Rating method
and scale
Reading protocol
Analysis tools
Performance
measures
Presentation
setup and data
collection
Note: Film mammography was first compared with soft-copy digitized mammography before evaluating
the benefits of the CAD detection algorithm.
Copyright 2005 by Taylor & Francis Group, LLC
2089_book.fm Page 453 Tuesday, May 10, 2005 3:38 PM
Evaluation Strategies for Medical-Image Analysis
453
In some applications, reading-order effects or memory bias may have a
significant negative impact on the results.
There are degeneracy problems when readers do not use the full rating scale.
Studies are costly, time consuming, slow, and complicated.
Methods of analysis can handle only binary decisions (negative vs. cancer,
benign vs. malignant, disease vs. no disease) that are not representative of
the complexity of medical images or of the diagnostic process or even of
the output of CAD algorithms.
Analysis does not differentiate between cases with single and multiple lesions
and whether the observer evaluates the true lesion or not, as there is no
lesion localization involved in the process.
Methodologies developed to address some of the weaknesses of ROC will be
briefly described in the following subsections.
12.5.2 LROC TEST
The LROC methodology was developed originally by Starr et al. [74], but it was
revisited and formalized by Swensson several years later [75]. LROC is not widely
used, probably because the formal statistical analysis came much later than the ROC
one, and it still lacks in robustness. Swensson’s 1998 software package is free but
runs only on Windows 98 and does not have the user-friendly interface of the ROC
packages [32]. This method, however, takes target localization accuracy into account,
compares results with the standard ROC, and estimates similar performance metrics.
LROC experiments are designed in ways similar to the ROC ones. Notable
differences from ROC, beyond the analysis parts, are found in the interpretation
process. In LROC, images may contain one or more targets (lesions or areas of
interest), and each target is localized and rated using a discrete rating scale. The
highest-rated report of a finding on each image is used as the “summary rating” that
represents the entire image in the analysis process [76]. Images with no targets
(controls, benign, or negative cases) are also rated by selecting a single “most
suspicious” area in the image and assigning a low rating (forced localization choice).
We have used this method successfully to evaluate an enhancement and a compression algorithm for digital mammography, where improvements in localization accuracy are an important aspect of the algorithms’ performance [77].
12.5.3 FROC TEST
This methodology was formalized for medical-imaging evaluation studies by
Chakraborty et al. [78, 79]. The acceptance and application of the FROC methodology has also been limited primarily due again to the delay in developing a statistical
analysis procedure relative to the ROC development. However, we now have the
models required to fit the FROC data and lead to measurable outcomes. Notable
differences from ROC in this case include: (a) multiple lesions or areas of interest
can be present in an image, (b) all need to be localized, and (c) a four-point rating
Copyright 2005 by Taylor & Francis Group, LLC
2089_book.fm Page 454 Tuesday, May 10, 2005 3:38 PM
454
Medical Image Analysis
scale is used to rate each one. Furthermore, there is no forced localization choice
here, as there is in LROC. Unmarked images or locations reflect “definitely negative”
decisions.
Dedicated software (FROCFIT) or the ROCFIT program can be used to analyze
the FROC data [79]. Two methods are proposed for handling FROC data, generating
ROC-like curves, and estimating performance metrics: the FROC that uses the
FROCFIT program [78] and the alternative FROC (AFROC) that uses the ROCFIT
program [79]. The methods differ in the way the false-positive data are scored. The
newest one, the AFROC, is recommended because it does not need an assumption
on the distribution of the false-positive detections in an image (FROC assumes a
Poisson distribution).
12.5.4 AFC
AND
MAFC TESTS
The alternative forced choice (AFC) and multiple AFC (MAFC) tests belong to a
family of methods proposed by Burgess [80] as an alternative to ROC for a more
direct and faster measurement of the observer’s sensitivity in medical imaging.
Observers in this case have an easier task than in ROC studies. They are required
to identify a signal (target, lesion, area of interest) that is always present in one of
two (2AFC) or in one of M (MAFC) images or regions of images or alternative
signals. This experiment is generally easier and faster to execute. However, the
interpretation process and the selection and presentation of the data are critical
elements in these studies and should be carefully considered [80].
It has been shown that an AFC study could provide the same power as an ROC
study for a certain sample size and number of participating readers (usually twice
as many are required for equivalent results). The outcome of an AFC study is easily
correlated with clinical experience, as the only measured indices of performance are
related to detectability and to TP and FP rates. An MAFC experiment is particularly
well suited for studying signal detectability with synthetic or simulated data in a
wide range of signal-to-noise ratios [80].
12.5.5 PREFERENCE TESTS
Preference tests are non-ROC, observer-based experiments that may be highly sensitive to performance differences, easy, and fast to implement at relatively low cost
despite the fact that inter- and intraobserver variability necessitates that these studies
involve multiple observers and large, representative data sets. Preference tests are
useful in selecting a modality or a CAD scheme to be tested further with an ROC study
or to set the boundary conditions at which it makes sense to perform an ROC study.
There does not seem to be a formal statistical approach or theory that is termed
“preference methodology.” The name was probably selected by the medical-imaging
community to indicate observer studies where the reader selects or rates an image
or setup or process from a group of similar images, setups, or processes [81–85].
Terms such as “visual grading analysis” and “observer preference analysis” are often
used in preference studies that measure observer performance in relation to image
quality [86, 87].
Copyright 2005 by Taylor & Francis Group, LLC
2089_book.fm Page 455 Tuesday, May 10, 2005 3:38 PM
Evaluation Strategies for Medical-Image Analysis
455
Several approaches are reported in the literature for rating signal detectability
or ranking overall image quality. They include: (a) multipoint-rank-order studies,
(b) just-noticeable-difference studies, (c) rating-scale studies, (d) forced-choice studies where the best of two or more images is selected, and (e) method of paired
comparisons. The latter method was the subject of much study in the 1950s and
1960s [88] but seems to have been largely concluded by the mid 1970s, with the
last publication appearing in 2001 [89].
Few of the reported studies include a detailed statistical analysis or provide a
quantitative evaluation of the data. Depending on the hypothesis, design, number of
participating readers, and database size, various statistical tests may be applicable,
including: (a) the Friedman two-way nonparametric test for N observations [85], (b)
the Wilcoxon’s signed rank test to assess pairwise comparisons of the various images
or processes [85], (c) Kendall’s coefficient of consistence, coefficient of concordance,
and rank correlation coefficient [87], (d) student’s t-test and confidence intervals to
assess significance of results [84], and (e) student-Neuman-Keul’s test to determine
the significance of the differences between mean scores [86].
There seems to be sufficient statistical basis in “preference studies” to suggest
that such tests can be used in the evaluation of medical-image-processing methodologies and CAD. We certainly gain by the speed and simplicity of the execution
of these studies. However, a good statistical analysis needs to accompany the study
that will provide good quantitative assessment and not merely qualitative or anecdotal observations.
12.6 STUDY POWER AND BIASES
In this section, we will look in more detail at issues affecting the power of a study
and issues that might bias the measurements [90, 91]. These are also the issues most
frequently argued upon and the “softest spots” in the development and validation of
medical-imaging methodologies that routinely receive the heaviest criticism. The
reasons may be that several validation aspects are truly controversial, several succumb to serious logistical and pragmatic constraints, and several suffer from a lack
of standards. It is probably fair to say that it is impossible to design a study with
everyone’s “seal of approval.” There are probably as many views on medical-imaging
validation as there are researchers in the field. The imaging scientist, however, should
carefully consider and openly discuss all aspects of a study, its strengths and,
particularly, its weaknesses. In this section, we assume that the researcher is past
the definition of the study and its objective, the decision on the hypothesis to be
tested (i.e., equivalence or superiority or other), the selection of validation methodology and analysis tools, and the planning for timetable, funds, and effort and is
now faced with the logistics of the experimental plan before actually executing the
plan. In this case, the following need to be addressed:
Database generation
Algorithm training and testing and database effects
Estimation of performance parameters and rates
Copyright 2005 by Taylor & Francis Group, LLC
2089_book.fm Page 456 Tuesday, May 10, 2005 3:38 PM
456
Medical Image Analysis
Presentation setup
Statistical analysis
Each of these topics is discussed in the following subsections.
12.6.1 DATABASE GENERATION
The database generation may be labeled as the hottest topic in validation and covers
areas such as the content, the size, the case type and representation, the usage in
development, the ground truth, the documentation, the quality, the standardization,
and more [92–95]. The power and significance of a study is directly linked to the
database, and measurements can be seriously biased if the sample size is not properly
developed.
12.6.1.1 Database Contents and Case/Control Selection
Some issues to consider: common databases vs. individually generated databases;
the dilemma of representation and quality control; difficult vs. easy cases; negative
only and cancer only as done by the commercial CAD companies [96]. Using only
negative and cancer cases seems to have a favorable bias on the outcome. See, for
example, what happens in the performance of the commercial CAD systems when
benign cases are included. Description of contents helps communicate with other
researchers in the field and allows comparisons. The use of histograms to represent
the range of lesion sizes and contrast, for example, has proven useful in mammography [92, 93]. As we go beyond images and include nonimage, demographic, and
clinical information in our development, a description of these factors will become
necessary. Histograms may still have a role in the description of a database’s contents.
How do we match cases and controls, i.e., normal and abnormal cases? Do we
match them by image appearance only or by patient demographics as well. Until
now, we were focused on the images, but as we move beyond images, matching
demographics may be another thing to consider.
12.6.1.2 Database Size and Study Power
We previously discussed the experts’ recommendations on the sample size required
for ROC studies. ROC recommendations were a function of area AZ. They are also
a function of the correlation of the data. The recommended sample sizes should be
considered as general observations that may not hold true for a specific experiment.
To quote Dr. Berbaum at the University of Iowa and an authority on ROC methodology: “For ROC studies, it is often not very helpful to worry about how much
power you have — I have never had as much as I wanted. Simply collect as much
data as possible.”
For non-ROC studies, there are several options for estimating sample size.
Almost all require that the following parameters first be defined for a two-treatment
evaluation [40]:
Copyright 2005 by Taylor & Francis Group, LLC
2089_book.fm Page 457 Tuesday, May 10, 2005 3:38 PM
Evaluation Strategies for Medical-Image Analysis
457
Statistical significance level, α, or Type I error, or FP rate
Power (1 − β), or Type II error, or (1 − FN) rate
Treatment 1 performance or effect
Estimate of treatment 2 performance or effect
Estimate of standard deviation, if dealing with means and treatment differences.
For most studies, α = 0.05 (or 5% significance level) and β = 0.2 (or 80% power).
Treatment 1 is the standard of practice and treatment 2 is the new methodology that
will be tested against the standard. For a study in lung cancer imaging, for example,
treatment 1 might be chest radiography and treatment 2 helical CT imaging. For
breast cancer imaging, treatment 1 might be mammography and treatment 2 mammography with CAD. The effect of treatment 1 is usually found in the clinical
literature. The effect of the new treatment 2 is estimated either from pilot studies or
by defining a clinically important effect. The latter can be estimated by considering
the effect required to change the current clinical practice. Remember that justification
is necessary. Simply stating a desired effect is not only insufficient, but also risks
being unrealistically high and could lead a study to failure. Based on the five
parameters above, tables or standard statistical equations or software can be used
for sample size estimates [97].
12.6.1.3 Ground Truth or Gold Standard
We have already discussed this issue with respect to the requirements of imagesegmentation validation. Detection and classification algorithms, however, have
slightly different requirements, and they may not always need an outline of the area
of interest, as does segmentation. Generally, ground truth in medical imaging is
established by:
Clinical proof that includes image information from radiology (may be single
or multimodality imaging), clinical information from laboratory and clinical
examinations, and pathology information from biopsy reports.
Opinion of the expert(s) participating in the study. If a panel of experts is
used, ground truth may be established by relative decision rate or majority
rule or consensus among the experts.
Opinion of expert(s) not participating in the study. This can be done before
the study as a review or after as a feedback to the overall process.
12.6.1.4 Quality Control
The implementation of a quality control program is necessary to ensure that database
generation conforms with generally accepted standards, that digitized or digital
images are of the highest quality, that artifacts during image acquisition or during
film digitization are avoided, and that the same image quality is achieved over time.
Film digitizers pose the greatest challenge in database generation. Test films and
phantom images can be used to monitor image quality and ensure high-quality data
for further processing [98].
Copyright 2005 by Taylor & Francis Group, LLC