Measuring in Injection Molds
Bạn đang xem bản rút gọn của tài liệu. Xem và tải ngay bản đầy đủ của tài liệu tại đây (481.69 KB, 9 trang )
16
M e a s u r i n g
16.1
S e n s o r s in
in I n j e c t i o n
M o l d s
Molds
Crucial to the quality of injection moldings is the state of the melt after plastication and
how the mold-filling process went, which is characterized by the change in pressure and
temperature.
It is therefore advisable to incorporate appropriate sensors into the molds for monitoring and perhaps control purposes.
On the other hand, installing them incurs additional costs, could even leave marks on
the moldings to be made, and could possibly make mold changing difficult. Moreover,
the cooling channels and the ejector units take up considerable space, with the result that
there is limited choice as to the best place to install them.
For these reasons, it is not standard practice to measure melt temperature in production
molds. However, pressure measurements in molds are being used more and more to
monitor production (for documentation and scrap monitoring) and are a prerequisite for
pressure-dependent switching and for controlling the pressure in the mold [16.1].
16.2
Temperature
Measurement
16.2.1 M e a s u r i n g M e l t T e m p e r a t u r e s in M o l d s U s i n g IR
Sensors
The thermocouples and resistance thermometers used to measure and control mold wall
temperatures are unsuitable for measuring melt temperatures (these are discussed in
Chapter 18: Temperature Controllers for Injection and Compression Molds).
Melt temperatures are measured by methods that detect the inherent radiation emitted
by the melt in a defined wavelength range.
To this end, a bundle of optical fibers is installed inside the mold, flush with the wall.
The inherent radiation emitted by the melt is fed to a radiation-sensitive detector. The
electrical output signal from the detector then correlates with the melt temperature.
The radiation emitted to the environment by a body as a result of its temperature
depends on its emission power. Ideal blackbody emitters emit all their heat, i.e., they
have an emission power of 1. Real bodies have a lower emission power, the amount of
radiation emitted being reduced by the amounts lost through reflection and transmission.
Polymer melts inside a closed mold behave almost like ideal blackbodies since the
reflected and transmitted radiation emitted from the cavity surfaces impinge on the IR
sensor. This is why plastics that have an emission coefficient of 0.9 in air have emission
coefficients of 0.99 in molds [16.2-16.4].
Melt temperatures inside molds can therefore be measured with high precision (±1%
of the display value) and speed (response time < 10 milliseconds) and with high
reproducibility using optical fibers connected to IR measuring devices. The
measurement ranges depend on the wavelength of the optical fiber, lying between 70
and 260 0 C, and between 177 and 427 0C [16.2].
16.3
Pressure
Measurement
16.3.1 Purpose of Pressure M e a s u r e m e n t
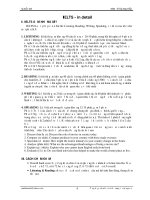
Figure 16.1 illustrates the change in pressure within a cavity and the properties of the
finished part that are affected by it. The shape of the filling phase has a major influence
on the texture of molding, the degree of orientation, the level of crystallinity in the layers
close to the surface, and thermal and mechanical stress on the melt.
Complete filling of the contours of a mold cavity, along with the occurrence of flash
and possible resultant mold damage depend on how the pressure changes as it rises in the
compression phase.
During the holding-pressure phase, the weight and shrinkage of their molding is
determined. Just as in the filling phase, the degree of crystallization and orientation of
the macromolecules in the inner regions of the molds can be affected here.
16.3.2 S e n s o r s for M e a s u r i n g M e l t Pressures in M o l d s
Filling
Completeness, shaping of contours,
flash formation, mold damage
Composition of surface
layer
Appearance, orientation,
crystallinity
Compression longitudinal
flow path
Vod
i s sink marks,
shrinkage, distortion,
degree of crystallization,
orientation in the interior,
demolding problems
Stress on the melt
(thermal, mechanical)
Temperature
distribution
A Filing phase
Figure 16.1
B
C
Compresso
i n phase
Holding pressure phase
TIME
How change in pressure affects quality of finished parts
Pressure in the mold
The informativeness of the change in pressure inside the mold depends primarily on the
position of the installed detector. The pressure sensor measures the pressure during the
injection phase, as soon as the flow front passes over the point of installation and
throughout the holding-pressure phase until the molding shrinks so much at the point of
installation that it loses contact with the cavity. For this reason, pressure sensors should
Compression
at the site of
D measurement
be installed close to the gate as the change in pressure measured there best describes
molding formation for the longest possible period. A position close to the gate is also
recommended for any intended measures to control the change of pressure inside the
mold.
To measure the degree of filling, by contrast, installation away from the gate is best.
Therefore, it would be better to position the pressure sensor away from the gate in the
case of molds that have very long flow paths or that tend to overpack away from the gate.
A range of different designs based on piezoelectric and strain gage detectors are
available for direct and indirect measurement of internal mold pressures [16.2, 16.5].
16.3.2.1 Direct Pressure Measurement
Adjust
In the direct method of measuring internal mold pressure (Figure 16.2), the hole for the
detector is bored right into the cavity such that the head of the detector is in contact with
the melt.
The head is shaped as a piston or membrane. It transmits the pressure to the measuring
element behind it. The head of pressure detectors fitted with a piston can be machined
and shaped within certain limits to the contour and texture of the cavity.
Piezoelectric pressure detectors return a charge signal proportional to the mechanical
load that is transformed in a downstream amplifier into the corresponding voltage.
Even in the most unfavorable measurement points, system drift by the analyte signal
is better than 0.5%/min. Moisture and contamination of the feed lines can exacerbate the
drift and it is absolutely vital to keep them clean or clean them as necessary [16.5].
Figure 16.2 Direct measurement of cavity
pressure with the aid of a piezoelectric
pressure sensor [16.2]
Piezoelectric measuring systems are only suitable for making dynamic and quasistatic measurements and they must therefore be brought into a defined state before every
measurement. This can be effected automatically by a signal from the machine control
(e.g., "Move forward") prior to the start of injection.
Piezoelectric pressure detectors feature high accuracy and linearity (< ± 1% of
measuring range) and a low temperature drift (< ± 0.01%/°C); common measuring
ranges extend up to 200 MPa at 200 to 350 0C (depending on model) [16.5].
Strain gage detectors (working on the principle of a change in resistance) cannot attain
the same high threshold frequencies as piezoelectric detectors but their dynamic
behavior is totally adequate for measuring very rapid changes in internal pressure during
the mold filling process. On account of their measuring principle and construction, they
are suitable for both static and dynamic measurements. Resistance changes brought
about by temperature changes in the strain gage elements are compensated because the
entire measuring chain, consisting of pressure detector and amplifier, is automatically
calibrated before each measurement. Again, this is effected by means of a signal from
the machine control prior to the start of injection (see above). The overall error arising
from measurements with strain gage detectors is < ± 1% of the measuring range, and
temperature drift varies according to model from ± 0.02 to 0.04%/°C; common
measuring ranges extend up to 150 MPa at 200 0C [16.2].
16.3.2.2 Indirect Pressure Measurement
Additional marks in the molded part can be avoided by using sensors for indirect
measurement of the melt pressure placed under ejector pins that are already present
anyway. The analyte parameter is the force acting on the ejector; the diameter of the
ejector is used for calculating the cavity pressure (Figure 16.3).
During mold construction and installation, a good fit of the ejector pins is necessary
to ensure that the measurement is not falsified by frictional forces.
There are two types of design; one is bolt-shaped with piezoelectric or strain gage
elements. If the pressure is monitored only during mold proving and not continuously,
the sensors can be removed and replaced by "blank sensors" [16.2, 16.5].
The data of the sensor for indirect pressure measurement correspond to the data of the
sensor for direct pressure measurement.
Figure 16.3 Sensor with piezoelectric or DMS element [16.2]
The data quoted for measuring accuracy, temperature dependency and response time,
just like those concerning measuring ranges and service temperatures are guide values;
the manufacturer's instructions must be observed each time.
16.4
U s e of S e n s o r - T r a n s d u c e r
Probes
The sensors described can be used for various processes associated with production.
These can be divided into process-optimizing and quality-monitoring mechanisms.
16.5
Process
Optimization
Optimum machine setting parameters are crucial to the quality of the molded parts.
Optimum process control entails minimizing cycle times and increasing the service lives
of machines and molds. It is often not enough to just consider process parameters on the
machine side as a means of optimizing the injection molding process. This is because
this approach fails to take account of the filling behavior of a mold, for instance,
viscosity fluctuations of the raw material, and changes in ambient conditions such as
shop temperature and humidity. The more sensors which are fitted to the mold, the more
information that can be gained from the production process.
The most useful information about the process of molded-part formation can be
obtained from measuring the mold cavity pressure. Optimizing the shape of this process
curve can greatly influence molded-part properties such as dimensions, weight, and
internal properties, as well as cycle times and mold wear. The measurements also help to
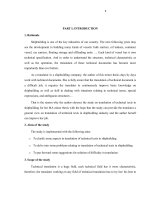
speed set-up when molds are used on different machines. Figure 16.4 illustrates various
cavity-pressure curves. Of most interest is the linear rise in the mold cavity pressure,
synonymous with virtually constant flow front speed [16.11] during injection (e), the
switch-over phase from the speed-controlled injection phase to the pressure-controlled
holding-pressure phase (n) and the duration and value of the holding pressure.
Figure 16.4 shows pressure curves that are obtained when the switch-over point in the
mold is altered. Switching too late from the injection to the holding-pressure phase (1)
causes the cavity pressure to peak and may lead to overpacking of the cavity, demolding
difficulties and damage to the mold, while switching too early may cause the cavity to
be filled under holding pressure (2). Incompletely filled molded parts and a high level of
orientations are the result. The optimum cavity-pressure curve has neither peaks nor
pressure breaks (3). With the aid of the cavity pressure sensor, the optimum point can be
determined rapidly. Similarly, the gate-sealing point, the point when the gate is frozen
and no more material can be transported into the mold, can also be determined and the
holding-pressure time adapted. The residual cooling time is the time elapsed until the
molded part detaches from the mold and is equivalent to the time when the mold cavity
pressure has reached the zero limit. The whole process can be recorded by placing the
mold-cavity pressure sensor close to the gate. The farther the sensor is located away from
the optimum position, the less information is obtained about the process.
Aside from manual corrections to the molded-part formation processes performed
with the aid of cavity-pressure curves, modern injection-molding control units offer the
possibility of using the cavity pressure to switch over from the injection to holding
phase. Once a threshold value is exceeded, a corresponding signal is transmitted. This
switching process makes for greater reproducibility. Above all, it allows for fluctuations
Switching too late
Pressure peaks
- Demolding problems
- Flash
- Orientation
Cavity pressure pwi
Zeitt
(2)
Cavity pressure pwi
Cavity pressure pwj
(1)
Switching too early
Filing under holding
pressure
- Sink marks
- Surface flaws
- Orientation
Timet
(3)
Idea! switching
(e)
Timet
Figure 16.4 Change in pressure at different
switching points
in metering. The threshold value must be determined iteratively in trials or with the aid
of simulations. Automatic determinations can be made by measuring the change in
pressure on-line [16.5, 16.12]. The significant rise in the pressure change serves as the
criterion for the determination and the switch-over point from the injection phase to the
holding phase is made during the cycle. This process allows the system to respond
automatically to fluctuations in materials or the process, without the need for external
intervention.
After the mold-cavity pressure, which is the most relevant process parameter during
injection molding, temperature measurements may be used to obtain further important
information for optimizing and stabilizing injection-molding production. Infrared
sensors for measuring the temperature in front of the screw provide information about
the actual melt temperatures and uncover possible processing errors due to specification
limits that have not been observed. The temperature that has been preset for cooling
systems or measured and depicted describes the temperature of the cooling medium as it
returns from the mold to the machine. The actual mold-wall temperature, however, can
only be measured with the aid of thermocouples mounted just beneath the mold wall in
the mold. Recording these temperatures allows not only non-observed specification
limits to be identified and compensated but also dynamic process changes, such as
improperly set controllers and ambient influences.
16.6
Monitoring Quality
High quality demands imposed on injection-molded parts require intensive testing by the
molded-parts manufacturer. Statistical process control (SPC) is standard in companies
and uses random samples to make inferences about the process level or quality level and
to identify trends in production. The constantly rising demands on injection-molded
products and the random controls of SPC frequently make continuous quality control
monitoring (CQCTM) unavoidable. Sensors in the mold and machine are used to effect
on-line monitoring. The goal is to calculate quality properties direct from the measured
process parameters, such as cavity pressure and temperature. This provides the
Process knowledge
Design of experiments
Conducting of experiments
Changes in process curves
Molded part quality
Charact. parameters
Statistical analysis
Process optimization
Poor
Good
On-line process monitoring
Figure 16.5
Sequence of steps for setting up process models for monitoring quality
possibility of performing a 100% quality control without the need to examine each and
every molded part.
The key to the quality calculation is a model that describes the dependencies of
molded-part properties and process parameters. The approach for determining such a
model is illustrated in Figure 16.5. Starting from existing knowledge of the process, such
as that of a machine setter, a statistical experimental plan is drawn up in which
alterations to machine settings are set out during trials to be conducted. Statistical
experimental design makes it possible to design trials efficiently and to gain a great deal
of information from technical processes with a low number of experiments.
In injection molding, process parameters are recorded during the trial phase on the
machine and the molded parts produced are removed and labeled so that clear classification of trial parts and measured process parameters is ensured during the modeling
phase. When the trials are over, the quality characteristics of the produced molded parts
are determined.
Modeling of the interdependencies of the quality characteristics and process parameters is performed off-line. Mostly, statistical methods are used as models. The choice
of regression to use depends on the type of quality characteristic to be evaluated.
Continuous characteristics, such as weights and dimensions, are evaluated with multiple
regression calculations. Logistic regression is used for describing the dependencies of
attributive characteristics. This group of quality characteristics includes those which can
only be subdivided into classes, such as "Characteristic present" and "Characteristic
absent". Burns and sink marks numbers are among these. Increasingly, statistical
methods are being replaced by algorithms from research areas of artificial intelligence,
such as neural networks. These have the advantage of being easier to apply since the
relationships between process parameters and quality characteristics can be learned
independently [16.13, 16.14].
With the aid of the models created, the quality of molded parts can be calculated online during injection molding from the process parameters measured during the
production cycle. Thus, as soon as the cycle is over, information is available on the
product just made. This can be used to aim for 100% quality documentation and establish
a "reject route" for molded parts that fail to meet specifications.
References
[16.1]
[16.2]
[16.3]
[16.4]
[16.5]
[16.6]
[16.7]
[16.8]
[16.9]
Recker, H.; Spix, L.: MeB-, Steuer- und Regeleinrichtungen. In: Johannaber, F. (ed.):
Kunststoffmaschinenfiihrer, 3rd Ed., Carl Hanser Verlag, Munich, Vienna, 1992,
pp. 1123-1180.
Company brochure, Dynisco Gerate GmbH, Heilbronn.
Wittemeier, R.: Temperaturmessung im Schneckenvorraum einer SpritzgieBplastifiziereinheit mit Infrarotsensoren, Study report, Univ. GH, Paderborn, 1990.
Bluhm, R.: Methoden zur Bestimmung der Massetemperatur - Infrarotsensoren und
miniaturisierte Thermoelemente, Paper presented at the 17th Tooling Conference, IKV,
Aachen, 1994.
Company brochure, Kistler Instrumente AG, Winterthur, Schweiz.
Sarholz, R.; Beese, U.; Hengesbach, H. A.: ProzeBfiihrung beim SpritzgieBen, IKV, 1977.
Stitz, S.: Konstante Formteilqualitat beim SpritzgieBen durch Regeln des WerkzeugDruckverlaufs, Kunststoffe, 63 (1973), 11, pp. 777-783.
Rorick, W.: Zur Praxis der ProzeBregelung im Thermoplast-SpritzguBbetrieb,
Dissertation, RWTH, Aachen, 1979.
Sarholz, R.: Rechnerische Abschatzung des SpritzgieBprozesses als Hilfsmittel zur
Maschineneinstellung, Dissertation, RWTH, Aachen, 1980.
[16.10] Hellmeyer, H. 0.: Ein Beitrag zur Automatisierung des SpritzgieBprozesses, Dissertation,
RWTH, Aachen, 1977.
[16.11] Lauterbach, M.: Ein Steuerungskonzept zur Flexibilisierung des ThermoplastspritzguBprozesses, Dissertation, RWTH, Aachen, 1989.
[16.12] Bader, C : Die Bedeutung der WerkzeuginnendruckmeBtechnik beim SpritzgieBen.
Reprint at the conference on: Qualitatssicherung und -optimierung beim SpritzgieBen,
IKV, Aachen, 1997.
[16.13] Gierth, M. M.: Methoden und Hilfsmittel zur prozeBnahen Qualitatssicherung beim
SpritzgieBen von Thermoplasten, Dissertation, RWTH, Aachen, 1992.
[16.14] Schnerr, O.; Vaculik, R.: Qualitatssicherung mit Neuronalen Netzen. Paper presented at
the 18th Tooling Conference, IKV, Aachen, 1996.