Phát hành cổ phiếu bổ sung (seos) – bằng chứng tại thị trường chứng khoán việt nam. seasoned equity offerings (seos) evidence in vietnamese stock market
Bạn đang xem bản rút gọn của tài liệu. Xem và tải ngay bản đầy đủ của tài liệu tại đây (423.04 KB, 22 trang )
MINISTRY OF EDUCATION AND TRAINING
UNIVERSITY OF ECONOMICS HO CHI MINH CITY
DINH THI THU HA
SEASONED EQUITY OFFERINGS
EVIDENCE IN VIETNAMESE STOCK MARKET
Specialization: Finance – Banking
Specialization code: 62340201
DOCTORAL THESIS SUMMARY
HoChiMinh City – 2016
1
CHAPTER 1
INTRODUCTION
1.1
Research motivation:
Seasoned equity offerings (SEOs) draw enormous attention from researchers around the world. This method is
an effective and popular way to expand company financial resources to maintain and develop its activities, to
reconstruct capital and stakeholder structure of company.
Besides, a trend of increasing international equity issuance has also been reported, especially after the financial
crisis in 2010. The paucity of literature and case study in emerging market where results are inclusive also urge a
solution. Therefore, examining emerging economy case attracts the interest to fill the research gap and
emphasize the own nature of this market. In additional, examining whether the results of developed markets can
be carried over to emerging market also becomes appealing.
The development and new trend in financing resources of Vietnamese Stock market also become a driving force.
Besides, Vietnamese stock market gradually becomes more attractive to foreign investors.
In addition, SEOs gradually become more appealing to Vietnamese companies. However, there is lack of study
investigating thoroughly behavior of listed companies in regarding of why Vietnamese companies conduct SEOs
and market reaction around event day when information about SEOs by dividend or rights are publicized.
Therefore, limited number of SEOs literature in the context of Vietnam should be increased to fill this empirical
gap.
1.2
Research objectives
We examine SEOs in Vietnam on two aspects:
Company’s SEOs motivation by examining why do Vietnamese companies conduct SEOs.
Market reaction to company’s SEOs by examining market reaction to company’s SEOs, which
express through the fluctuations of stock prices. Subsequently, we develop the estimation model
to measure to what extend the theories mentioned in previous SEO studies can be applied to
explain market reaction to companies SEOs in case of Vietnam stock market.
Furthermore, we then compare our findings with existing literatures.
1.3
Research scope
This research covers only companies listed on the HOSE during 2007 – 2013. Stock prices are collected from
HOSE website.
Research sample comprises companies conducting their SEOs as right distributions; or rights accompanied with
dividends; or rights accompanied with bonuses; and companies issued their SEOs as bonus or dividend
payments.
The event days include announcement day and ex-right day which are widely publicized on the media.
SEOs companies are classified according to three criteria (market capitalization, issuance method and industry).
1.4
Research methods:
To examine the behavior of listed companies to SEOs decisions, we apply logit/probit model to find the
determinants of company motivation to issue SEOs. Based on the interpreted results, we will suggest relevant
recommendation for investors and SEOs companies.
To examine the behavior of investors, we first apply the Event study method to study the market reaction
around event day, then using random effects and fixed effects model on panel data to investigate determinants
of market reaction around event day then point out relevant suggestions for stakeholders.
2
RESEARCH METHODS
Company’s SEOs motivation
Why do Vietnamese companies conduct
SEOs?
Market reaction to company’s SEOs
How does market react to company’s
SEOs
The extent of SEO theories application
into Vietnamese stock market
Quantitative method
Quantitative method
Logit/probit model on STATA
Event study method.
Random effects/Fixed effects models
for panel data on STATA.
Results interpretations.
Results interpretations.
Conclusion and relevant policy suggestions.
1.5
Research contributions:
Contribution to SEOs literature:
We investigate SEOs using data from Vietnamese market which has not been examined yet. We refer to SEOs
literature in both developed and other emerging markets to form the research hypotheses then examine whether
the results of those markets can be carried over to Vietnam.
In addition to the out-of-sample tests, this research also fills the gap and enriches the literature on cases of
emerging market where the results are inclusive and very limited, from then to draw an overall picture in
comparison to developed markets, which have been wildly discovered
Contribution to empirical study:
With this research, we fill the gap about SEOs research and contribute an empirical study since it enrich
existing literature of SEOs in Vietnam. Investors, SEOs companies can use this research as a reference material
in their trading, investment and management activities toward information management, making trading
decisions. Investors could consider trading stocks of SEOs companies to earn profits, reserve money in advance
to “catch the issuance”, or to have relevant actions toward these kind of SEOs.
Market legislators can consider using this research as a way to test the level of information transparency in the
market to take relevant actions toward the current market situation.
We investigated different issuing method such as to increase company capital by equity rights or to pay
bonuses/dividends with the latest data set. Comparing of those two methods will provide more evidence in the
field of SEOs in Vietnam, which can be used as reference or studying material for students.
3
CHAPTER 2
LITERATURE REVIEW AND HYPOTHESES DEVELOPMENT
2.1 Introduction
SEOs play significant role on company capital structure as well as stakeholder structure. This
chapter presents different studies about SEOs in both developed as well as emerging markets.
Theoretical investigations cover main theories regarding SEOs including Trade-off; Agency
problem; Growth opportunities; and Market timing.
2.2 Theoretical literature on SEOs
2.2.1 Trade-off theory
According to trade-off theory, company will try to aim at a target debt level to form an optimal
capital structure then gradually move towards it. This theory suggests that managers need to
make right decision on building financial structure to keep balance as well as optimize the equity
and liability in the company. The optimal debt-equity structure in a company can be determined
by trading off the costs and benefits of financing through debt and equity. According the tradeoff theory, company conducts SEOs to optimize capital structure to balance the benefit and
expense that might be generated from debt borrowing (Modigliani and Miller, 1958, 1963;
Myers, 1977).
Trade-off theory has been testified by some empirical research as one of the theories affect
company’s SEOs decisions (Marsh, 1982; Hovakimian et. al., 2001; Bo et. al., 2011).
Hovakimian et. al., (2001) show that when companies adjust their capital structure, they tend to
move toward a target debt ratio that is consistent with theories based on tradeoffs between the
costs and benefits of debt. On the other hand, Bo et. al. (2011) investigate the relevance of
traditional theories Chinese SEOs motivation. With the case of 1081 Chinese SEOs during
1994–2008, the authors find that the trade-off theory is consistent to Chinese listed companies
who strongly depend on loan borrowings from the banking sector because of weak debt market.
Borrowing companies are under strictly bank monitoring, which means their main concern is
borrowing costs.
2.2.2
Growth Opportunities Theory
The availability of growth opportunities is one of the main reasons encourage companies to issue
equity. Company with growth opportunities favors equity financing over debt financing to deter
the transferring of wealth from shareholders to debt holders (Myers, 1977). The mechanism of
the wealth transfer from shareholders to debt holders exists due to the assumption that company
will decide to bypass projects with positive net present value (NPV) if it has to finance those
projects by risky debts. When firms finance new projects with debts, shareholders have to bear
almost the entire cost in case of projects failure since debt holders own priority claims in the
firm assets. Besides, the project success will raise the debt value (Huang, 2012). Furthermore,
companies will face future cash flow insecurity, which leads to financial health warning if they
invest in high uncertainty growth projects. Therefore, companies with more promising
opportunities have more tendencies to issue equity to buffer against any potential financial
constraints that might result from debt financing (Bo et. al., 2011).
Jensen (1986) argues that high growth rate companies with better projects will more concern
about overinvestment risk than bankruptcy risk, therefore they will choose equity financing as
optimal option. On contrary, Jeanneret (2003) states that mature companies who have more free
4
cash flow and capacity of debt borrowing prefer debt financing to monitor and encourage
managers’ role in company.
2.2.3
Market timing theory
The theory of market timing suggests that the time of stock price overvaluation on the market
will encourage managers to issue SEOs instead of other financing methods. This will reduce the
cost of companies while bring more benefit to current stakeholders regardless of new
shareholders; therefore, SEOs decision will be related to mis-valuation proxies (Elliott et. al.,
2008)
According to market timing theory, managers will exploit window of opportunities when
information asymmetry is at the lowest level. Korajczyk, Lucas and McDonald (1990) show that
information asymmetry among internal and external investors is not fixed, therefore company
should choose the time when information asymmetry is at the lowest level or to put it another
way, when the market is informed the most. In their research, they find that most of companies
conduct their SEOs after information about company earnings are publicized. In addition, the
further the time company publicizes information about its activities from the issuance, the worse
market reacts to company’s SEOs.
2.2.4
Agency problem theory:
In the context of SEOs motivation, agency model predicts that to access to more financial
resources for private advantages, managers are encouraged to issue SEOs; besides, they can use
SEOs to expropriate the benefits of minority shareholders (Bo et. al., 2011). This model also
predicts that equity issues by companies that do not have valuable investment opportunities are
bad news to shareholders since they enhance managerial discretion when managers’ objectives
differ from shareholders’ objectives (Jung et. al., 1996).
Study on behavior of firms in developed markets mainly focus on managers and shareholders
conflicts and company SEOs motivation. The agency problem, among the pecking order and
market timing theory which justify company financing decision has more power in explaining
company behavior (Jung et al., 1996). Their findings also show that some companies conduct
SEOs to profit managers rather than shareholders.
2.2.5
Efficient Market Hypothesis
Fama (1970) define three forms of market efficiency identified by the extent of information
reflection through stock price. The first form of market efficiency is weak form where current
stock price incorporates past information of company, no one can identify mis-priced stocks and
beat the market by analyzing company past prices. The second form is Semi-strong form in
which current stock price does not only reflect historical information but also publicly available
ones that reported in company’s financial statements, or earnings and dividend announcements,
changing CEO, etc. If the market is semi-strong efficient, stock price will immediately react to
the release of new public information. The last form is strong form in which current stock price
fully reflects all existing information of company including public and private information or
internal information.
SEOs can be considered new information to the market, the practice of issuing seasoned equity
becomes a channel to reflect “intention” of managers. Therefore, researching on market’s
reaction when company announces its SEOs can be considered a test of the semi-strong form of
market efficiency.
5
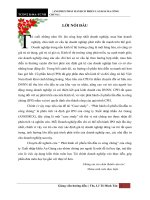
In figure 2.1, we recapitulate financial theories into a conceptual framework. We find that Trade-off, Agency problem, Growth
opportunities and Market timing are main theories influence determinants of company’s SEOs motivation. While Growth opportunities,
Market timing and Efficient market hypothesis are main theories concerning market reaction and determinants of market reaction to
company SEOs.
Trade-off
Agency
problem
Company’s SEOs motivation
Market
timing
Growth
opportunities
Efficiency market
hypothesis
Market reaction to company’s SEOs
Figure 2.1: Conceptual framework
6
CHAPTER 3
DATA AND METHODOLOGY.
3.1 Data
This research covers only listed companies on the Ho Chi Minh City Stock Exchange (HOSE)
during 2007 – 2013. Price of stocks are collected from HOSE website. If t is the year of the
SEOs announcement, independent variables are extracted from companies’ t-1 annual reports.
Our research sample comprises companies conducting their SEOs as right distributions; or rights
accompanied with dividends; or rights accompanied with bonuses; and companies issued their
seasoned equity as bonuses or dividends.
The event days include announcement day and ex-right day, which are widely publicized on the
media.
SEOs companies are classified according to three criteria (market capitalization, issuance
method and industry).
3.2 Methodology:
3.2.1 Determinants of company’s SEOs motivation:
To examine determinants of company’s SEOs decision, two main techniques have been applied
are: Logit regression technique and Probit regression technique
The dependent variable is the probability that company issues its seasoned equity offering
, taking the value of one if the firm i conducts SEOs in year t, and zero otherwise.
The independent variables include:
The difference between company’s leverage ratio and average of industry’s
leverage ratio (Difference In Leverage Ratio - DILR) is used as proxy for tradeoff theory
To examine the effect of growth opportunity on company’s SEOs decision,
TOBINQ ratio will be applied.
Ratio of market value/Book value (M/B) is used as proxy for market condition
before the issuance.
In terms of Agency problem, ratio of managerial holding include the board of
directors, board of supervisor, president and CEO (Ratio of Managerial Holding
- RMH) will be applied as proxy for this theory.
FIRMSIZE; D/A; PROFITABILITY are applied as controlling variables.
Model:
=
ILITY +
+
DILR +
TOBINQ +
M/B +
RMH +
SIZE +
D/A +
PROFITAB
3.2.2 Market reaction to company’s SEOs
3.2.2.1 Event study:
The Event study method which was developed by Campbell, Lo and MacKinlay (1997) will be
applied to investigate market reaction to SEOs.
Step 1: Event definition
7
Step 2: Selection criteria
Step 3: Normal and abnormal return measurement
Abnormal return - AR:
The abnormal return is formed by difference between actual return and expected return:
it = R – K
it
it
(3.1)
Average Abnormal Returns – AAR
Average Abnormal Returns of companies that are affected by the event is defined as:
N
AARt (1/ N ) ARit
(3.2)
i 1
Cumulative Abnormal Returns – CAR
Cumulative abnormal return is expressed as CAR is calculated by summing average abnormal
returns in observed period.
L
CAR( K , L ) AARt
tK
(3.3)
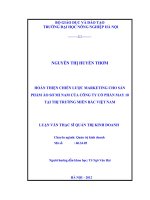
Step 4: Estimation procedure
The time line for a typical event study can be shown as followed:
Where:
o
o
o
- is the estimation window used for estimating benchmark parameters
T - T is the event window, the period over which the event occurs;
T - T is the post-event window used for analyzing the influence of the event.
Step 5: Testing procedure
T statistics is used to examine the significance level and calculate as:
t
AAR t
S ( AAR )
(3.4)
Step 6: Empirical results
Step 7: Result interpretation and conclusions
3.2.2.2 Determinants of market reaction to company’s SEOs:
Regressing our panel data on Random effects and Fixed effects model.
The dependent variables are the cumulative abnormal returns from day 0 to day +2, where day 0
is the event day.
8
The independent variables are as follow:
To calculate the impact of Growth opportunity on market reaction, we used the
ratio of TobinQ
In order to find the effect of Market timing on market reaction, we used
cumulative abnormal returns of market (MRUNUP);
Besides the proxies for the main standard theories, we include D/A, ISSUESIZE,
FIRMSIZE, INDUSTRY, ISSUEMETHOD and RMH as controlling variables.
Models:
=
+
TOBINQ +
MRUNUP +
DA + ISSUESIZE +
SIZE +
INDUSTRY + β7ISSUEMETHOD + RMH +
=
+
TOBINQ +
MRUNUP +
INDUSTRY + β7ISSUEMETHOD + RMH +
DA + ISSUESIZE +
SIZE +
9
CHAPTER 4
DETERMINANTS OF COMPANY’S SEOs MOTIVATION
4.2 Determinants of company’s SEOs motivation:
Model estimation results shown that TobinQ; ratio of Market value/Book value (MB); Firm size
(Size); ratio of Total debt/Total asset (DA) and Profitability are significant at the 5% and 1%
level while only ratio of managerial holding (RMH) is insignificant. In comparison to companies
that do not issue SEOs, companies with higher TobinQ ratio, higher ratio of Market value/Book
value, higher ratio of total debt/total assets and higher profitability are more likely to issue
SEOs. On contrary, companies with higher ratio of leverage relative to industry’s average
leverage and larger in size are less likely to issue SEOs.
The estimated coefficient for the proxy of the trade-off theory (DILR) have negative sign and are
insignificant in both column (1) and (5), implying that companies are not motivated to use SEOs
as a means to adjust their capital structure. This result has rejected our hypothesis 1 that the
difference between company’s leverage ratio and average of industry’s leverage ratio (DILR) has
positive impact on company’s SEOs decision. Therefore, we can confirm that Trade-off theory
does not impact on company’s decision on issuing SEOs.
Both column (2) and (5) of table 4.5 show significantly positive signs of estimated coefficients
for TobinQ, which imply that companies tend to issue SEOs when they have more growth
opportunities, which is consistent with the growth opportunity theory. Table 4.6 presents that
companies with higher TobinQ are 4% more likely to conduct SEOs than companies with lower
TobinQ, this result is relevant to our expectation since companies with more investment
opportunities will be motivated to conduct SEOs to finance for their opportunities. Our finding is
also consistent to results of Chikolwa and Kim (2009), Duca (2011); therefore, the hypothesis 2
companies with higher TobinQ ratio are more likely to issue SEOs is accepted. From this result,
we can conclude that growth opportunities theory influences company’s SEOs decision remains
unchanged (no rejection).
In column (3) and (5) of table 4.5 the estimated coefficients for the ratio of market value/book
value (MB) which is proxy for market timing theory is significant with positive sign, which
suggests that choosing time is one of motivations of companies to issues SEOs. Our result in
table 4.6 shows that companies experience higher ratio of market value/book value are 12.4%
more likely to conduct SEOs than the rest. This result is relevant to our expectation that
companies will choose time when market overvalues their stocks to issue seasoned equity. From
the results above we can conclude that the hypothesis 3 companies with higher ratio of M/B are
more likely to conduct SEOs is not rejected (hypothesis no rejected). We can also confirm that
the market timing theory impacts company’s SEOs decision.
The estimated coefficients for ratio of managerial holding /total outstanding shares (RMH) has a
negative sign and is insignificant in both column (4) and (5) of table 4.5, suggesting that
company’s SEOs decision is not motivated as a tool for controlling shareholders to expropriate
minority shareholders, which is inconsistent with the agency problem theory. This result is
inconsistent with our hypothesis 4 that the ratio of managerial holding (RMH) positively affects
company’s SEOs decisions. From this result, we conclude that the Agency problem theory does
not play important role on company’s SEOs decision.
10
Besides the results regarding to proxies for SEOs motivation explaining theories, all of our
controlling variables show significance results. We find that firm size estimated coefficients
(Size) are significant with negative sign in all estimations, implying that smaller companies are
more likely to conduct SEOs. Our result in table 4.6 shows that smaller companies are 4% more
likely to conduct SEOs than larger companies, we expect this result is explained by the fact that
small companies with limited access to bank loan will try to increase their financial resources
through SEOs instead of borrowing from the banks.
Secondly, the relation between the ratio of total debts/total assets and SEOs motivation is highly
significant with positive sign in all estimations. Our result shows that companies with higher
ratio of total debts/total assets are nearly 88% more likely to conduct SEOs in comparison to
those that have lower ratio of debt/total assets (Table 4.6). We believe that companies with
higher ratio of debt are more motivated to issue SEOs as means to reduce their level of debt.
Thirdly, all the estimated coefficients for profitability are significantly positive, which is not
consistent with pecking order theory prediction. This theory claims that company profitability
has negative correlation with SEOs decision because the more profitable the company is, the
higher internal resources company has; therefore, it does not have to excess external resources
such as loans borrowing or issuing SEOs. However, within the case of Vietnamese companies,
to guarantee the attraction and the success of the issuance, companies with more profitability
will be more self-motivated to issue SEOs to attract the investors to the bright scenario future of
companies. The result in table 4.6 shows that companies with higher profitability are 72% more
likely to conduct SEOs in comparison to those that have less profitability.
Table 4.5 SEOs conducting probability:
Motivation of SEOs: panel data probit estimation. This table presents results of Determinants of
company’s SEOs motivation. The sample period is from 2007 to 2013. The dependent variable is
the probability that company issue its SEOs. DILR is measured as Difference between
company’s leverage ratio and average of industry’s leverage ratio; TobinQ is measured as
(Market value of stock + Book value of debt)/Book value of total assets; MB is ratio of Market
value/Book value; RMH indicates ratio of managerial holding include the board of directors,
board of supervisor, president and CEO/Total outstanding shares; Size is Logarithm of total
assets; DA indicates Total debt/Total asset; Profitability is EBIT/Total assets; t-statistics are in
parentheses; *** Statistically significant at the 1% level; ** Statistically significant at the 5%
level; * Statistically significant at 10% level.
(1)
DILR
(2)
(3)
-0.041
(-0.85)
0.429
(7.55)***
TobinQ
0.478
(11.52)***
MB
RMH
Size
(4)
-0.172
-0.164
-0.135
-0.0002
(-1.39)
-0.168
(5)
-0.045
(-0.98)
0.160
(2.09)**
0.449
(10.08)***
-0.0001
(-0.27)
-0.146
11
DA
Profitability
Constant
Adjusted R
Prob>chi2
Obs.
(-5.23)***
3.481772
(12.97)***
4.255
(7.10)***
1.084
(0.056)*
0.1627
0.0000
1014
(-4.85)***
(-3.73)***
3.275
2.842
(12.94)***
(10.75)***
2.354
2.880
(3.91)***
(4.61)***
0.550
0.124
(0.94)
(0.20)
0.2076
0.2920
0.0000
0.0000
1014
1014
(Source: authors’ calculations)
(-5.13)***
3.197
(13.05)***
3.976
(6.80)***
1.160
(2.02)**
0.1581
0.0000
1014
(-3.98)***
3.192
(11.04)***
2.601
(3.89)***
0.157
(0.25)
0.3012
0.0000
1014
Table 4.6 Average marginal effects on SEOs probability:
This table presents results of average marginal effects on SEOs motivation. The sample period is
from 2007 to 2013. DILR is measured as Difference between company’s leverage ratio and
average of industry’s leverage ratio; TobinQ is measured as (Market value of stock + Book value
of debt)/Book value of total assets; MB is ratio of Market value/Book value; RMH indicates ratio
of managerial holding include the board of directors, board of supervisor, president and
CEO/Total outstanding shares; Size is Logarithm of total assets; DA indicates Total debt/Total
asset; Profitability is EBIT/Total assets; t-statistics are in parentheses; *** Statistically
significant at the 1% level; ** Statistically significant at the 5% level; * Statistically significant
at 10% level.
(1)
DILR
(2)
(3)
-0.038
(-0.88)
0.135
(8.09)***
TobinQ
0.134
(13.77)***
MB
RMH
Size
DA
Profitability
(4)
-0.057
(-5.44)***
0.932
(17.48)***
0.937
(7.63)***
-0.051
(-5.01)***
0.903
(17.58)***
0.739
(3.99)***
-0.038
(-3.81)***
0.916
(13.15)***
0.809
(4.77)***
(Source: authors’ calculations)
-0.000
(-1.39)
-0.056
(-5.33)***
0.921
(17.82)***
0.938
(7.27)***
(5)
-0.012
(-1.02)
0.044
(2.11)**
0.124
(11.45)***
-0.000
(-0.27)
-0.040
(-4.08)***
0.883
(13.65)***
0.719
(3.97)***
12
CHAPTER 5
MARKET’S REACTION TO COMPANY’S SEOs
5.2 Market reaction to company’s SEOs:
5.2.1 Market reaction around announcement day:
Table 5.2 shows the positive reaction of the market to company’s SEOs. Prices experience
consecutive increase from day -11 to day +2. The most remarkable increases are observed at the
period of [-7;0] and [-2;+2]. The cumulative average abnormal return in the period preceding
announcement day increase steadily and significantly, especially seven days before the
announcement day, price increases by 2.7% and are confirmed by statistic test at the significance
level of 1%. In the period of two days before and two days after the announcement day, the
cumulative average abnormal returns also increase by 2.8% and are testified by the significance
of 1 %.
In contrast to the decrease of price in the period of 14 days after ex-right day, after
announcement day, price only fall dramatically in three days (day +4; day +10 and day +12),
where day +4 witness the most dramatic decrease, then followed by consecutive increase from
day +5 to day +9, where day +6, and +7 experience significant increase. Within the period of 15
trading days after announcement day, although the cumulative average abnormal returns still
increase but this increasing trend does not prolong, CAR [ ; ] = 2.0% decrease to about 0.3% in
the period of [+3;+14].
In five consecutive days, from day +5 to day +9, price increase continuously, CAR[+5;+9] =
1.04% and this consecutive increase is confirmed by statistic test at the significance level of 1%
This period has correlation with the distance between announcement day and ex-right day, where
the gap between those days is usually from 5 to 9 days (Figure 5.1)
The AAR on announcement day recorded positive return with significance level at 1%. The ratio
of number of AAR increased/AAR decreased also confirm this positive trend. This result is
consistent with finding of Dhatt (1996) in Korean stock market where the high volume of the
SEOs will reduce the level of liability in a company then reduce the cost of financial distress
leading to positive reactions from investors. Tsangarakis (1996) study at Athens Stock Exchange
also witnessed the same results. The author finds that SEOs increase the financial resources in
company, increase the ownership of big investors then reduce the agency cost; Tan el. al. (2002)
show that in Singapore capital market, company issue SEOs after a period of stock price
increasing; there is a trend of information leaked before the announcement day that enable
speculators to achieve high returns.
Table 5.2 AAR and CAR around announcement day
Day (t)
AAR
CAR[15;t]
No. of AR
increased/No.
of AR
decreased
Day
(t)
AAR
CAR[15;t]
No. of AR
increased/No.
of AR
decreased
-15
0.000
0.000
244/271
0
0.006***
0.030
285/230 **
-14
0.000
-0.001
240/275
1
0.010***
0.040
322/193 ***
-13
0.000
-0.001
243/272
2
0.004**
0.043
269/246
-12
-0.001
-0.001
232/283 **
3
0.000
0.043
242/273
-11
0.001
0.000
264/251
4
-0.004***
0.039
204/311 ***
-10
0.000
0.000
241/274
5
0.002
0.041
249/266
13
-9
0.001
0.001
255/260
6
0.002*
0.044
256/259
-8
0.002
0.003
248/267
7
0.004***
0.048
260/255
-7
0.003**
0.006
274/241
8
0.002
0.049
266/249
-6
0.002
0.008
251/264
9
0.001
0.050
239/276 *
-5
0.001
0.009
260/255
10
-0.002
0.048
232/283 **
-4
0.004***
0.013
274/241
11
0.000
0.048
236/279
-3
0.002
0.015
255/260
12
-0.002
0.046
213/302 ***
-2
0.005***
0.020
276/239 *
13
0.001
0.047
252/263
-1
0.003**
0.023
265/250
14
0.000
0.047
253/262
* Significant at 10% level, ** Significant at 5% level, *** Significant at 1% level
(Source: authors’ calculations)
5.2.2 Market reaction around ex-right day:
Table 5.5 shows that the stock prices increase significantly on ex-right day and one day later
(day +1) with an increase of 1.2% and 0.6% respectively with the significance at 1%. Examining
the number of stocks increased/the number of stocks decreased on these two days, we find that
the number of stock increased outweigh the number of stock decreased 333/182 (on day 0) and
290/225 (on day +1). The cumulative returns in the period [0; +1] and [0, +2] also record
significant increase by 1.8% and 2% respectively.
In the period of ten days before the ex-right day, market react positively to companies’ SEOs,
the stock prices experience continuous increase from day -15 to day -4 and most of them are at
significance level of 1%. The cumulative abnormal return of the market in the period [-15; -4] is
recorded at 3.8% which is totally different to that of the period [-3;-1] where day 0 is ex-right
day, the price start to decline (the most significant decreases are at day -3 and day -2, the total
decrease is about -0.8% with the significance level at 1%.
In contrast to period after announcement day, after ex-right day, the price decline continuously
from day +3 to day +14. The cumulative returns in the period [+3;+7] is -0.9% and [+3;+14] is
more than -1%, both results are significant at 1%. We imply that after a period of prices
increasing, seasoned equities become less attractive to investors, especially after the ex-right
day.
14
Table 5.5 AAR and CAR around ex-right day
Day (t)
AAR
CAR[15;t]
No. of AR
increased/No.
of AR
decreased
-15
0.002***
0.002
262/253
0
0.012***
0.041
333/182 ***
-14
0.001
0.004
247/268
1
0.006***
0.047
290/225 ***
-13
0.001
0.005
247/268
2
0.001
0.049
258/257
-12
0.001
0.006
251/264
3
-0.002**
0.047
227/288 ***
-11
0.003***
0.009
273/242
4
-0.002**
0.045
228/287 ***
-10
0.003***
0.012
269/246
5
-0.001
0.044
225/290 ***
-9
0.006***
0.018
288/227 ***
6
-0.003***
0.041
199/316 ***
-8
0.006***
0.024
272/243
7
-0.001
0.040
231/284 **
-7
0.004***
0.027
273/242
8
0.001
0.041
254/261
-6
0.006***
0.034
280/235
9
0.000
0.041
249/266
-5
0.004***
0.037
268/247 *
10
-0.002**
0.039
223/292 ***
-4
0.000
0.038
251/264
11
-0.001
0.038
225/290 ***
-3
-0.004***
0.034
216/299 ***
12
0.000
0.038
242/273
0.030
208/307 ***
13
0.000
0.038
257/258
0.029
228/287 ***
14
0.000
0.038
240/275
-2
-1
-0.004***
-0.001
Day
(t)
AAR
No. of AR
increased/No.
of AR
decreased
CAR[-15;t]
* Significant at 10% level, ** Significant at 5% level, *** Significant at 1% level
(Source: authors’ calculations)
5.3 Determinants of market reaction to company’s SEOs:
5.3.1 Determinants of market reaction around announcement day:
In the full model (column 3), the p-value is equal to 0.0002 which is 1% inferior, we conclude
that overall the explanatory variables in our model can explain the determinants of market
reaction around announcement day. The estimated coefficients show that Market runup
(Mrunup), firm size (Firmsize), issuance method (Issuemethod) are significant while other
variables show no significant statistics results.
The TobinQ which is proxy for growth opportunities theory shows no significant result in both
column (1) and (3), suggesting that investors are not influenced by the growth opportunities of
company. This result is irrelevant to our expectation that TobinQ positively affects market
reaction around announcement day. However, in case of Vietnamese stock market, this result
can be explained that investor might not see information about growth opportunities
advantageous information when consider buying SEOs, or they are not fully aware of the
availability of company growth opportunities before announcement day. From this result, we
reject the hypothesis 6.a and conclude that growth opportunity theory does not play important
role on determinants of market reaction around announcement day.
The estimated coefficients for the proxy of Market timing theory (Mrunup) has positive sign and
is significant in both column (2) and (3), suggesting that the condition of the market before
announcement day influences the market reaction. Investors will base on the condition of the
market from 2 to 3 months before announcement day to make their decisions on whether to get
15
involved in company SEOs. This result is relevant to our initial expectation that the better the
market condition is, the better the market react to company SEOs. From the results above we can
conclude that the hypothesis H7a: Mrunup has positive impact on market’s reaction on
announcement day is not rejected (hypothesis no rejected). Our result is consistent with the
findings of of Salamudin et. al. (1999) at Malaysia stock market and Balachandran et. al. (2008)
at London Stock Exchange.
The estimated coefficient of equity rights has negative sign means that, on average, this method
generated 1.1% less returns than SEOs by equity bonuses or dividends. The difference between
those two methods is also testified at the significance of 5%.
Table 5.8 Determinants of market reaction around SEO announcement day
Determinants of market reaction around announcement day: panel data Random effects, Fixed
effects estimation. This table presents results of regression on cumulative average abnormal
return CAR[0;+2]. The sample period is from 2007 to 2013. The dependent variable is
cumulative abnormal return in the period [0;+2]. TobinQ is measured as (Market value of stock
+ Book value of debt)/Book value of total assets; Mrunup indicates Market cumulative abnormal
returns (VNIndex) in the period runs from day -65 to day -16, where day 0 is the announcement
day; DA indicates Total debt/Total asset; Issuesize denotes Logarithm of the volume of stock
issued; Firmsize is Logarithm of total assets; Industry effect and issue method effect are
controlled by adding industry dummy (REC takes value 1 if SEOs issued company is listed in
Real estate and construction group and takes value 0 otherwise, MAI takes value 1 if SEOs
issued company is listed in Manufacturing industry group and takes value 0 otherwise, SER
takes value 1 if SEOs issued company is listed in Service group and takes value 0 otherwise, FBI
takes value 1 if SEOs issued company is listed in Financial – banking – Insurance services and
takes value 0 otherwise, AFF takes value 1 if SEOs issued company is listed in Agriculture –
Fishery – Forestry group and takes value 0 otherwise); and issue method dummies; RMH
indicates ratio of managerial holding include the board of directors, board of supervisor,
president and CEO/Total outstanding shares; t-statistics are in parentheses; *** Statistically
significant at the 1% level; ** Statistically significant at the 5% level; * Statistically significant
at 10% level.
CAR
TobinQ
(1)
(2)
(3)
Coef.
Coef.
Coef.
0.052
(4.59)***
-0.002
(-0.13)
0.001
(0.21)
-0.012
(-1.79)*
0.000
(0.36)
0.052
(4.55)***
-0.002
(-0.14)
0.000
(0.15)
-0.011
(-1.66)*
0.001
(0.69)
Mrunup
DA
Issuesize
Firmsize
Industry
-0.004
(-0.31)
0.002
(0.29)
-0.011
(-1.66)*
16
MAI
SER
AFF
Issuemethod
RMH
Cons
Prob > chi2
0.002
(0.39)
0.005
(0.66)
0.019
(0.97)
-0.011
(-2.29)**
0.000
(0.84)
0.094
(2.48)**
0.1279
0.004
(0.65)
0.005
(0.74)
0.019
(0.95)
-0.010
(-2.18)**
0.000
(0.97)
0.101
(2.70)**
0.0001
0.004
(0.63)
0.005
(0.75)
0.019
(0.94)
-0.011
(-2.20)**
0.000
(0.99)
0.097
(2.57)**
0.0002
* Significant at 10% level, ** Significant at 5% level, *** Significant at 1% level
(Source: authors’ calculations)
5.3.2 Determinants of market reaction around ex-right day:
Table 5.9 presents the determinants of market reaction around ex-right day. The results from
Hausman test show that random effects model is the appropriate model (p-value > 0.05);
therefore we will interpret the results and test for heteroskedasticity, serial correlation and
multicollinearity based on the random effects model.
In the full model (column 3), the p-value is equal to 0.0002 (inferior to 1%), we conclude that
overall the explanatory variables in our model can explain the determinants of market reaction
around ex-right day. The estimated coefficients show that TobinQ, issue size (Issuesize), firm
size (Firmsize), MAI (group of companies listed in Manufacturing industry which includes
mining, processing, electricity production and distribution, natural gas, boiler, steamer and air
conditioner) are significant while other variables show no significantly statistics results.
The coefficient TobinQ which is proxy for growth opportunities in both column (1) and (3) are
significant with positive signs, suggesting that the information about existence of company
growth opportunities influence the market reaction. This result is relevant to our expectation that
TobinQ have positive relation with company’s stock abnormal return since company with more
investment opportunities can attract more investors to buy it SEOs. We conclude that the growth
opportunities theory impact on market reaction around ex-right day; therefore, the hypothesis 6b
is accepted.
Market runup (Mrunup) which is proxy for market timing theory show no significant result,
implying that market condition before ex-right day does not influence the reaction of the market,
which is irrelevant to our expectation that better the market condition is, the better the market
reaction to company SEOs. From this result, hypothesis 7b is rejected.
The issue size, which is stand for the price pressure on company stock price is expected to have
negative sign on event day because SEOs can increase the possibility of company stock dilution.
However, our result shows positive relation between issue size and market reaction. This might
be explained that in case of Vietnamese stock exchange, larger issuance will increase market
liquidity, which leads to positive reaction.
The firm size is expected to have positive correlation with SEOs market reaction however our
result show contradicted sign. We think that, in case of Vietnamese stock market, investors
might believe that the larger the company is, the more complicated it is, therefore the capital
17
generated from the issuance may not be used effectively. Our finding is consistent with the
results of Bo et. al. (2011) conducted at Chinese Stock market.
Among the industries, only the company listed in Manufacturing industry group which includes
mining, processing, electricity production and distribution, natural gas, boiler, steamer and air
conditioner companies is significant with a negative sign. Thus, we can conclude that Industry
has an impact on market’s reaction around XR day.
Table 5.9 Determinants of market reaction around SEOs ex-right day:
Determinants of market reaction around ex-right day: panel data Random effects, Fixed effects
estimation. This table presents results of regression on cumulative average abnormal return on
CAR[0;+2]. The sample period is from 2007 to 2013. The dependent variable is cumulative
abnormal return in the period [0;+2]. TobinQ is measured as (Market value of stock + Book
value of debt)/Book value of total assets; Mrunup indicates Market cumulative abnormal returns
(VNIndex) in the period runs from day -65 to day -16, where day 0 is the announcement day; DA
indicates Total debt/Total asset; Issuesize denotes Logarithm of the volume of stock issued;
Firmsize is Logarithm of total assets; Industry effect and issue method effect are controlled by
adding industry dummy (REC takes value 1 if SEOs issued company is listed in Real estate and
construction group and takes value 0 otherwise, MAI takes value 1 if SEOs issued company is
listed in Manufacturing industry group and takes value 0 otherwise, SER takes value 1 if SEOs
issued company is listed in Service group and takes value 0 otherwise, FBI takes value 1 if SEOs
issued company is listed in Financial – banking – Insurance services and takes value 0 otherwise,
AFF takes value 1 if SEOs issued company is listed in Agriculture – Fishery – Forestry group
and takes value 0 otherwise); and issue method dummies; RMH indicates ratio of managerial
holding include the board of directors, board of supervisor, president and CEO/Total outstanding
shares; t-statistics are in parentheses; *** Statistically significant at the 1% level; **
Statistically significant at the 5% level; * Statistically significant at 10% level.
CAR
TobinQ
(1)
Coef.
0.003
(2.38)**
0.016
(1.04)
0.021
(3.64)***
-0.022
(-2.99)***
0.008
(0.50)
0.016
(1.02)
0.023
(4.09)***
-0.025
(-3.52)***
(3)
Coef.
0.003
(2.34)**
0.005
(0.30)
0.016
(1.04)
0.021
(3.63)***
-0.022
(-2.99)***
-0.017
(-2.14)**
-0.009
(-0.99)
-0.011
(-0.45)
0.010
(1.56)
-0.016
(-2.01)**
-0.008
(-0.97)
-0.005
(-0.21)
0.011
(1.61)
-0.017
(-2.11)**
-0.008
(-0.97)
-0.011
(-0.45)
0.010
(1.56)
Mrunup
DA
Issuesize
Firmsize
(2)
Coef.
Industry
MAI
SER
AFF
Issuemethod
18
RMH
Cons
Prob > chi2
-0.000
(-0.28)
0.040
(1.03)
-0.000
(-0.50)
0.056
(1.45)
-0.000
(-0.26)
0.040
(1.03)
0.0001
0.0008
0.0002
* Significant at 10% level, ** Significant at 5% level, *** Significant at 1% level
(Source: authors’ calculations)
19
CHAPTER 6: CONCLUSION
6.1 Conclusion:
When examining company behavior to SEOs decision, we find that in comparison to non-SEOs
companies, companies with higher TobinQ ratio, higher ratio of Market value/Book value,
higher ratio of total debt/total assets and higher profitability are more likely to issue SEOs. On
contrary, companies with higher ratio of leverage relative to industry’s average leverage and
larger in size are less likely to conduct SEOs.
When choosing issuance method, companies with lower ratio of leverage relative to industry’s
average leverage, higher profitability and companies experience more favorable market
condition are more likely to issue SEOs by equity bonuses or dividends than by equity rights; on
contrary, companies are more likely to issue SEOs by equity rights when they have more growth
opportunities
Examine on market behavior, our results show that Ho Chi Minh stock market is not efficient in
term of semi-strong form. Before the announcement day, there is a trend of stock purchasing,
which is a sign of information leakage.
Around announcement day, price increase significantly in both before and after that day; while
after ex-right day, the increasing trend does not prolong.
The distance between the announcement day and the ex-right day is from 5 to 9 days, which
affects the average abnormal returns of this period.
Before event day, market tends to favor companies conduct SEOs by equity bonuses or
dividends than by equity rights. However, investors will soon adjust their behavior by selling
those stocks which already generated high profit.
In examining the determinants of market reaction to company’s SEOs around announcement
day, our results show no evidences to support the influences of growth opportunities on market
reaction around announcement day. However, in case of Vietnamese stock market, this result
can be explained that investor might not see information about growth opportunities
advantageous information when they consider buying SEOs, or they are not fully aware of the
availability of company growth opportunities. Regarding to market timing theory, we find that
the condition of the market before announcement day influences the market reaction. Investors
will base on the condition of the market from 2 to 3 months before announcement day to make
their decisions on whether to get involved in company SEOs. This result supports the influence
of market timing theory on determinants of market reaction to company’s SEOs. Besides, our
result shows that equity rights generated less returns than equity bonuses or dividends.
Regarding the determinants of market reaction to company’s SEOs, TobinQ which is proxy for
growth opportunities is significant with positive signs, suggesting that the information about
existence of company growth opportunities influence the reaction of the market around ex-right
day. We conclude that growth opportunities theory impact on market reaction around ex-right
day. The market timing theory, on the other hand show no significant result, implying that
market condition before ex-right day does not influence the reaction of the market. Besides, we
find positive relation between issue size and market reaction. This might be explained that in
case of Vietnamese stock exchange, larger issuance will increase market liquidity, which leads
to positive reaction. Firm size shows negative sign to market reaction around ex-right day. We
think that, in case of Vietnamese stock market, investors might believe that the larger the
company is, the more complicated it is, therefore the capital generated from the issuance may
not be used effectively.
20
6.2 Suggestion for stakeholders:
From the research findings, we then point out suggestions for relevant stakeholders to support
them in their finance and investment activities.
In case of investors:
An appropriate investment strategy on SEOs can bring certain benefit to investors, our results
recommend that investors could consider following factors:
The existences of growth opportunities, market condition, the magnitude of the issuance, size of
company and the type of issuance methods are factors that influence company stock returns
around event days.
Around the announcement day, companies experience favorable market condition, smaller
companies and companies that choose equity bonuses/dividends as their SEOs method generate
more cumulative abnormal returns than the remaining companies. On contrary, around ex-right
day, investors seem to favor companies with more growth opportunities, larger magnitude of
SEOs issued and smaller companies.
About 2 weeks before announcement day, investors might consider buying company’s SEOs,
especially choose SEOs by equity bonuses/dividends of companies experience higher cumulative
market returns, or from smaller companies. In case investors has missed the announcement day,
about 3 weeks before the ex-right day, they could consider joining the issuance by purchasing
SEOs from companies with more growth opportunities, offer larger issue size.
To prepare necessary financial resources to buy companies SEOs, investors might base on those
characteristics of companies such as the TobinQ, ratio of Market value/Book value, ratio of total
debt/total assets, profitability and ratio of leverage relative to industry’s average leverage to
predict their SEOs announcement. Our results show that in comparison to companies that do not
conduct SEO, companies with higher TobinQ ratio, higher ratio of Market value/Book value,
higher ratio of total debt/total assets and higher profitability are more likely to issue SEOs. On
contrary, companies with higher ratio of leverage relative to industry’s average leverage and
larger in size are less likely to conduct SEOs.
In case investor prefers SEOs by equity bonuses or dividends, we suggest investor should choose
company with lower ratio of leverage relative to industry’s average leverage company, company
experiences favorable market condition before announcement day and company with more
profitability. On contrary, companies are more likely to issue SEOs by equity rights when they
have more growth opportunities
In case of SEOs companies:
Ho Chi Minh stock market is not efficient in term of semi-strong form. Before the announcement
day, there is a trend of stock purchasing, which is a sign of information leakage. The market is
not efficient means that 1) the information is not transparent; 2) there are information
asymmetries among groups of investor 3) information is leaked before the official information
are made available to public. We suggest that SEOs companies should strengthen the
information dissemination activities by following regulations in information dissemination of
state securities commission of Vietnam in a serious, strict manner and closely monitored the
compliance with information dissemination regulations to guarantee the transparency, fairness
and effectiveness to deal with the situation of unbalanced information and protect individual
investors.
To ensure the success of SEOs issuance, company should choose appropriate market timing as
when the market is favorable, investors seem to care less about the fact that company equity is
overvalued or the stock dilution they might encounter when purchasing seasoned equities.
21
Investors seem to favor SEOs by equity bonuses or dividends which they do not have to pay
more to own company equity, conducting SEOs by this method might be more appealing to
investors; however, in case company wants to raise external financial resources by conducting
SEOs rights issuance, choosing market timing is an optimal option company should consider.
Before the announcement day, company should promote the information dissemination about
company activities, especially the availability of growth opportunities to draw investors’
attention to company SEOs.
The size of the issuance also affects SEOs investment strategy of investors. Our results show that
the issuances with bigger SEOs amount are more appealing to investors than smaller ones,
suggesting that investors might consider big issuance a “good deal”.