Flashless closed-die upset forging load estimation for optimal cold header selection
Bạn đang xem bản rút gọn của tài liệu. Xem và tải ngay bản đầy đủ của tài liệu tại đây (1.03 MB, 14 trang )
Journalof
ELSEVIER
Journalof MaterialsProcessingTeelmology59 (1996) 81-94
Materials
Processing
Technology
Flashless closed-die upset forging-load estimation for
optimal cold header selection
Matthew O'Connell a, Brett Painter a,*, Gary Maul b, Taylan Altan a
aERC for Net Shape Manufacturing, Ohio State University, Columbus, Ohio 43210, USA
blndustrial, Systems, and Welding Engineering Dept., Ohio State University, Columbus, Ohio, USA
Industrial Summary
In cold forming operations, the two primary considerations in determining process feasibility are load and
energy required to form the part. These two factors determine the press size and therefore the maximum
production rate. Close estimations of these values during the process planning stage allow for accurate
machine sizing and lead to higher efficiency. However, methods for estimating forming loads and energies of
flashless closed-die upsets are not well researched. The objective of this study was to develop guidelines for
this purpose. Experiments were conducted to measure the load during many flashless closed-die upsets. These
results were compared to predictions made using a mathematical model (modified slab method) and an FEM
analysis (DEFORM 2D) to gauge the ability to accurately predict forging loads. Additionally, FEM was used
to study the sensitivity of the forging load to friction conditions, part size, and average material strain. The
results indicate that the modified slab method predictions are quite accurate in some cases but overestimate
the load by as much as 35% in others. The DEFORM 2D load predictions are more consistent but g e n e r a l l y
underestimate the load by 5-20%.
1. Introduction
This project was undertaken in cooperation w i t h
the National Machinery Company (NMC), located
in Tiffin, Ohio, which supplies cold and warm
headers for the forging industry. When designing
cold and w a r m headers, NMC needs to estimate t h e
forming loads at each station to determine t h e
sequence of progressive dies and the size of t h e
header necessary to produce the part.
To select the appropriate size header for a given
application, the loads and energies of each die
station are summed. The die stations are used for a
mix of metal forming operations, and may include
forward extrusions, backward extrusions, open
upsets, flashless closed-die upsets, a n d / o r trimming
and piercing operations. Guidelines for estimating
forming loads are commonly available for most of
these operations and with a variety of materials.
Closed-die flashless upsets, however, have not been
well investigated.
* Corresponding author.
0924-0136/96/$15.00© 1996ElsevierScience S.A.All rightsreserved
PI10924-0136(96) 02289-3
It is important to correctly estimate the forming
load for each die station. Oversizing a header w i l l
result in an unnecessarily large machine cost and
lower production rate. Part cost will therefore be
higher than necessary. On the other h a n d ,
undersizing a header will cause overloading of t h e
press, resulting in
frequent
downtime
for
maintenance and repairs.
This paper describes the experiments and results
obtained while investigating the flashless closeddie upset process. The experiments included running
closed-die upset forgings with a variety of b i l l e t
materials and process conditions. Two t h e o r e t i c a l
models were then used to compare predicted forging
loads to these experiments. The theoretical models
tested were the modified slab method and FEM.
Background
The tooling investigated in this study is seen in
Fig. 1. The tooling consists of a flat faced punch and
a simple round die cavity. The edges of the punch
82
M 0 'Connell et al. / Journal of Materials Processing Technology59 (1996) 81-94
and die inserts are square. The main forging problem
in this process is the lack of complete die cavity f i 11
at the corners. [1]
The typical load-stroke curve for this operation
has two distinct stages: an upsetting stage and a
comer filling stage, illustrated in Fig. 2. At t h e
beginning of the stroke, the billet is cylindrical and
does not make contact with the die casing. As t h e
process begins, the billet undergoes a process similar
to an open upset until it makes contact with the die
casing (shown to the left of the dashed line in Fig.
2). At this point, the forming loads increase
dramatically as the comer filling occurs (shown to
the right of the dashed line in Fig. 2). The load
required to then fill the cavity is "extremely h i g h
(3 to 10 times the load necessary for forging the same
part in the cavity without corner filling)". [2] [3]
This corner-filling stage is the focus of interest in
this project. In particular, one is interested in finding
the required load to produce a specified amount of
comer filling. The amount of comer filling is
expressed as a ratio of the length of die wall in
contact with the deformed billet to the length of the
die wall, and is termed the percentage of die w a l l
contact (%DWC).
A review of upsetting technology indicates a need
to further investigate flashless closed-die forging
with respect to the forging loads required to a t t a i n
Up
o
..J
/
I Corner
I filling
I
I
I
STROKE
I
Fig. 2: Typical load-stroke curve of an enclosed
upset process
Filler
Punch
Casing
Punch
Die Casing
Filler
sufficient die cavity fill.
Relatively
little
experimental data has been published in t h e
literature to aid estimating the forging loads in
enclosed upsets. Likewise, little theoretical work is
available to estimate forging loads in enclosed
upsets.
This project consists of three main tasks:
1) collecting experimental
data,
2) estimating
forging load using the modified slab method, and
3) estimating forging load using FEM. The main
procedures and results of each task are detailed in
the following sections.
Experimental Program
Overview
Kic
Fig. 1: Tooling for the enclosed die upset
investigated in this project
For the experiments, it was necessary to collect
data for a range of upset geometries and a variety of
billet materials. Hence, four different b i l l e t
materials were selected for the study, and t h r e e
different upset geometries were designed, to yield a
test matrix of twelve configurations.
83
M 0 "Cormellet al. /Journal of Materials Processing Technology 59 (1996) 81-94
At the start of each testing configuration, the
punch-to-die distance was set such that was no
material contacted the die wall after the
blank was
upset (an open-die upset). The BDC position of the
p u n c h was then decreased until a uniform band of die
wall contact was obtained. At this distance, testing
began b y heading three to ten blanks. This BDC was
then decreased by 0.005 inch to 0.010 inch. Again,
three to ten blanks were headed. This procedure was
repeated
until the
m a x i m u m punch tonnage
(approximately 140 U.S. ton / i n . 2) w a s reached. A
data acquisition system recorded the p u n c h load and
p u n c h position over time for each trial.
The data acquisition system consisted of a 286 PC
equipped with "Labtech Notebook" software. The
system w a s configured to begin taking data w h e n the
position sensor output of the punch reached a
specified voltage. Therefore, the system was
triggered simply by cycling the header and data
collection began at a consistent ram position each
trial. Data samples of all input channels were taken
at the s a m e instant at a rate of 60 Hz.
• the ratios (Q = h0/d0) of initial upset head
height (h0) to initial
diameter (do) are
different (QB = 0.69, Q A = 1.04, Qc = 1.50)
d1 = 0.755" 0
I
I
h' I
(
:
)
ho
0.500"
do = 0.500" e
Fig. 3: Characteristic aspects of parts produced
in Tests A, B, and C
Tooling Design
To simplify the study, the tooling design was
m a d e as simple as possible. A schematic of the
tooling used in the tests is shown in Fig. 1 above,
divided into two halves. The left half of the
d r a w i n g shows the tooling with the punch not in
contact with the workpiece; the right half of the
d r a w i n g displays the punch at bottom dead center
(BDC). In the figure, the die is stationary and only
the p u n c h moves.
The tooling was m a d e to upset axisymmetric
parts from round bar stock, illustrated in Fig. 3. In
all cases, the initial blanks were formed from 0.500
inch diameter bar stock, and were headed to a
diameter of 0.755 inches. However, three different
billet lengths were selected, namely L = 1.020, 0.845,
and 1.250 inches, as indicated in Table 1. The
tolerances on the overall blank lengths were
specified as +0.001 inches, in an attempt to minimize
workpiece v o l u m e variations, thereby reducing load
variations during forging.
The different initial billet lengths, from
Table 1,
result in the following significant changes in the
final part dimensions and process:
• the final head heights are different (hlB =
0.142 inch, hlA = 0.218 inch, hlc = 0.333 inch
• the final-head-height to final-diameter ratios
are different (R = h l / d 1, R B = 0.19, R A = 0.29, R c
= 0.44)
Billet Materials
The headers manufactured by the National
Machinery C o m p a n y produce a wide variety of
parts, from different materials such as copper
alloys, various steels, and aluminum alloys.
Therefore, the following materials were chosen for
the study:
• CDA 101 Copper (a 99% pure copper)
• 1008-15 Steel (low carbon steel)
• 1038 Steel ( m e d i u m carbon steel)
• 304 Stainless Steel.
Tensile specimens of each material type were
fabricated to determine basic material properties.
The results of these tests are given in Table 2.
Compression specimens were upset to determine the
strength coefficients and strain hardening exponents.
In a flashless
closed-die upset operation,
lubrication between the workpiece and die wall is
not generally viewed as a factor contributing
significantly to the load. Therefore no petroleum
based lubricants were used during testing. Only the
standard phosphate wire coating served as a
lubricant on the 1008-15 and 1038 steel. No
lubrication was used for CDA 101 copper. A
molybdenum-disulfide dry lubricant was used on the
304 stainless steel to prevent part seizure in the die
cavity.
M. 0 'Connell et al. /Journal of Materials Processing Technology 59 (1996) 81-94
84
Table 1: Details of the upset testing configurations
Part Aspect
Test A
Test B
Test C
Billet cut-off length, L
1.020 inch
0.845 inch
1.250 inch
Upset head height, ho
0.520 inch
0.345 inch
0.750 inch
Target head heighti h 1
0.218 inch
0.142 inch
0:333 inch
q's upset, (ho/d0)
1.04
0.29
0.69
0.19
1.50
0.44
h i / d l ratio of h e a d
Material spread, dl/d0
1.5
1.5
1.5
Average true strain, e
0.82
0.82
0.82
Table 2: Material property data from tensile and compression tests
Young's Modulus, E
(Mpsi)
Yield Stress, Sy
(ksi)
Ultimate Tensile
Strength, SUTS (ksi)
Elongation
1008-15
Steel
30.0
1038
Steel
30.8
304 Stainless
Steel
21~5
41.1
39.0
69.7
61.0
41,4
49:0
72.1
100
17
36
15
55
84
81
67
76
54
85
101
200
0!12
0:21
0:15
0.35
CDA
Copper
22.5
101
(%)
Reduction in Area
(%)
Strength Coefficient,
K (ksi)
Strain H a r d e n i n g
Exponent, n
To promote die cavity fill (bulging), material
movement is typically restricted at the punchworkpiece interface. Hence, the punch face was
roughened with a coarse stone in a lathe and co
lubricant was used at this interface during any of the
tests.
Measurement and Characterization of Parts
Fig. 4 shows a number of parts produced with
varying degrees of die cavity fill. The dark band
around the part head is the area of die wall contact.
The blanks s h o w n are from Test A, 1008-15 steel. The
part on the far left required about 20 U.S. tons of
forming load (45 U.S. tons/in 2) and shows little die
wall contact, while the part on the far right
required 60 U.S. tons of forming load (135 U.S.
tons/in 2) and shows m u c h die wall contact.
After all the parts were produced, the amount of
die cavity fill in each part needed to be measured. It
was therefore first necessary to decide h o w die
cavity fill could best be characterized.
The
characterization was selected based on what a
design engineer will find valuable
and by
evaluating the statistical validity of particular
measured dimensions.
For the initial evaluation of resulting part
dimensions, eight parts from Test A, 1008-15 steel
were selected for measurement. Four of the parts
chosen exhibited the minimum amount of die wall
contact, and the other four parts exhibited the
maximum amount of die wall contact. The comer
underfill dimensions were measured and named
upper horizontal (UH), upper vertical (UV), die
wall contact (DWC), lower vertical (LV),
and lower
horizontal (LH), as shown in Fig. 5. An optical
comparator set at 20X magnification with digital
position readouts was used to measure the
dimensions. Each dimension was measured in four
locations around the part head (with a 90 ° spacing
between measurement locations). The averages and
standard deviations of each dimension were then
M. O'Connell et al. / Journal
85
of Materials Processing Technology59 (1996) 81-94
W
Fig. 4: Progression of parts produced with increasing die cavity fill
(Material 1008-15 steel, Test A)
calculated (based on 16 measurements, 4 parts times
4 m e a s u r e m e n t s / p a r t ) , and are p r o v i d e d in Table 3.
At minimum fill, the UV and DWC dimensions
show a variation of half or more their averages,
while the UH, LH, and LV dimensions show very
low variations. At m a x i m u m fill, all the
dimensions
except DWC show variations
of half
their
averages, while the DWC is very low. Because the
DWC value shows the lowest variation of the five
dimensions at high loads, it suggests that the DWC
value is the most reliable value for developing a
relationship between punch load and comer filling.
It is also reasonable to assume that the value of
<
DWC is of most concern to the process designer.
Therefore, the value of DWC is used to c o m p u t e a
measure of comer filling as given in Equation 1 and
Fig. 5.
length o f D W C
%DWC
.lO0
(1)
total h e a d height
Equation 1 was used to find the comer filling of
each upset of the study. A sample set of the
experimental results is presented below. This
UPPERHORIZONTAL(UH)
--
UPPER
~
'/~
J
=
VERTICAL
(UV)
DIE WALL CONTACT(DWC)
, ~ LOWERVERTICAL(LV)
LOWERHORIZONTAL(LH)
%DIE WALL
CONTACT
_
-
Dwc * 100
UV+DWC+LV
Fig. 5: Characterization of enclosed (flashless) upset part dimensions and cavity fill
A'I 0 'Connell et al. /Journal o f Materials Processing Technology59 (1996) 81-94
86
Table 3: Typical measured results of comer filling for minimum D W C and maximum D W C (each
value is an average of 16 measurements)
Dimension Name
Minimum
DWC
Value
3s Std D e v
DWC
Maximum
Value
3s Std D e v
U p p e r Horizontal (UH)
0.028 inch
0.007 inch
0.011 inch
0.006 inch
U p p e r Vertical (UV)
0.095
0.040
0.022
0.012
Die Wall Contact (DWC)
0.037
0.026
0.175
0.023
Lower Vertical (LV)
0.104
0.014
0.018
0.011
Lower Horizontal (LH)
0:034
0.005
0:010
0.004
measure of comer filling was used to compare with
predictions m a d e of the
theoretical
models
(modified slab m e t h o d and FEM) as described in
later sections of this paper.
150
140
130
120
Experimental Results
After all the test parts were produced and
measured, the results for each material
and
geometry combination were compiled. The upset
loads and percent die wall contact (%DWC) for each
BDC setting were averaged from the three to ten
blanks headed at each setting. Therefore, for each
combination of material and test geometry, a series
of data points relating punch load to percent die
wall contact was found. Fig. 6 shows the data taken
f r o m 1038 steel for all three test geometries (tests A,
B, and C). Standard deviation values for the data
points were calculated, but are not s h o w n in Fig. 6 for
clarity. This figure shows the required punch
pressure to obtain a given %DWC for each of the test
geometries. The punch pressures were determined by
dividing the punch loads by the area of the punch
face ( a p u n c h = 0.444 in2).
In each series, the relationship between punch
load and die wall contact is a positive one as
expected. An offset exists between the three tests.
The test C series corresponds to the part with the
greatest final head height and greatest number of
diameters upset ( h o / d o = 1.50), and lies beneath the
other two curves. Similarly, the test B corresponds
to the part with the smallest final head height
and
least number of diameters upset ( h o / d o = 0.69), and
lies above the other two curves. This trend was
found to be consistent for all of the materials tested,
with one exception:
the 1008-15 steel material
exhibited little difference between the results for
Tests A and B.
110
~ " 100
.~_
g 9o
uJ
~ 80
•/
~"
Q.
60
50
•
Test B IhJd o = 0.7)
•
Test A (hJd o = 1.0}
•
Test C (hJdo = 1.5)
4O
~E W~L C ~ T ~ T ~ 3 -
30
20
10
ENCLOSED UPSET
0
0
10
20
30
40
50
60
70
% Die Wall Contact
80
90
100
Fig. 6: Closed-die upset results for 1038 steel
(tests A, B, and C)
Fig. 7 shows a summary of all the experimental
results. All four material types are represented in
the figure. The three tests for each material have
been collapsed to a single curve, but a correction
factor model has been supplied to account for
differences in upset geometry. Note that this chart
is designed for upsets where the average true strain
of the material is e = 0.82 (or, dl/d0 = 1.5), as
described in the Tooling Design section above. To use
this figure to compute the required punch load to
~/~ O "Connell et al. / Journal o f Materials Processing Technology 59 (1996) 81-94
obtain a specific amount of die wall contact, the
following procedure should be used:
1.
2.
3.
4.
5.
6.
7.
Determine the m i n i m u m %DWC required in the
flashless closed-die upset.
M o v e f r o m that %DWC on the x-axis vertically
to the corresponding billet material curve.
Move horizontally from the curve to find the
base p u n c h pressure on the y-axis.
Look up the difference value, D, from Table 4 for
the a p p r o p r i a t e billet material.
Substitute the number of diameters upset
( h o / d o ) and the difference value, D, into the
correction factor equation to find CF, given in
Equation 2.
Find the total p u n c h pressure by adding the base
punch pressure obtained from step 3 to the
correction factor, CF.
Multiply the total punch pressure by the
projected area of the p u n c h face to determine the
total load, as in Equation 3.
87
curve for 1038 steel gives a base punch pressure of
approximately 124 U.S. tons / inch 2.
150
0
-
10
20
30
40
/
60
.
70
80
90
/
"~$~Y
140
130
120
50
140
A/
/
100
150
Z
i
d /
130
120
110
~"~.100
-
-
100
g 90
90
8o
8O
~
70
7O
o..
6O
#-
so
•
60
5O
•
4O
3O
Table 4: Look-up table of difference values, D, for the
billet materials studied
2O
10
Material
C D A 101 Copper
1008-15 Steel
1038 Steel
304 st'ainless Steel
Difference, D
0
10
(U.S. ton / in. 2)
13
14
20
27
30
40 50 60 70
% Die Wall Contact
80
90
100
Fig. 7: Closed-die upset s u m m a r y
CF(Correction F a c t o r ) = D . [ 1 . 8 7 5 - 1 . 2 5 . h~-~/
(2)
L = pA
(3)
where:
20
L = Total p u n c h load
p = Total punch pressure
A -- Project punch area
To illustrate the use of the chart, consider this
example: 1038 steel is being cold formed in a
flashless closed-die upsetting station. The initial
diameter of the bar is 0.67 inch, which is being upset
to a final diameter of 1.00 inch (punch area = 0.80
inch2), to yield an average true strain of e = 0.82
( d l / d 0 = 1.5) for which the experimental data above
was collected. The process calls for h o / d o = 0.90
(diameters upset) with a requirement of 65% DWC.
Thus, the initial head height is 0.600 inch and the
target head height is 0.267 inch. From Fig. 7, the
The appropriate D value for 1038 steel is found in
Table 4 to be 20 U.S. tons / inch 2. Next, the correction
factor, CF, is calculated by substituting the D value
and the number of diameters upset ( h o / d o = 0.90)
into Equation 2, resulting in CF = 15 U.S. tons / inch 2.
Summing the base punch pressure of 124 U.S. tons
/ inch a with the CF of 15 U.S. tons / inch 2 gives a
total punch pressure of 139 U.S. tons / inch 2. From
Equation 3 the total required punch load of (139 U.S.
tons / inch2)(0.80 inch 2) = 111.2 tons is calculated.
Discussion of Experimental Results
Fig. 7 shows that each material has a different
obtainable degree of die cavity fill at typical
maximum tooling pressures (140 U.S. tons / inch2).
This gives the process designer insight to determine
whether additional operations are necessary to
properly form a part. For example, if a flashless
closed-die upset process requires 95% DWC with
1038 steel, more than one hit will be needed to form
the part, because the m a x i m u m obtainable die wall
A£ O'Connell et al. /Journal of Materials Processing Technology 59 (1996) 81-94
88
contact is 78% in one blow with the maximum
pressure of 140 tons/inch 2.
Fig. 7 allows the required forming load to be
found as functions of the billet material and the
degree of upset (G/d0). However, the experiments
do not evaluate the forming load dependence upon
the average true strain, E, of the part. In all the
experiments performed, the average true strain E =
0.82 (E = In ] d l 2 / do 2 I = 0.82). In a closed-die
flashless forging, this value typically is not
exceeded. Occasionally however, there can be
requirements for E to go as high as 1.62. Additional
experiments would be necessary to find this
dependence empirically. However, this issue was
addressed during the FEM analysis of the upsetting,
and is described in a later section of this paper.
Slab Method
The slab m e t h o d analysis is used to predict the
required forging load based on material properties
and process geometries and conditions. Slab method
analysis is a common tool and is described in many
texts. In particular, evaluation of an axisymmetric
homogeneous open-die upset can be found in [4]. The
details of the derivation are omitted here;
however, the final formulation to compute the
maximum tooling load, L, based on part geometry
and material properties is given in Equations 4 and 5
as:
mdl
L = 4 d ~ .~f .(1-~
cJf = K - I n
)
(4)
3a/3-hj
Application
Upsetting
of Slab Method to Closed-Die
In a case where the material is forced to fill a
cavity, the operation cannot be considered simply as
an open-die upset. This is due primarily to the
difference in the assumed and actual deformation
zones. Because the material flow is restricted by the
cavity in a closed-die upset, less workpiece volume
deforms than does in an open upset. Hence, a
modification to the traditional slab method is made
to account for the reduced deformation zone when
trying to predict the forging load.
The maximum tooling load occurs at the end of
the upset stroke. At the end of the stroke, the part is
partially in contact with the die wall, and can be
divided into three distinct layers (slabs) of similar
deformation characteristics as shown in Fig. 8.
When the part is in contact with the die wall, the
middle layer (slab 2 in Fig. 8), is assumed to not
deform further; rather, it is considered to undergo
rigid-body motion. The top and bottom layers (slabs
1 and 3 in Fig. 8), however, do continue to deform
because they are not restricted by the die wall. To
compute the actual forging load using the modified
slab method, it is important to consider only the top
and bottom layers. The necessary changes to the
load formulation are detailed below.
In Equation 5, the only geometrical variables
required to predict the forging load are the final
diameter, dl, and the initial and final part heights,
h0 and hi. Therefore, these variables must be
corrected to reflect only the top and bottom layers.
Equations 4 and 5 are modified and presented as
Equations 6 and 7 below.
(5)
•(1+
L = -~(d,)2-(~f
where:
L
dl
sf
m
H1
K
h0
n
= maximum load on tooling
= final upset head diameter
= material flow stress
= shear friction factor.
= final height of upset head
= Hollomon strength coefficient
= initial height of billet to be upset
= material strain hardening exponent
However, this formulation is valid only for an
open-die upset, and is therefore not usable for
predicting the load in the closed-die upset discussed
in this paper. Equations 4 and 5 therefore need to be
changed to make them applicable to closed-die
upsets. The changes result in what is called the
modified slab method of analysis.
~
o f = K.(ln2h~_/n
m-d~ ,/
(6)
3~/3'2h,)
(7)
(2h;)
where:
= required forging load to closed-die
upset part to a given DWC
d 1 = final diameter of the upset part
sf
= material flow stress
m
= shear friction factor.
h~= final height of layer 1 (or 3)
K = Hollomon strength coefficient
h~,= initial height corresponding to the
final height of layer 1 (or 3)
n
= material strain hardening exponent
L
89
M O'Connell et al./Journal of Materials Processing Technology 59 (1996) 81-94
1.
2.
A
///;
B
////
////
3.
The material boundaries indicated b y A and B
in Fig. 8 are assumed to be straight, thus
making both layers I and 3 truncated cones.
The height of layer I is assumed to be equal to
the height of layer 3.
The amount of upper and lower horizontal
(defined in Fig. 5) is assumed to be one-half
the value of hr. This assumption is based on
the values presented in Table 3, and will not
cause significant errors if incorrect.
To find the volume of material in layer 1 (or 3),
the diameter of the top surface of layer 1 (or bottom
surface of layer 3), to be called d2, is found using
assumption 3 above. Specifically:
d 2 = d, - hf
///,
(9)
Then the volume of layer 1 (or 3) is found using
the formula for a truncated cone, given as:
Fig. 8: Dividing the part into layers for modified
slab analysis
v = '"3 ,
where:
To use the modified slab analysis, the initial
head diameter and head height must be known.
Also, the desired final head diameter and height
must be known, as well as the desired amount of die
wall contact. As usual, the appropriate material
properties m u s t also be known.
Then, the final slab height, h~, is found using
Equation 8:
h' 1 =
(1oo%
o/M'IW(~
" ~ "" ~ " . h.
(8)
2
where:
hf = final height of layer I (or 3)
h I = final target head height of
whole part (same as for slab
analysis)
To find the corresponding initial slab height,
h0,
the volume constancy principle is used. The head
geometry at the end of the stroke is known, and
therefore the volume of material in layers 1 and 3
can be computed. The stock diameter at the
beginning of the stroke is also known, and so the
corresponding height of deforming material can then
be found.
Several assumptions about the problem are m a d e
at this stage to estimate the volume of material in
layers 1 and 3:
B
+
+
(10)
= area of bottom surface of layer 1,
B m ~d[ 2
B ' = area of top surface of layer
B'=
4622
Finally, the corresponding initial height
deforming layers, h f), is found using:
4
ho = - - ' V
Tg'.do 2
1,
of the
(11)
The predicted forging load can then be calculated
using Equations 6 and 7 above.
To illustrate the modified slab analysis method,
an example using the same values as before is
presented: Compute the forging load needed to cold
form 1038 steel in a flashless closed-die station to
65% DWC. The initial stock diameter is 0.67 inches;
the final head diameter, dl, is 1.00 inches. The
initial head height is 0.600 inches and the final
target head height is 0.267 inches. Using a friction
factor of m = 0.9 (selected based on FEM results,
discussed later) and with Equation 7, the forging
load is predicted to be 110 tons. This value is in
agreement with the prediction of 111.2 tons forging
load found using the experimental data of Fig. 7,
described earlier. To obtain this result, the friction
3'I 0 'Connell et al. / Journal o f Materials Processtng Technology59 (1996) 81-94
90
factor was assumed equal to 0.90, because, during the
experiments, the friction conditions between the
punch and workpiece were artificially increased to
promote die filling. In the DEFORM simulations
detailed later, the shear friction factor was found
to
be m = 0.90.
140
(TesiCi)
120
:
~ loo
~
80
6o
•
a_
Results of Modified Slab Method
13-
40
:
;
2o
:
:
ExperimentalTest C
I
(1038 Steel)
I
- t - M o d i f i e d Slab Method |
(m = 0.9)
I
i
0
Figs. 9a and 9b show the results obtained using
the modified slab method to predict the forging
pressures for 1038 steel, using the test configurations
B and C. The modified slab method data points are
indicated by black diamonds, connected by solid
lines. The results are shown along with the
corresponding experimental data, with 3-sigma
error bars.
Evaluating the results for test B (thinnest upset
head height, hi = 0.142 inch) of 1038 steel, the
modified slab m e t h o d overestimates the forming
pressures by approximately 20%. However, for test
C (thickest upset head height, h 1 = 0.333 inch) of
1038 steel, the modified slab method predictions are
nearly perfect. This trend was also observed for
CDA 101 copper and 1008-15 steel. H o w e v e r the
modified slab m e t h o d greatly overpredicted the
forging pressures for 304 stainless steel.
The modified slab method results of Figs. 9a and
9b are based on an assumption of the friction factor =
0.9. Since the exact friction conditions are unknown,
it is useful to examine the sensitivity of the
predicted forging pressures on the friction factor.
Fig. 10 shows the predicted modified slab method
forging pressures for a range of friction factors, for
1038 steel, test C. The figure shows that as friction
factor is increased from 0.5 to 0.9, the predicted
forging pressure is increased by as little as 20% for
low amounts of DWC and as much as 40% for high
amounts of DWC.
140
120
"-:. 100
GO
v
i
a_
80
•
40
20
ExPerimentalTest
B I
(1038 Steel)
I
Modified Slab Method |
(m = 0.9)
. . . .
0
L . . . .
10
L
20
L . . . .
30
L . . . .
40
L . . . .
50
L . . . .
60
I
L . . . .
70
L . . . .
80
L . . . .
90
100
Fig. 9a: Comparison of modified slab method to
experimental data (1038 steel, Test B)
10
20
30
40
50
60
70
80
90
100
Fig. 9b: Comparison of modified slab method to
experimental data (1038 steel, Test C)
140
:
.E
.91
120
100
05
80
03
60
I&.
I
40
,I. m :0.5
J
--..o--m = 0.7
O-
20
- - . e - - m = 0.9
:
0
i
:
[
. . . . . . . . . . . . . . . . . . . . . . . . . . . . . . . . . . . . . . . . . . . .
0
10
20
30
40
50
60
70
80
90
100
Fig. 10: Effect of friction factor ~ predicted forging
pressure (1038 steel, Test C) using modified slab
method analysis
DEFORM 2D FEM Simulation
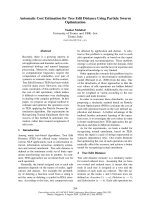
Version 4.1 of DEFORM 2D was used to simulate
the experiments described in this p a p e r [5]. Because
the process is axisymmetric, only half a cross-section
of the part was modeled. Four steps of an example
process simulation are shown in Fig. 11. The tooling
and workpiece geometries used in the simulation
were obtained from Fig. 3 and Table 1. The material
properties (strength coefficient, K, and strain
hardening exponent, n) were taken from Table 2. A
uniform initial mesh density was assigned to the
workpiece with 600 elements. The punch and die
were considered rigid bodies and hence did not
require meshes. The punch dimensions were defined
to overlap the die wall to prevent nodes from
penetrating between the punch and die wall during
the simulation.
A~ 0 'Connell et al. /Journal of Materials Processing Technology 59 (1996) 81-94
STEP (-1)
91
STEP (40)
1.2~
1.000
t~
e.
c
"1"
.750
.750
.SO0
2SO
i
.260
I
.500
Radius
J
750
25O
4
=~rJO
(in.)
,750
R a d i u s (in.)
STEP(80)
12GD
~0
STEP (92)
12w,~
I .o(l~
1¸ooo
c
-v
.TSO
1
.000
R a d i u s (in.)
Fig. 11: D E F O R M process s i m u l a t i o n of a c l o s e d - d i e u p s e t
I
.750
25O
R a d i u s (in.)
92
M. 0 "Connellet al. / Journal of Materials Processing Technology 59 (1996) 81-94
The friction conditions of the process were not
specifically known; it was therefore necessary to
estimate the friction factor at the workpiece-die
and workpiece-punch interfaces. The friction factor
at the workpiece-die interface was defined to be rn~
= 0.1, because of the lubrication conditions on the
materials described earlier.
The friction factor at the workpiece-punch
interface, however, was defined to be a high rr~, =
0.9, for two reasons. First, for the experiments, the
punch face was roughened with a stone purposely to
increase the friction. Second, FEM models generally
underestimate required forging loads because the
code neglects elastic deflections of the press and
work losses within the press. Therefore, choosing
such a high value of friction factor partially
compensated for these effects, and caused the
predicted forging loads to be more realistic.
Results of FE Modeling
Overall, the results obtained from DEFORM
were quite good when compared to the experiments.
Fig. 12 shows the experimental data and the
DEFORM results for CDA 101 copper, test B
geometry. For low percentages of DWC (20% - 60%),
DEFORM predicted a forging pressure less than was
found by experiment. For high percentages of DWC
(60% - 100%), DEFORM predicted a forging pressure
more than was found by experiment. In both cases,
the error was not more than about 10%.
140
120
c
100
though, DEFORM tended to underestimate the
required forging pressures. The error varied among
the cases from zero percent up to about 25%, and
averaged around 10% to 15%. Also, the slope of the
DEFORM predictions at low percentages of DWC
agreed very well with experiment. But at high
percentages of DWC, DEFORM tended to predict a
steeper slope than found from experiment.
The experimental results given in Fig. 7 are
limited in two important aspects: (1)absolute upset
part size and (2)average strain during upset. FEM
was used in this project to investigate the effect of
these two factors on upset forging load.
DEFORM Investigation of Absolute Part Size
FEM was used to study the effect of absolute part
size on required upset load. The relative flow
geometry would be the same, as well as the number
of diameters upset (ho/do) and the average true
strain, E. But the impact on the required forging
load to obtain a specified %DWC was unknown.
To study this
effect,
the
geometry
of
experimental test C was magnified by 0.5 times (do=
0.250", h0= 0.375" and dl = 0.375") and by 2.0 times
(do = 1.000", h0 = 1.500" and d~ = 1.510") for further
FE simulations. These geometries still have an
average true strain E = 0.82 (marl. spread = 1.5) and
upset ratio h o / d o = 1.5. Fig. 13 shows the results of
three DEFORM simulations (0.5, 1.0, and 2.0 times
the original part size). As seen ha the figure, the
difference among the three curves is very small,
illustrating that the absolute size of the geometry
does not significantly affect the relation between
required upset load and percent die wall contact
obtained (%DWC).
80
DEFORM Investigation of Part Strain
o
o
60
13.
40
D_
20
Experimental Test B
•
•
D E F O R M (m0 = 0.9)
0
10
20
30
40
50
60
70
80
90
100
% Die Wall Contact
Fig. 12: Comparison of FEM analysis to exp. data
(CDA 101 copper)
In all cases, DEFORM was found to reasonably
predict the required forging pressure. In general
FEM was also used to study the effect of average
part strain on required forging load. All the tests of
this project had the same average true strain ( E -0.82, dl/d0 = 1.5). However, it is common that other
head geometries will result in different average true
strains ( E ¢ 0.82, dl/d0 ¢ 1.5) from the same initial
stock geometries.
To study this effect, two additional forging
geometries were modeled in DEFORM. The first had
a larger diameter cavity (d 1 = 1.000", E = 1.38, marl.
spread = 2.0); the second had a smaller diameter
cavity (d a = 0.625", E -- 0.45, matl. spread = 1.25).
Both FE models began with the same initial billet
dimensions as Test C (do = 0.500" and h o = 0.750").
M. O'Connell et al. /Journal o f Materials ProcessingTechnology$9 (1996) 81-94
Fig. 14 displays the DEFORM results of these
simulations. Each curve represents the forging load
required to obtain a specified percent of DWC for a
particular head geometry. The figure shows t h a t
there is a distinct shift from one curve to the next.
The curve that ties highest on the graph corresponds
to the part with the greatest part strain; the curve
lowest on the graph corresponds to the part with the
lowest strain. This figure indicates that the g r a p h
of Fig. 7 is valid only for the particular a v e r a g e
part strain, ~ = 0.82. Thus, in a flashless closed-die
upset, the relation between the forming load and
%DWC is dependent upon two variables: (1) the
upset ratio (number of diameters upset, h o / d o ) and
(2) the average true strain, E, of the upset p a r t
head.
140
120
c
•
93
......
DEFORM Test C
d =05m.
/
e
)
/
0, • o 7 ~ in
TestC ~caleXO.§
.
d0"02$~.
d1 • 037~ in
I
.
.
.
.
T e s t C S c a l e X 2,0
100
i
/ /
) /;
/;
do.lOre
~ ea
~ 6O
n
2O
,
10
20
30
,
,
,
,
.
,
,
.
.
.
.
,
.
.
.
.
,
,
40
50
60
70
% Die Wall Contact
,
.
80
90
100
Fig. 13: Effect of absolute geometry size (CDA 101
copper, ho/do = 1.5)
SUMMARY
The objective of this study was to study t h e
flashless closed-die upset process, in order to learn
the factors that influence the required forging loads.
Experiments were performed using four common
materials and three different test geometries. The
results were then presented as the forging load (or
pressure) required to obtain a specified percent of die
wall contact. These experimental results were t h e n
compared with two common mathematical analyses
of the process: (1) slab method calculations and
(2) finite-element analysis.
During process development, a process designer
can use the results of this project to predict required
forging loads and the amount of underfilling after a
hit.
A limitation of the project results is that t h e
results are applicable only to closed-die processes
where the average part strain is 8 -- 0.82. A l t h o u g h
this a c o m m o n value of average part strain in closeddie upsets, many processes result in higher or lower
part strains. Finite-element simulations were
conducted to study the effect of part strain on
required forging loads, and are presented in this
paper, but the results were not verified against
experiment.
Both the modified slab method and finiteelement analyses proved to predict the required
forging loads reasonably for closed-die upsets. The
modified slab m e t h o d tended to overpredict t h e
required forging loads by zero to 20%. FEM analysis
tended to underpredict the required forging loads a t
low %DWC, and overpredict the required forging
loads at high %DWC, in both cases the error being
10% or less.
140
tl/a ° • 15
120
,-082
•
DEFORM TEST 1
%/%. ~s
"
DEFORM TEST 2
i
hoJd° , 1s
dlJ % • 20
.
"
100
@
80
.
.
,ot38
o
.
i
....
60
. . . . . . . . . . . . . . . . . . o~)?.
O.
..---" . . . .
40
20
0
10
20
30
40
50
60
70
% Die Wall Contact
80
90
100
Fig. 14: Effect of part strain on die filling (CDA 101
copper, Test C)
Acknowledgment
The work summarized in this paper was
partially funded by National Machinery. The
authors also would like to acknowledge Robert
Lucius and National Machinery for their generous
support of this project and for the use of t h e i r
facilities to conduct the experiments described in
this paper.
94
~ O'Connell et al. / dournal of Materials Processing Technology 59 (1996) 81-94
References
[1] Wick, C. (1984). Tool and Manufacturing
Engineers Handbook: Volume I Forming, Society
of Manufacturing Engineers, 1 SME Drive,
Michigan, USA.
[2] Raghupathi, P.S., Oh, S.I., & Altan, T. (1982).
"Topical Report No. 10, Methods of Load
Estimation in Flashless Forging Processes",
Battelle Columbus Laboratories, 505 King Ave.,
Columbus, Ohio, USA 43201, p. 94.
[3] Lange, K. (1985). Handbook of Metal Forming,
New York, McGraw-Hill Book Company.
[4] Altan, T., Oh, S., & Gegel, H., (1983). Metal
Forming: Fundamentals and ADDlications,
American Society for Metals, Metals Park,
Ohio, USA.
[5] DEFORM, Scientific Forming Technologies
Corporation, (1993). Metal forming FEM code,
Columbus, Ohio, USA.