Mối quan hệ giữa động cơ du lịch, hình ảnh điểm đến và lựa chọn điểm đến nghiên cứu trường hợp điểm đến du lịch tỉnh bình định (TT)
Bạn đang xem bản rút gọn của tài liệu. Xem và tải ngay bản đầy đủ của tài liệu tại đây (408.12 KB, 27 trang )
`
MINISTRY OF EDUCATION AND TRAINING
UNIVERSITY OF ECONOMICS HO CHI MINH CITY
----------------
DANG THI THANH LOAN
THE RELATIONSHIP BETWEEN TOURISM MOTIVATION,
DESTINATION IMAGE AND DESTINATION CHOICE - A CASE
STUDY OF TOURISM DESTINATIONS IN BINH DINH PROVINCE
Major: Business Administration
Code: 62 34 01 02
SUMMARY OF ECONOMIC DOCTORAL THESIS
Ho Chi Minh City - 2016
The work was completed at:
University of Economics, Ho Chi Minh City
The scientific supervisors:
1. Prof. Dr. Bui Thị Thanh
2. Prof. Dr. Pham Xuan Lan
Reviewers:
1.
2.
3.
The dissertation will be defended in front of the Dissertation Evaluation Council at
The University of Economics of Ho Chi Minh City at
………………………………………. 2016
The dissertation can also be found at:
- National Library of Vietnam
- General Scientific Library, Ho Chi Minh City
- Library of University of Economics, Ho Chi Minh City
LIST OF AUTHOR’S PUBLICATIONS RELATED TO THE THESIS
1. Dang Thi Thanh Loan, Bui Thi Thanh, 2014. Factors affecting tourist attraction: a case
study of Binh Dinh province. Journal of Economics & Development. December - 2014.
Number 210.
2. Dang Thi Thanh Loan, 2015. Promoting comparative advantages to develop tourism in
Binh Dinh. Journal of the Asia Pacific Economy. September - 2015. Number 452.
3. Dang Thi Thanh Loan, 2015. Factors affect the satisfaction of tourists about Binh Dinh
destinations. Journal of Economic Development. September - 2015. Number 9.
4. Dang Thi Thanh Loan, 2016. Measuring local residents’ perceptions towards sustainable
tourism development: the case study in the South Central Coast region of Vietnam,
International conference Sustainable tourism development of South Central Coast of
Vietnam, 665 - 682. Da Nang 23 – 07 – 2016. Nanhua University – Taiwan & Vietnam
University of Commerce & College of Commerce.
5. Dang Thi Thanh Loan, 2016. The pioneering role of local provincial government toward
sustainable tourism development: A case study of Binh Dinh province. International
conference proceedings Sustainable tourism development: roles of Government, Business
and Educational Institutions, 307 - 318. Ha Noi 09 – 10 – 2016. Faculty of Tourism and
Hospitality – National Economics University.
1
CHAPTER 1: OVERVIEW
1.1. Rationale
1.1.1. In term of theoretical aspect
Destination choice is an important research concept that has drawn much
attention from scholars in recent decades. “A holiday destination choice can be
conceptualised as a tourist’s selection of a destination from a set of alternatives”
(Huybers, 2004, p. 1). Thus, tourism destination choice is a very important decision
process not only for tourists but also for the destination.
Although these research had some contributions to scientific development and
reality settlement, these research remain highly fragmented so far and there has been no
research that logically and systematically determines the relationship between the
tourism motivation, destination image and destination choice of tourists. From the
qualitative research carried out by the author, it was indicated that the relationships
between pairs of concepts can appear simultaneously. In addition, previous research on
destination choice used fairly rudimentary research methods and data processing; for
example, most of them used descriptive statistics, logistic regression or multiple
regression testing; therefore, they haven’t tested the correlation relationship between
these components and considered the impact of potential moderator variables.
1.1.2. In term of practical aspect
In recent years, tourism represents one of the most important and dynamic areas
in the economy world. Tourism is a growing industry not only in developed countries
but also in developing and less-developed countries (Tasci and Knutson, 2004). Due to
the potential benefits that tourism can bring to the destination, there is strong
competition in attracting tourists between regions, countries and even between the same
local destinations within a country. This explains why local governments and other
organizations have been focusing efforts on the creation of tourist attractions to
compete with other relevant destinations in the target market.
As a coastal province in South Central region and considered as a land with rich
and beautiful nature, and abundant cultural history, Binh Dinh is a place fully
converged basic tourism resources and comparative advantages with neighboring
provinces to be able to organize most of the large-scale types of tourism that can
2
become a major attraction to domestic and international tourists. However, up to now
tourism sector has not really promoted these advantages, which is clearly expressed
through a number of key aspects such as the modest number of tourists to Binh Dinh,
the little average length of stay, the low average expenditure, etc. Compared to other
coastal south central areas, Binh Dinh tourism sector accounts for a relatively small
role. There is a big gap between potential and actual tourism development. In the eyes
of many tourists, Binh Dinh seems to be the promised land for tourism, “potential
tourism of Binh Dinh is still … potential...”
1.2. Research objectives and questions
The overall objective of the study is to build a model generalizing relationships
between antecedent variables such as travel constraint, tourism motivation, destination
image and destination choice of tourists. The reseach was tested for the case of Binh
Dinh province, thereby suggesting some policy implications to attract tourists to the
destination. The specific research objectives of the thesis are:
- Building a model of the relationships between antecedent variables such as
travel constraint, tourism motivation, destination image and destination choice of
tourists; testing these relationships for the case of tourism destinations in Binh Dinh
province;
- Measuring and testing the relationships between antecedent variables such as
travel constraint, tourism motivation, destination image and destination choice of
tourists under the influence of potential moderator variables such as socio-demographic
characteristics and trip characteristics.
From the research results, some policy implications are proposed to help Binh
Dinh tourism management agencies plan strategies to attract tourists to Binh Dinh
Research question:
1. How are the relationships between travel constraint, tourism motivation,
destination image and destination choice of tourists? And what are the results in the
case of Binh Dinh destination (testing for the case of Binh Dinh destination)?
2. How do the relationships between travel constraint, tourism motivation,
destination image and destination choice of tourists change under the influence of
3
potential moderator variables such as socio-demographic characteristics and trip
characteristics?
1.3. Objects and scope of the research
Research objects
The thesis focuses on the concepts of travel constraint, tourism motivation,
destination image and destination choice of tourists and the relationship between them.
Research Scope
The thesis focuses on analysing the case of Binh Dinh tourism destination. The
survey period started from September 2013 to September 2015 and was divided into 4
stages.
Respondents
- Respondents in qualitative research are tourists, tourism lecturers and managers
in the tourism field.
- Respondents in quantitative research are domestic and international tourists
visiting Binh Dinh.
1.4. Research Methods
The thesis mainly uses quantitative research combined with qualitative research.
1.5. New contributions of the thesis
In terms of theoretical aspect:
- The study systematically overviews all targeted theoretical research that serve
as the basis for the modeling study. Specifically, based on the synthesis of previous
research, the author organizes, reviews and makes comments and observations which
are fundamental to the research model design. The research not only clarifies the theory
on destination choice in Vietnam's economy, but also adds and tests the relationship
between travel constraint and tourism motivation as well as that between travel
constraint and destination image which are neglected in previous studies.
- This is the first study that simultaneously tests and measures the relationship
between antecedent variables such as travel constraint, tourism motivation, destination
image and destination choice. The research hypothseses are accepted and the reliability
guaranteed. The results of the study help researchers and managers have a more
complete and comprehensive view on a method to approach and measure the
4
relationship between tourism motivation, destination image and destination choice from
the customer perspective and identify key factors and their influence role in destination
choice.
- In addition to inheriting and adjusting the scale of tourism motivation,
destination image and destination choice, the thesis has built a new travel constraint
scale based on customers’ perceptions.
In terms of practical aspect:
- Combining academic research with applied one, the research builds up and tests
the scales and research model of the relationship between tourism motivation,
destination image and destination choice (testing for the case of Binh Dinh destination)
and apply these results to assess the situation and suggest some policy implications to
attract tourists to the destination. This information will help the relevant authorities,
incorporations and individuals operating in the tourism sector decide what they should
do to attract tourists on the basis of enhancing the most of their peculiar conditions in
the most effective way.
- The results of research also contribute to the basis for further studies in this
field to explore more factors as well as their importance in promoting the destination
choice.
1.6. Research structure
The thesis is presented in five chapters:
- Chapter 1: Overview of research
- Chapter 2: Theoretical foundations and research models
- Chapter 3: Study design
- Chapter 4: Findings
- Chapter 5: Conclusion and policy implications
5
CHAPTER TWO: LITERATURE REVIEW AND STUDY MODELS
2.1. Some basic concepts
2.1.1. Tourism
In general, the concept of tourism depends on the approach angles for different
purposes. According to Article 4, Term 1 of the Law on Tourism (2005), “Tourism is
the activity related to people’s trip outside the regular place of residence in order to
satisfy their needs for sightseeing, research, entertainment and relaxation in a certain
time period”.
2.1.2. Tourist
There are many different points of view on identifying who tourists are.
According to Article 4, Term 2 of the Law on Tourism (2005) “Tourists are people who
travel or combine travel, except for schooling, working or practicing to get income at
the destination”.
2.1.3. Tourist destination
Gartrell (1994) defines tourist destination as the geographic area with particular
properties, features, attractiveness and services to attract potential tourists. In the
strategic perspective, Buhalis (2000, p.98) defines a tourist destination as “a
geographical region which is understood by its visitors as a unique entity, with a
political and legislative framework for tourism marketing and planning”.
2.1.4. Tourist product
“Tourist product is a set of necessary services to meet the needs of the tourists
in their trip” (Article 4, Term 10, Law on Tourism, 2005). Tourist product includes
tangible and intangible elements, in which intangible elements usually account for high
proportion.
2.2. Behavior theory
2.2.1. Theory of consumer behavior
Theory of consumer behavior studies how people buy, what they buy, when they
buy and why they buy. Studying consumer behavior focuses on how a person decides to
spend his/her available resources (time, money, effort) on goods and services
(Schiffman and Kanuk, 2004).
6
2.2.2. Tourist behavior theory
Tourist behavior is the consumer behavior in the travel sector. Although
consumer behavior in the travel sector is interesting and fascinating, it is very difficult
to carry out research in this field. Customers in tourism sector has become more
diverse, more experienced, higher quality required, more conscious and generally more
complex (Knowles et al, 2001). Tourist behavior is an important aspect to be studied in
all marketing activities (Fratu, 2011).
2.2.3. Applying tourist behavior theory in travel business
Understanding consumer behavior is very important for marketing success.
Swarbrooke and Horner (2007) suggests that the subject of consumer behavior is the
key for building the foundation of all marketing activities that are undertaken to
develop, promote and sell tourist products.
2.3. Tourism motivation
2.3.1. Definition
“Motivation refers to a need that drives an individual to act in a certain way to
achieve the desired satisfaction” (Beerli and Martin, 2004b, p 626). Tourism motivation
is accepted as a central concept in understanding tourist behavior and the process of
choosing a destination.
2.3.2. The components of tourism motivation
The number of components of social-psychological motivation is not
inconsistency in studies, but most previous studies have tried to determine the tourism
motivation by developing a list of factors in several criteria and then used factor
analysis techniques to reduce the number of items in the list.
2.4. Destination image
2.4.1. Definition
There has been no agreement on the concept and the components of destination
image among researchers. According to Bojanic (1991), destination image is a person’s
impression on a place he/she does not reside. Sharing this view, Crompton (1979),
Barich and Kotler (1991) suggest that destination image is the sum of beliefs, ideas and
impressions that a person has on a destination. Many recent studies accept the concept
of “destination image is an interactive system of thoughts, opinions, feelings,
7
visualizations, and intentions toward a destination” (Tasci et al, 2007, p 200).
According Echtner and Ritchie (2003), destination image is an impression or perception
of a place based on a spiritual representative of the potential properties and benefits of
the destination.
2.4.2. The components of destination image
There are many proposals on the components measuring destination image.
Summarizing previous research, Beerli and Martín (2004a) demonstrate that there is a
lack of uniformity of properties measuring perception of a person about a destination.
2.5. Travel constraint
In tourism, travel constraint has been documented since the 1980s. Sönmez and
Graefe (1998) have defined travel constraint as the unwanted problem from a depressed
tourism experience (psychological risks) to the serious threat to the health or lives of
tourists (the threat of physical, health or terrorism). Travel constraint can slow down,
reduce or stop completely the tourism participation and choice process of the tourist
destinations, which is reflected in the attractiveness and competitiveness compared to
other destinations. According Kerstetter et al (2005), travel constraint is the main factor
preventing people from starting or continuing to travel. Travel constraint mentions
factors that inhibit the continuation of the trip, cause inability to start, result in the
inability to maintain or increase frequency of travel, and/or lead to negative effects on
the quality of tourism (Hung and Petrick, 2010). Previous studies shows that the system
of travel constraint level exist at different levels. However, individuals can overcome
(negotiating) some travel constraints, such as cost, if the desire to visit destinations is
strong enough (Chen et al, 2013).
2.6.1. Concept
In broad terms, a destination can be viewed as a product or service. Destination
choice, at the macro level, is concepted as the process to select a destination from
competitive alternatives (Woodside and Lysonski, 1989; Crompton, 1992; Tham et al,
2013). At the micro level, destination choice is interpreted as a function of the
interaction between the practical limitations such as time, money, skills and destination
image (Woodside and Lysonski, 1989).
8
2.6.2. Approaches
Mansfeld (1992) argues that there are two theoretical approaches from previous
research to study the decision-making destination choice of tourists: (1) the approach
based on Neo-classical traditional demand theory and (2) the approach based on
random-utility theory.
2.6.3. Some empirical research
Um and Crompton (1990), Ankomah et al (1996), Sırakaya and Woodside
(2005) explained that in order to choose a destination, tourists follow a funnel-like
procedure which starts from a relative large initial set of alternative destinations and
through a process of narrowing down, tourists finally select the most promising
alternative. While going through the stages of the selection process, the decision makers
are affected by many factors. From the initial theoretical research about the tourist
destinations selection process of Um and Crompton (1990), many studies have explored
factors in the tourist destination choice model. Synthesizing from some representative
research, it is found that there are many factors mentioned in destination choice model.
While some researchers consider the impact of each individual factor, some other
studies examine the simultaneous impact of various factors on the destination choice.
The research can be divided in two main groups with some representative studies: (1)
Studies based on traditional utility theory and (2) Studies based on random-utility
theory.
2.7. Relationship between the research concepts
2.7.1. Tourism motivation and destination image
According to Beerli and Martin (2004b), people with different motivations can
evaluate a destination in the same manner if the awareness of it meets their needs. The
awareness of tourists about the level that a tourist destination can fully perform their
specific requirements is reflected in the attractiveness of the destination. The research
of Baloglu and McCleary, (1999a), Beerli and Martín (2004a, 2004b), Yue (2008), Shin
(2009) show that tourism motivation has a significant impact (positive) on destination
image. Therefore, the research hypothesis proposed is:
H1: There is a positive relationship between tourism motivation and destination
image.
9
2.7.2. Tourism motivation and destination choice
There are many studies demonstrating tourism motivation factor, which can be
divided into the pull factors and push factors affecting the travel behavior (Yoon and
Uysal, 2005; Jang and Wu, 2006; Huang and Hsu, 2009; Wu et al, 2009; Mohammad et
al, 2010) in which the destination choice is the decision to visit the destination as well
as commitment to revisit and recommend to others. Recently, Hsu et al (2009), Zhang
(2009), Guillet et al (2011), Mutinda and Mayaka (2012) confirm that tourism
motivation is one of important factors affecting the destination choice. Accordingly, the
research hypothesis proposed is:
H2: There is a positive relationship between tourism motivation and destination
choice.
2.7.3. Destination image and destination choice
Testing the influence of destination image on destination choice is a popular
topic of research (Gartner, 1989; Bigne et al, 2001). These studies conclude that
destination image creates expectations before the trip and it affects the decision making
of tourists on the trip (Gartner 1989; Woodside and Lysonski, 1989; Fakeye and
Crompton, 1991 ) and post-trip evaluations as well as intentions to revisit a destination
in the future (Wang and Hsu, 2010). Accordingly, the research hypothesis proposed is:
H3. There is a positive relationship between destination image and destination
choice.
2.7.4. Travel constraint and destination image
Travel constraints are factors limiting the formation of leisure hobby, inhibit or
prevent the entertainment participation and enjoyment. Chen et al (2013) confirm that
destination image plays a mediate role between travel constraint and intend to visit, and
hence the negative impact of perceived travel constraints to visit intention can be
reduced through the intermediate effects of the destination image. In very few research
papers, Chen et al (2013) find a significant relationship between travel constraint and
destination image. The authors concluded that travel constraint influences on the
formation of the image destination for young tourists to Brunei. Accordingly, the
research hypothesis proposed is:
10
H4: There is a negative relationship between travel constraint and destination
image.
2.7.5. Travel constraint and destination choice
Several researchers have considered the concept of constraints as inhibitors to
participation in tourism activities (Lee and Tideswell, 2005) and destination choice
(Hong et al., 2006). Research results of Lee and Tideswell (2005), Mao (2008), Srisutto
(2010), Li et al (2011) confirm that different levels of travel constraints are factors
affecting tourists’ destination choice. Accordingly, the research hypothesis proposed is:
H5: There is a negative relationship between travel constraint and destination
choice.
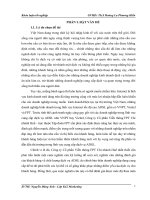
2.8. Research models
2.8.1. Theoretical model
Based on travel behavior theory and the results of the previous studies combined
with the natural characteristics, economic - social characteristics and the typical
population of tourist attractions of the province of Binh Dinh together with the results
from qualitative research and approach from tourists, the author proposes a model of
relationship between tourism motivation, destination image and destination choice of
tourists as follows:
Destination image
H3(+)
H6
H4(-)
Travel constraint
- Demographic characteristics
- Sociological characteristics
H5(-)
Destination choice
H1 (+)
H2(+)
Tourism motivation
Figure 2.6: Theoretical model
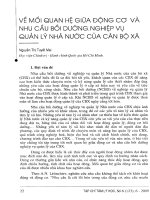
2.8.2. Competition model
According to Nguyen Dinh Tho and Nguyen Thi Mai Trang (2008, page 174),
“competitive model plays an important role in building marketing theory in particular
11
and in social science research in general”. Zaltman et al (1982, page 110) cited in
Nguyen Dinh Tho and Nguyen Thi Mai Trang (2008) say that “Instead of focusing on
testing a model we need to test it with competitive models”. Bagozzi (1984) argues that
we should not wait for testing the competition model in other studies but it has to be
done at the same time in the current study.
Travel constraints, as presented by Kerstetter et al. (2005), are key factors
hindering people from starting or continuing the trip. Through the structural equation
modeling analysis SEM, Alexandris et al (2011) propose a negative relationship
between the constraint and motivation of recreatonal skier. However, the relationship
between these two concepts has not been proposed and tested in the tourism field in any
studies. Most destinations have their own constraints making travel market entry of
tourists becomes more difficult. Wright and Goodale (1991) claim that current
participants may also have constraints, which prevent the participation as often as they
desire. Through qualitative research results, many participants suggest that it is
necessary to add the relationship between travel constraint and tourism motivation
because they think that when tourists find constraints to travel, their tourism motivation
will decrease. Accordingly, the research hypothesis proposed is:
H7: There is a negative relationship between travel constraint and tourism
motivation.
Thereby, a competitive model, shown in Figure 2.7 is recommended:
Destination image
H3(+)
H6
H4(-)
Travel constraint
- Demographic characteristics
- Sociological characteristics
H5(-)
Destination choice
H1 (+)
H7(-)
H2(+)
Tourism motivation
Figure 2.7. Competitive model
12
CHAPTER 3: RESEARCH DESIGN
3.1. Research process
Research objectives
Research model and
draft scales
Research documents
Discovery research
(N1 = 200)
Qualitative research
(Discussion groups
and depth interviews)
Adjust models and
questionnaires
Preliminary
questionnaires
Preliminary quantitative
research (N2 = 200)
Evaluating the
reliability of the scale
Exploratory factor
analysis - EFA
Rejecting variables with
low total correlation (<0.3)
Rejecting variables with
low loading factor (<0.5)
Official
questionnaires
questionnaires
Official quantitative
research (N3= 900)
Evaluating the
reliability of the scale
Exploratory factor
analysis - EFA
Confirmatory factor
analysis - CFA
Structural equation
modeling - SEM
Interview after
quantitative research
(qualitative)
Rejecting variables with
low total correlation (<0.3)
Rejecting variables with
low loading factor (<0.5)
Testing the suitability of the
scale; Composite reliability;
Average variance extracted;
unidirectional, convergence
and discrimination
Testing research models and
hypotheses
Explaining and clarifying
quantitative research results
Discussing research
results and proposing
policy implications
Figure 3.1: Research performance process
13
3.2. Research scale
3.2.1. Results of scale development from preliminary quantitative research
3.2.1.1. Tourism motivation scale
Based on the theory and tourism motivation scale from previous studies,
inheriting research of Hanqin and Lam (1999) and combining with natural, economic,
social characteristics and features of tourist destinations in Binh Dinh province, the
author proposed the tourism motivation concept including five components (with 16
observed variables) namely relaxation, novelty, knowledge, relationship strengthening
and prestige. Through group discussions, the participants agreed with the five
components the author proposed, simultaneously, suggested adjusting one observed
variable. From the group discussion results, the author conducted face to face
interviews and it was proposed that three observed variables be added.
3.2.1.2. Destinations image scale
Initially, inheriting research of Beerli and Martín (2004a) and previous empirical
research, the author proposed six components with 24 properties to measure tourism
destination image, including natural tourist resource; culture, history and art; tourism
environment; general infrastructure; tourism infrastructure and atmosphere. Through
group discussions, the participants agreed with the six components of the destination
image the author proposed, simultaneously, suggested adjusting three observed
variables. From the group discussion results, the author conducted face to face
interviews and it was proposed that two observed variables be added.
3.2.1.3. Travel constraint scale
According to Li et al. (2011), travel constraint scale is identified from a literature
review, personal interview and focus group discussion. Travel constraints have been
studied by some authors (Hsu and Lam, 2003; Lee and Tideswell, 2005; Hong et al.,
2006; Mao, 2008; Sparks and Pan, 2009; Srisutto, 2010; Li et al., 2011). The research
show that, depending on the market and various tourist features, travel constraints may
be differently (Hungarian and Petrick, 2010).
In this study, the travel constraint scale is built on the basis of exploratory
research results in Binh Dinh. The results of the survey are from 200 questionnaires
with the results from previous studies of Crawford and Godbey (1987), Tian et al
14
(1996), Hsu and Lam (2003), Hong et al (2006), and through focus group discussions,
the travel constraint scale should be built based on the items that have the total weight
of attributes over 10% with the statements to be included in the questionnaire.
3.2.1.4. Destinations choice scale
Most of the destination choice scale in previous studies is the binary or category
variable. Thus destination choice scale in this study are discussed based on planned
behavior research of Phetvaroon (2006), destination preference research of Yue (2008)
and adjusted and developed in order to match with destinations in Binh Dinh. The
results show that four observed variables were suggested to be included in the
questionnaire.
3.2.2. Scale testing results in preliminary quantitative research
3.2.2.1. Testing preliminary scale by analyzing Cronbach's Alpha reliability
Reliability analysis results show that all of the variables are reliable with
Cronbach's alpha greater than 0.6. The total correlation of all variables are satisfactory
(> 0.5).
3.2.2.2. Testing scale results by exploring factor analysis (EFA)
EFA analysis results show that two scales of “novelty” and “knowledge” are
combined in one component. Thus, these two concepts are two distinct components in
theory but in reality they can be unidirectional components. If we combine these two
concepts into a unidirectional concept, its Cronbach's alpha is 0.905. In fact, the two
needs of exploring new things and increasing knowledge can complement each other in
the same trip. The following research will retest these results.
15
CHAPTER 4: RESEARCH RESULTS
4.1. Research sample
The official quantitative research was carried out in Binh Dinh province from
December 2014 to July 2015. The total of 671 questionnaires were used for analyzing
and testing.
4.2. Preliminarily evaluation of the official scale
4.2.1. Analyzing Cronbach's Alpha reliability
Similar to preliminary quantitative research, the scales of these concepts
preliminarily evaluated through the Cronbach's alpha reliability are satisfactory. The
results show that the scales reliability is achieved.
4.2.2. Exploring factor analysis (EFA)
From the results of the first EFA, 12 factors from 56 variables were extracted at
Eigenvalue 1.003 with total variance extracted 53.353% > 50%. However, the DCO14
variable has factor loading equal 0.381 lower than 0.5, so we reject DCO14 variable out
of the scale.
From the results of the second EFA, 12 factors from 55 variables were extracted
at Eigenvalue 1.001 with total variance extracted 53.834% > 50%. All variables have
high factor loading (> 0.5) and the difference between the factor loading coefficients are
more than 0.3. The observed variables were kept original factors before EFA.
Reevaluating the “strengthen relationships” scale after rejecting DCO14 variable
through the Cronbach's alpha reliability, it is shown that the scale is satisfactory.
4.3. Testing scale results by confirmatory factor analysis (CFA)
4.3.1. CFA results of multidimensional scales
The multidimensional scales in the model (tourism motivation and destinations
image) are satisfactory.
4.3.2. CFA results of unidimesional scales
The unidimensional scales in the model (travel constraint and destinations
choice) are also satisfactory.
16
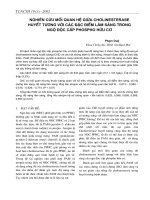
4.3.3. CFA results of all the scales in the same time (saturate model)
CFA results obtained in Figure 4.3: Chi-square = 2863.435; df = 1,414; Chisquare / df = 2,025; GFI = 0.856; TLI = 0.910; CFI = 0.914; RMSEA = 0.039,
demonstrate that the scale of destination choice model is consistent with the market data
and confirm the unidimesional scale.
Figure 4.3: CFA results of saturate model (standardized)
Source: Results from the author’s survey data processing
With regard to the convergence value, the weights λ i of the observed variables in
standardized form (Appendix 8B) all meet the standard (λ i is greater than 0.5 and the
lowest value belong to the HADD8 variable = 0.553) and have statistical significance (p
= 0.00). Regarding the distinction value, the correlation coefficient between the
research concepts are less than 1 (the highest is HADDEN <-> DONGCO = 0.879) and
statistically significant (Table 4.8), which demonstrates that all research concepts in the
saturate model achieves distinguishing values.
Table 4.8: Results of testing the value distinction in the saturate model
Correlation
DONGCO
HADDEN
HADDEN
RAOCAN
DONGCO
HADDEN
<-->
<-->
<-->
<-->
<-->
<-->
RAOCAN
DONGCO
RAOCAN
LUACHON
LUACHON
LUACHON
Estimates
-0,622
0,879
-0,651
-0,647
0,863
0,862
SE =
CR =
2
SQRT ((1- λi )/(n-2)) (1 - λi)/SE
0,021
77,839
0,013
9,536
0,020
81,729
0,020
81,166
0,013
10,190
0,013
10,230
Source: Results from the author’s survey data processing
P-value
0,000
0,000
0,000
0,000
0,000
0,000
17
Testing the reliability of the scales in Table 4.9, it is shown that although the
factors of tourism environment, general infrastructure and atmosphere have not reached
the reliability of variance extracted (<0.5), the scales of all concepts are reliable on both
two standards of the Cronbach's alpha (≥ 0.6) and Composite Reliability (≥ 0,5).
Therefore, we can confirm the scales in the saturate model are satisfactory.
Table 4.9: Results of testing the reliability of scales in the saturate model
No.
1
1.1
1.2
1.3
1.4
2
2.1
2.2
2.3
2.4
2.5
2.6
Component
symbols
DONGCO
THUGIAN
KIENTHUC
QUANHE
UYTIN
HADDEN
TUNHIEN
VANHOA
MTRUONG
HTCHUNG
HTDLICH
BKKHI
Number of
observed
variables
α
4
6
3
3
0,832
0,869
0,792
0,813
0,833
0,876
0,843
0,814
0,556
0,516
0,642
0,595
0,744
0,697
0,800
0,770
3
6
6
4
5
4
0,789
0,872
0,812
0,765
0,864
0,779
0,787
0,857
0,814
0,768
0,866
0,552
0,516
0,422
0,453
0,564
0,781
0,472
0,742
0,696
0,649
0,672
0,750
0,687
Mean λ
Reliability
Worth
ρ
c
ρ
vc
3
RAOCAN
6
0,865
0,865
0,521
0,715
4
LUACHON
4
0,822
0,822
0,536
0,732
Đạt
yêu cầu
Source: Results from the author’s survey data processing
4.4. Testing the research model
4.4.1. Testing the official theory model
The SEM analysis result of theoretical models (Figure 4.4) shown in Figure 4.5:
Chi-square = 3004.756; df = 1415; Chi-square / df = 2,124; GFI = 0.850; TLI = 0.901;
CFI = 0.906; RMSEA = 0.041, demonstrates that the theoretical model is suitable with
market data.
18
Figure 4.5: SEM result of the theoretical model (standardized)
Source: Results from the author’s survey data processing
Table 4:11: Test result of causal relationship between the concepts of theoretical model
(standardized)
DONGCO
--->
HADDEN
Mean
estimate
0,707
RAOCAN
--->
HADDEN
-0,458
HADDEN
--->
TUNHIEN
0,565
DONGCO
--->
THUGIAN
0,479
DONGCO
--->
UYTIN
HADDEN
--->
HADDEN
Relationship
Standard
Critical
Significance
error (S.E.) ratio (C.R.)
level (P)
0,138
6,705
***
0,024
-8,605
***
0,728
0,238
7,995
***
BKKHI
0,671
0,122
9,084
***
--->
HTCHUNG
0,733
0,123
8,872
***
HADDEN
--->
MTRUONG
0,633
0,112
8,567
***
HADDEN
--->
VANHOA
0,491
0,082
7,781
***
HADDEN
--->
HTDLICH
0,665
0,124
9,684
***
DONGCO
--->
QUANHE
0,489
0,258
6,992
***
DONGCO
--->
KIENTHUC
0,274
0,125
4,845
***
HADDEN
--->
LUACHON
0,475
0,153
3,814
***
RAOCAN
--->
LUACHON
-0,243
0,037
-3,729
***
DONGCO ---> LUACHON
***: p < 0,001
0,352
0,186
3,049
0,002
Source: Results from the author’s survey data processing
19
4.4.2. Testing the competitive model
Figure 4.6: SEM results of the competitive model (standardized)
Source: Results from the author’s survey data processing
Table 4:12: Test result of causal relationship between the concepts of competitive model
(standardized)
Relationship
RAOCAN ---> DONGCO
RAOCAN ---> HADDEN
RAOCAN ---> LUACHON
DONGCO ---> HADDEN
DONGCO ---> LUACHON
DONGCO ---> THUGIAN
DONGCO ---> KIENTHUC
DONGCO ---> QUANHE
DONGCO ---> UYTIN
HADDEN ---> LUACHON
HADDEN ---> TUNHIEN
HADDEN ---> VANHOA
HADDEN ---> MTRUONG
HADDEN ---> HTCHUNG
HADDEN ---> HTDLICH
HADDEN ---> BKKHI
***: p < 0,001
Mean
estimate
-0,622
-0,169
-0,112
0,774
0,440
0,491
0,302
0,428
0,737
0,402
0,599
0,524
0,667
0,763
0,698
0,704
Standard
error (S.E.)
0,028
0,037
0,030
0,177
0,298
Critical Significance
ratio (C.R.) level (P)
-8,238
***
-2,306
0,021
-2,306
0,021
6,105
***
2,534
0,011
0,117
0,219
0,214
0,196
5,529
7,001
8,849
2,525
***
***
***
0,012
0,076
0,102
0,112
0,112
0,111
8,479
9,392
9,759
10,703
10,025
***
***
***
***
***
Source: Results from the author’s survey data processing
20
This model has 1414 degrees of freedom with Chi-square statistic value
2863.435 (p = 0.000). Indicators show that this competitive model is also suitable with
the market data (Chi-square = 2863.435; df = 1414; Chi-square / df = 2,025; GFI =
0.856; TLI = 0.910; CFI = .914; RMSEA = 0.039), which demonstrates that the
competitive model is suitable with the market data.
SEM analysis results of both theoretical model and competitive model are
compatible with the market data and the hypotheses are accepted at the 5% level.
However, compared with the theoretical model, there are differences in the competitive
model when comparing the Chi-squared value and the number of degrees of freedom.
Indeed, if we compare the Chi-squared value, the difference of the two models is
141.321 (3004.756 - 2863.435) with one degree of freedom (1415-1414). The result of
the competitive model shows that there are more possible relationships supported by
theory. Also, according to the estimates, squared multiple correlations of destination
choice concept is 0.799, which means that the above concepts explained 79.9% of the
variance of destination choice. More importantly, the hypothesis built in the
competitive model (H7: There is a negative relationship between travel constraint and
tourism motivation.) has statistical significance at p = 0.000 (Table 4.12), so we decide
to accept this hypothesis. Therefore, in this study, the author uses the competitive model
instead of the original theoretical model.
4.4.3. Testing research hypotheses
As presented in Sections 4.2 and 4.3, the results of evaluating scales by
Cronbach's alpha, EFA and CFA demonstrate no changes in the original hypotheses.
The test results of the competitive model (instead of original official theoretical model)
demonstrate that no concept is removed and at the same time, all relationships are
statistically significant at the reliability level of 95%, so we keep the competitive model
(Figure 4.6) with 7 hypotheses: H1, H2, H3, H4, H5, H6, H7 accepted.
4.5. Multigroup analysis
There are differences with statistical significance between both the variable
model and the invariant partial model according to (1) Nationality of tourists (p =
0.004); (2) Length of stay (p = 0.005); (3) Main destinations selected (p = 0.078). The
variable model is chosen in these three cases.
21
4.6. Discussion
4.6.1. The impact level of each factor in the model
In the model about the relationship between tourism motivation, destination
image, travel constraint and destination choice (competitive model), there exist direct
and indirect impacts from travel constraint, tourism motivation, destination image on
destination choice in which tourism motivation and destination image are the two
second-level concepts. The result (Table 4.27) shows that the greatest impact is tourism
motivation (λ = 0.751) followed by travel constraint (λ = -0.647) and finally by
destination image (λ = 0.402).
Table 4:27: The impact of factors on the dependent variables in the model
Dependent
variable
Loại tác
động
Travel constraint
Direct
-0,622
Tourism
Indirect
0
motivation
General
-0,622
Direct
-0,169
Destination
Indirect
-0,481
image
General
-0,65
Direct
-0,112
Destination
Indirect
-0,535
choice
General
-0,647
Source: Author's calculations
Impact factor
Tourism motivation
0
0
0
0,774
0
0,774
0,44
0,311
0,751
Destination image
0
0
0
0
0
0
0,402
0
0,402
4.6.2. The average value of each factor in the model
The average value of each factor in destination choice model determined by the
results of the tourists’ evaluation on the five-level Likert scale discussed in Chapter 3
and tested in section 4.3 is relatively high