Ebook Environmental soil and water chemistry Principles and applications Part 2
Bạn đang xem bản rút gọn của tài liệu. Xem và tải ngay bản đầy đủ của tài liệu tại đây (17.44 MB, 291 trang )
7 Reaction Kinetics in
Soil-Water Systems
7.1
INTRODUCTION
There are many reactions in soil-water systems pertaining to nutrient availability.
contaminant release, and nutrient or contaminant transformations. 1\vo processes
regulating these reactions are chemical equilibria (Chapter 2) and kinetics. The specific
kinetic processes that environmental scientists are concerned with include mineral
dissolution, exchange reactions, reductive or oxidative dissolution, reductive or oxidative precipitation, and enzymatic transformation. This chapter provides a quantitative description of reaction kinetics and outlines their importance in soil-water
systems.
To understand reaction kinetics one needs to understand the difference between
kinetics and equilibria. Generally, equilibria involves forward and reverse reactions
and it is defined as the point at which the rate of the forward reaction equals the rate
of the reverse reaction.
Consider the mineral AB (Reaction 7.1), where A denotes any cation (A+) and B
denotes any anion (B-). Upon introducing H 20, the mineral undergoes solubilization
(forward reaction) until precipitation (reverse reaction) becomes significant enough so
that the two rates (forward and reverse) are equal:
(7.1)
The parameters kf and kb denote rate constants for the forward and reverse reactions,
respectively. Reaction 7.1 demonstrates mineral equilibrium through two elementary
reactions-one describes the forward reaction, while a second describes the reverse
reaction. When the reverse reaction is inhibited, the forward reaction is termed
dissolution (e.g., acid mineral dissolution).
Reaction 7.1 at the equilibrium point is described by
where dA+/dt denotes the rate of the overall reaction, kIAB) describes the rate of the
forward reaction, and kb(A +)(B-) describes the rate of the reverse reaction. At equilibrIum,
272
7.1
273
INTRODUCTION
(7.3)
and
(7.4)
where Keq denotes the equilibrium product constant (note, in the example above Keq
= K sp' see Chapter 2) and the parentheses denote activity. Equilibria constants (Ksp)
are used to predict the concentration of chemical species in solution contributed by a
given solid (assuming the solid's Ksp is known).
Equation 7.4 can also be derived using Gibb's free energy offormation (!J.G f ). Based
on classical thermodynamics (Daniels and Alberty, 1975),
(7.5)
where
!J..G~(X) = Gibbs free energy of formation of ion X at the standard state, 25°C and
1 atm pressure
R = universal gas constant
T = temperature in degrees Kelvin
ax = molar activity of ion X
At equilibrium, !J.Gr = 0 .and !J.G~ = llG~(product~ - !J.G~(reactants)' and the thermodynamic equilibrium constant (Keq) is given by
Keq = exp - (lla? fRY)
(7.6)
where subscript r denotes reaction. By substituting each of the terms describing
reactants and products in Equation 7.1 by Equation 7.5 and introducing the resulting
equations into Equation 7.6,
Based on the above, under standard pressure (1 atm) and temperature (25°C) (isobaric
conditions) and under unit activity of reactants and products, a negative !J.G~ denotes
that the particular reaction will move spontaneously from left to right until an
equilibrium state is met, whereas a positive llG~, also under isobaric conditions and
unit activity of reactants and products, denotes that the particular reaction will not
move spontaneously from left to right. Finally, when !J.Gr equals zero, the particular
reaction will be at equilibrium.
It follows then that the thermodynamic approach makes no reference to kinetics,
while the kinetic approach is only concerned with the point at which the forward
reaction equals the reverse reaction and gives no attention to the time needed to reach
this equilibrium point. In nature, certain chemical events may take a few minutes to
reach equilibrium, while others may take days to years to reach equilibrium; such
phenomena are referred to as hystereses phenomena. For example, exchange reactions
274
REACTION KINETICS IN SOIL-WATER SYSTEMS
involving homovalent cations (forming outer-sphere complexes, e.g., Na+-Lt) may
take only a few minutes to reach equilibrium, whereas exchange reactions involving
heterovalent cations (e.g., Ca2+-K+ in a vermiculitic internal surface where Ca2+ forms
an outer-sphere complex and K+ forms an inner-sphere complex) may require a long
period (e.g., days) to reach equilibrium.
The rate at which a particular reaction occurs is important because it could provide
real-time prediction capabilities. In addition, it could identify a particular reaction in
a given process as the rate-controlling reaction of the process. For example, chemical
mobility in soils, during rain events, is controlled by the rate at which a particular
species desorbs or solubilizes. Similarly, the rate at which a particular soil chemical
biodegrades is controlled by the rate at which the soil chemical becomes available
substrate.
7.2 RATE LAWS
Reaction rates are characterized by rate laws which describe rate dependence on
concentration of reactants. For example, for the monodirectional reaction
A+ B -t C
(7.8)
the reaction rate (dC/dt) can be described by the equation
(7.9)
where the brackets denote the concentration of the reacting species, k denotes the rate
constant, and n denotes the order of the reaction. Assuming that n[ = 1, the reaction is
said to be first-order with respect to [A]. On the other hand, assuming that n2 = 2, the
reaction is second-order with respect to [B]. It is important to note that nj are not the
stoichiometric coefficients of the balanced equation; they are determined experimentally.
In soil-water systems, some of the most commonly encountered rate laws are first-,
secondo, and zero-order. A description of each order is given below.
7.2.1 First-Order Rate Law
Consider the monodirectional elementary reaction
A-tB
(7.10)
dAJdt = -k[A]
(7.11)
expressed by
rearrangmg
275
7.2 RATE LAWS
dAJ[AJ =-dt
Setting [AJ
(7.12)
=Ao at t =to and [AJ =Ai at t =ti,
AI
t.I
f dA/[AJ = -k f dt
(7.13)
and integrating
(7.14)
Assuming that to =0
In[A/AoJ = -kti
(7.15)
or
(7.16)
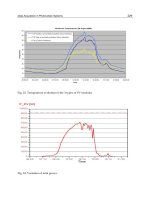
A plot of Ai versus ti would produce a curve with an exponential decay, approaching
[AJ = 0 asymptoticalIy (Fig. 7.1). Taking logarithms to base 10 on both sides of
Equation 7.16 gives
log[AJ = -kt/2.303 + log[AoJ
(7.17)
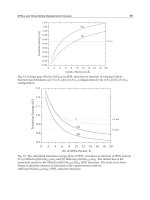
A plot of log[AiJ versus ti would produce a straight line with slope -k/2.303 (Fig. 7.2).
In Equation 7.17, setting [A/AoJ = 0.5 at ti = tll2 and rearranging gives
log[O.5J
=-ktlli2.303
-c
o
u
o
~
0C
·c
o
E
Q)
c:t::
o
~~
o
__
- L_ _~_ _~~~~_ _-L~
50 100 150 200 250300 350 400
Time, min
Figure 7.1. Ideal first-order plot.
(7.18)
276
REACTION KINETICS IN SOIL-WATER SYSTEMS
4
-
High
c
c
u
cQ)
~
C"
C
'c
'0
E
Q)
a::
'---'
C"
SLow
o
50 100 150 200 250300350 400
Time, min
Figure 7.2. Linearized form of the first-order reaction.
and
t1l2
= (-log[0.5])[2.303]/k = 0.693/k
(7.19)
where the term k is in units of rl (e.g., sec-I, min-I, hr- I, or days-I). The term t1/2
represents the time needed for 50% of reactant Ao to be consumed; it is also known as
the half-life of compound A. In the case of a first-order reaction, its half-life is
independent of the original quantity of A (Ao) in the system.
7.2.2 Second-Order Rate Law
Consider the monodirectional bimolecular reaction
(7.20)
Assuming that A =B, its rate can be expressed by
dAidt
=-k[A]2
(7.21)
=-dt
(7.22)
Rearranging
dAl[A]2
Setting [A] = Ao at t = to and [A] = Ai at t = ti
AI
f dA/[A]2
and integrating
= -k
f dt
(7.23)
277
7.2 RATE LAWS
High
"---'--...L.---1_.....t......_L..-..--l.._...L..-----1_....L._L..-..--l..----l
o
40
80
120
160
200
240
Time, min
Figure 7.3. An ideal linear plot for a second-order reaction.
(7.24)
Assuming that to = 0,
(7.2S)
A plot of -1/Aj versus tj would produce a straight line with y intercept -IIAo and slope
minus the second-order rate constant (Fig. 7.3). In Equation 7.2S, setting A j=O.SAo at
tj = t1l2 and rearranging gives
t1l2
= 11k·
An
(7.26)
where k is in units of mass-I. r l (e.g., mol-I. min-I. The term t1l2 represents the time
needed for SO% of reactant Ao to be consumed; it is also known as the half-life of
compound A. In the case of a second-order reaction, its half-life is dependent on the
original quantity of A (Ao) in the system.
7.2.3 Zero-Order Rate Law
Consider the monodirectional reaction
A-tB
(7.27)
dAldt=-k
(7.28)
dA= -k dt
(7.29)
expressed by
Rearranging
278
REACTION KINETICS IN SOIL-WATER SYSTEMS
100
-
U
:J
"0
o
a.
~
0-
c:
·c
·0
E
CI>
0::
OL-------------Time, min
Figure 7.4. Zero-order reaction.
Setting [A]
=Ao at t =to and [A] =Ai at t =ti ,
A1
t1
(7.30)
and integrating
(7.31)
...•,......, 16
14
'0 12
E
III
10
•
...J
,..
.....
0
---
3.5
4.0
8
4.3
,......, 6
~
4
2
0
0
10
20
30
Time, h
40
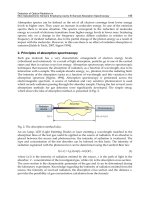
Fjgure 7.5. Linear dissolution kinetics observed for the dissolution of y-Al203 (from Furrer
and Stumm, 1986, with permission).
7.3
APPLICATION OF RATE LAWS
279
Assuming that to = 0, then
(7.32)
A plot of Ai versus ti would produce a straight line with slope -k in units of mass per
unit time (e.g., mol min-I) (Fig. 7.4). In the case of a zero-order reaction, its half-life
is 1I2tf , where tf represents the total time needed to decompose the original quantity
of compound A (AD). Another way to express such reactions is shown in Figure 7.5.
The data show Al release from y-A1 20 3 at different pH values. The data clearly show
that the reaction is zero-order with k dependent on pH.
7.3 APPLICATION OF RATE LAWS
Rate laws are employed to evaluate reaction mechanisms in soil-water systems. To
accomplish this, kinetics are used to elucidate the various individual reaction steps or
elementary reactions. Identifying and quantifying the elementary steps of a complex
process allow one to understand the mechanism(s) of the process. For example,
unimolecular reactions are generally described by first-order reactions; bimolecular
reactions are described by second-order reactions.
When evaluating soil-water processes, one should distinguish the rate of an
elementary chemical reaction from the rate of a process which is commonly the sum
of a number of reactions. For example, the rate of an elementary chemical reaction
depends on the energy needed to make or break a chemical bond. An instrument
capable of measuring the formation or destruction of any given chemical bond could
provide molecular data with mechanistic meanings. Instruments with such capabilities
include nuclear magnetic resonance (NMR), Fourier transform infrared spectroscopy
(FT-IR), and electron spin resonance (ESR). On the other hand, if the end product of
a particular process represents several elementary events, data representing this end
product may not have mechanistic meaning. For example, the rate of exchanging K+
by Ca2+ in AI-hydroxy interlayered vermiculite may involve many processes. These
processes may include partial loss of water by Ca2+, cation diffusion, and cation
exchange. Sorting out the reactions controlling the overall rate process is difficult.
Researchers often overcome such limitations by evaluating kinetic processes using wet
chemistry plus spectroscopic techniques, or through studying the kinetic processes by
varying temperature, pressure, reactant(s), or concentration(s).
One important point to remember when using kinetics to study soil-water processes
is that the apparatus chosen for the study is capable of removing or isolating the end
product as fast as it is produced. A second point is that unimolecular reactions always
produce first-order plots, but fit of kinetic data (representing a process not well
understood) to a first-order plot is no proof that the process is unimolecular. Complementary data (e.g., spectroscopic data) are needed to support such a conclusion. On
the other hand, rate-law differences between any two reaction systems suggest that the
mechanisms involved may represent different elementary reactions.
280
REACTION KINETICS IN SOIL-WATER SYSTEMS
7.3.1 Pseudo First-Order Reactions
Dissolution Kinetics. Pseudo first-order reactions are widely employed in the field of
soil-water environmental science for evaluating physical, chemical, or biochemical
events. A pseudo first-order dissolution example is given below to demonstrate the use
of kinetics in identifying or quantifying minerals in simple or complex systems.
Consider a metal carbonate solid (MC0 3s ) reacting with a strong acid (HCI):
MC0 3s + 2HCI ~ C0 2gas + M2+ + 2Cr + H 20
(7.33)
In the case where HCI > > > MC0 3s ' so that the concentration of HCI does not change
significantly when all MC0 3 is decomposed, the rate of Reaction 7.33 can be expressed
by
dMCO/dt = -k[HCI][MC03s]
(7.34)
Assuming that during acid dissolution the newly exposed MC0 3s surface (S) remains
proportional to the amount of unreacted MC0 3 (Turner, 1959; Turner and Skinner,
1959) such that
(7.35)
where K is an empirical constant. Rearranging Equation 7.34,
dMCO/MC0 3 =-k[HCI]dt
MCqj
(7.36)
I,
f dMC03 /[MC0 3] = -k[HCI]f dt
(7.37)
MC° 30
and integrating,
(7.38)
Assuming that to = 0 and k'
=k[HCI], hence it is pseudo first-order, then
(7.39)
or
(7.40)
or
log[MC0 3i ] = -k't/2.303 + log[MC0 3oJ
(7.41)
7.3
281
APPLICATION OF RATE LAWS
A plot oflog[MC0 3j ] versus tj would produce a straight line with slope -k!12.303. The
half-life (t1/2) can be calculated by
tl/2
=0.693/[(slope)(2.303)]
(7.42)
The above theoretical analysis, however, does not reveal how MC0 3s can be
accurately measured during acid dissolution. One approach would be to measure the
carbon dioxide gas (C0 2gas ) released during acid dissolution ofMC0 3s (Reaction 7.33)
in an air-tight vessel equipped with a stirring system and a transducer to convert
pressure to a continuous electrical signal (Evangelou et aI., 1982). A calibration plot
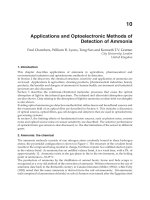
between C0 2gas pressure and grams of MC0 3s (as shown in Fig. 7.6) can then be used
to back-calculate remaining MC0 3s during acid dissolution. The data in Figure 7.7
describe dissolution kinetics of calcite (CaC0 3) and dolomite [(CaMg(C03h]. It is
shown that calcite is sensitive to strong-acid attack, but dolomite is resistant to
strong-acid attack; both minerals appear to obey pseudo first-order reaction kinetics.
In the case where a sample contains calcite plus dolomite, the kinetic data reveal two
consecutive pseudo-first-order reactions (Fig. 7.8). By extrapolating the second slope
(representing dolomite) to the y axis, the quantity of calcite and dolomite in the sample
could be estimated.
Additional information on metal-carbonate dissolution kinetics could be obtained
by evaluating dissolution in relatively weak concentrations of HCI (Sajwan et aI.,
1991). A plot of pseudo first-order rate constants k! (k' = k[HC1]) versus HCI concentration would allow one to estimate first-order constants (k) as HCI ~ 0 by extrapolating the line representing k' to the y axis. Additional pseudo first-order dissolution
examples are shown in Figure 7.9 where the linear form of the pseudo first-order acid
dissolution of kaolinite in two different HCI concentrations is shown.
C/)
.....
'c::J
~
Q)
'E
8
Q)
~
Q)
>
.~
Q)
a:
0
.10
.15
.20
.25
.30
.35
CaC03 . grams
Figure 7.6. Pressure transducer electrical output in response to increases in grams of carbonate
reacted with 5 mol L-1 Hel (from Evangelou et aI., 1984a, with permission).
282
REACTION KINETICS IN SOIL-WATER SYSTEMS
6
5
'"
0
u
N
Dolomite
y= - 0.22t + 5.51
R2 =0.996
4
8
I
0
:E
3
Calcite
y= -4.30t + 5.16
R2:0.998
c
2
2
3
4
5
6
7
Time (min)
Figure 7.7. Rate of dissolution of calcite and dolomite in 5 N HCI. The calcite and dolomite
analyzed were standard reference specimens (from Evangelou et al., 1984a, with permission).
5
y = 4.67 - 0.56 t
Rz' 0.995
4
III
0
u
N
0
u
I
Dolomite
3
0
:E
c
Y = 3.90 -0.28 t
Rz = 0.998
2
Rz= 0.983
o
o
23456789
Time (min)
Figure 7.8. Plots illustrating differential rates of dissolution of calcite and dolomite in two
samples of Mancos shale. Dissolution effected with 5 N HCl (from Evangelou et aI., 1984a,
with permission).
7.3
283
APPLICATION OF RATE LAWS
100
10
(YJ
0
C\J
«
C\J
::>
"0
'Vi
.......
k
Q)
= 0.0216 hr-l
c:
Q)
...
u
Q)
0-
1.0
= 10%
B = 30%
A
= 90°C
T = 90°C
HCI, T
HCI,
.1+-~--r-~~--~-r--r-~~--~-r--r-~--r
o
30
60
120
90
Ti me (hr)
150
180
210
Figure 7.9. Rate of dissolution curves of aluminum from kaolinite in 10 and 30% HCI at 90°C
(from Turner, 1966, with permission).
It is important to note that during pseudo first-order reactions, the concentration of
the reactant responsible for the decomposition must remain constant throughout the
reaction that is, it cannot decrease more than 10% of its original quantity. Thus, pseudo
first-order dissolution reactions can be attained by using excess acids, bases, complexing agents, oxidizing agents, or reducing agents. Mineral dissolution kinetics in nature
may require days or years to reach completion.
Exchange Reactions. Exchange reactions in soils commonly involve monovalentmonovalent (e.g., K+ -NH:) , monovalent-divalent (e.g., K+ -Ca, N a+ -Ca2+), movovalent-trivalent (e.g., K+-AI 3+), or divalent-trivalent (e.g., Ca2+-AI 3+) cations. The
284
REACTION KINETICS IN SOIL-WATER SYSTEMS
notation C~+- C~+ denotes exchange between cations A and B where A represents the
cation in the solution phase (displacing cation) and B represents the cation on the
exchange phase (displaced cation). Consider the heterovalent exchange reaction
kf
ExCa l12 + K+ ¢::> ExK + 112 Ca2+
(7.43)
~
where ExK and ExCa l12 denote exchangeable cations in units of cmole kg-lor
meq/lOO g, Ex denotes the soil exchanger with a charge of 1-, and K+ and Ca2+ denote
solution cations in units of mmol L- I. Reaction 7.43 is composed of at least two
elementary reactions, a forward and a backward elementary reaction.
Reactions such as the one above are studied by first making the soil or clay mineral
homoionic (ExCa) by repeatedly washing it with a solution of CaCl2 (approximately
1 mole L -I) and then rinsing the sample with H 20. The homoionic soil or clay material
is then spread as a fine film on a filter in a filter holder. A solution of KCl, at a preset
concentration, is pumped at a constant rate (e.g., 1 mL min-I) through the homoionic
clay. Effluent is collected with respect to time using a fraction collector. The technique,
known as miscible displacement, permits the study of any elementary forward or
backward reactions using any appropriate homoionic soil or clay mineral with an
appropriate displacing solution. A number of procedures and apparati are available to
study kinetics of exchange reactions in soils (Sparks, 1995 and references therein).
The rate of the forward reaction (Reaction 7.43) can be expressed by
(7.44)
where k is the rate constant in units of rl. Assuming that during cation exchange K+
is kept constant, Equation 7.44 can be expressed as
-dExCalliExCa1l2 = k' dt
(7.45)
where k' = k[K+]. Setting the appropriate boundary conditions and integrating,
In [(1 - ExCall2t)/ExCa1l2=] = -k't
(7.46)
or
(7.47)
and
log [(1- ExCa ll2t)/ExCa l12=]
=-k't/2.303
(7.48)
A plot oflog[1 - ExCa 1l2/ExCl\I2=] versus t would produce a straight line with slope
-k/2.303. Commonly, cation exchange reactions may take a few minutes to a few hours
to reach completion depending on degree of diffusion.
Figure 7.10. Influence of Ca and K concentration on the desorption of K and Ca, respectively,
with respect to time - (vermiculite < 2 Ilm) (from Evangelou, 1997, unpublished data, with
permission).
The data in Figure 7.1 0 describe the forward and reverse reactions of Ca2+- K+
exchange kinetics in vermiculite. These data clearly show that the exchange process,
as expected, is dependent on the concentration of the exchanging cation. Linearized
pseudo first-order plots of Ca2+-K+ and K+ _Ca2+ exchange in vermiculite are shown
in Figure 7.11. These plots exhibit two slopes. An interpretation of the two-slope
system in Figure 7.11 is that there are two consecutive pseudo first-order reactions.
The justification for such a conclusion is that the forward and reverse exchange
reactions in vermiculite are not simple elementary reactions. This is because the
286
REACTION KINETICS IN SOIL-WATER SYSTEMS
o~--------------------
__________
Vermiculite
Co - K
~
a
-0.5
",,' -1.0
><
~
'£
~ -1.5
I
~
=
.E
o
0.50mM CoCI 2
t::. 2.50mM CeCI2
-2.0
o
10.0 mM CoCI2
50
100
150
200
250
300
350
400
Time (min)
O~~~---------------,~~~-,
'N
Vermiculite
K - Co
b
-0.5
-,~
-1.0
cO
()
><
UJ
;:.. -1.5
o
~
cO
()
I mM KCI
t::. 5 mMKCI
il:'i -2.0
I
o
20mM KCI
.E -2.5
-3.0 '-------J'------'---=l3-I____---L____-1-____..J
o
100
200
300
400
500
600
Time (min)
Figure 7.11. Pseudo first-order plots of Caz+-K+ and K+-Ca exchange under three different
concentrations of CaCl z and KCl, respectively, in vermiculite (from Evangelou, 1996, unpublished data, with permission).
surface of vermiculite is rather complex and many elementary reactions are involved
in the cation exchange process.
Vermiculite possesses internal and external surfaces and K+ may diffuse faster than
z
Ca + in the internal (interlayer) surface due to the ability ofK+ to decrease its hydration
sphere by loosing some of its water molecules, which are held with less energy than
the water molecules held by Caz+ (Bohn et aI., 1985). On the other hand, diffusion of
Caz+ and K+ in the external surfaces does not appear to be limiting. The decision to
conclude that the two slopes in Figure 7.11 represent two pseudo first -order reactions
7.3
287
APPLICATION OF RATE LAWS
t{')
0.8
ci
IJ.."
-
0.6
0
IJ..I_
""0 ""0
"
0.4
Q.l
o
0
a::
0.2
Cd
Mg
0.20
0.30
0.40
0.50
c/r2
Figure 7.12. Relationship between rate of exchange and c/fl (from Keay and Wild, 1961, with
permission).
is based on the fact that the complexities of the vermiculitic surface are well known.
If this information was not known, the only conclusion one could have drawn was that
pseudo first-order reactions do not describe heterovalent cation exchange reactions.
In 2: 1 clay minerals (e.g., vermiculite) the rate of cation exchange depends on the
ionic potential (c/?, c denotes charge of the cation and r denotes ionic radius) of the
cations involved. Cation exchange data show that c/? is inversely related to the rate
of cation exchange (Fig. 7.12). The reason for this relationship is that the higher the
ionic potential of an ion, the lower its entropy of activation, or the higher the energy
by which hydration-sphere water is held (Bohn et aI., 1985). Generally, cations that
hold water tightly exhibit low diffusion potential in clay interlayer water.
7.3.2 Reductive and Oxidative Dissolution
Reductive Dissolution. Many substances in nature contain the same metal or metalloid, but under different oxidation states. For example, the metalloid arsenic may exist
as arsenite (AsIII, As0 3) or arsenate (AsIV, As0 4) in the forms of ferrous-arsenite or
ferric-arsenate, respectively. Ferrous-arsenite is more soluble than ferric-arsenate; for
this reason, one may be interested in studying the kinetics of arsenate reduction to
arsenite. Similar chemistry applies to all elements present in soil-water systems with
more than one oxidation state (e.g., iron, manganese, selenium, and chromium).
Reductive dissolution kinetics ofMn0 2 (MnIV) and MnOOH (Ml'.III) are presented
below for demonstration purposes. The chemistry of manganese in nature is rather
complex because three oxidation states are involved [Mn(II), Mn(III), and Mn(IV)]
and form a large number of oxides and oxyhydroxides with various degrees of
chemical stability (Bricker, 1965; Parc et aI., 1989; Potter and Rossman, 1979a,b). One
288
REACTION KINETICS IN SOIL-WATER SYSTEMS
may characterize the chemical stability of the various manganese oxides through
pseudo first-order dissolution. This can be done by reacting manganese oxides with
concentrated H 2S04 plus hydrogen peroxide (H 20 2). Under strong acid conditions,
H 20 2 acts as a manganese reductant (electron donor). In the case of Mn0 2 , reductive
dissolution is given by
(7.49)
and in the case of MnOOH, reductive dissolution is given by
(7.50)
The two reactions above could be quantified by either measuring the concentration of
Mn 2+ with respect to time or recording 02 gas evolution with respect to time.
Reduction-dissolution kinetics of manganese-oxides in excess H 20 2 plus H 2S04
(assuming complete Mn-oxide surface coverage by the reductant, irreversible electron
transfer, and instantaneous product release) can be expressed by
-d[Mn-oxide]/[dt] = k'[Mn-oxide]
(7.51)
where Mn-oxide denotes Mn02 or MnOOH, k' =k[H 20 2][H 2S0 4 ] denotes the pseudo
first-order rate constant, and brackets denote concentration. Rearranging and integrating Equation 7.51 using appropriate boundary conditions gives
log([Mn-oxide ]/[Mn-oxide ]0) =-(k'/2.303)t
(7.52)
where [Mn-oxide]o represents the initial total Mn-oxide in the system and [Mn-oxide]
represents the quantity of Mn-oxide at any time t. A plot of log([Mn-oxide]/[Mnoxide]o) versus t provides a straight-line relationship with slope -k'l2.303.
The data in Figure 7.13 show reductive-dissolution kinetics of various Mn-oxide
minerals as discussed above. These data obey pseudo first-order reaction kinetics and
the various manganese-oxides exhibit different stability. Mechanistic interpretation
of the pseudo first-order plots is difficult because reductive dissolution is a complex
process. It involves many elementary reactions, including formation of a Mn-oxideH 20 2 complex, a surface electron-transfer process, and a dissolution process. Therefore, the fact that such reactions appear to obey pseudo first-order reaction kinetics
reveals little about the mechanisms of the process. In nature, reductive dissolution of
manganese is most likely catalyzed by microbes and may need a few minutes to hours
to reach completion. The abiotic reductive-dissolution data presented in Figure 7.13
may have relative meaning with respect to nature, but this would need experimental
verification.
Oxidative Dissolution. This is a process highly applicable to metal-sulfides. In general, under reducing conditions metal sulfides are insoluble solids. However, sulfide
converts to sulfate (SO4) under oxidative conditions and the metal-sulfate salts formed
are relatively soluble (Singer and Stumm, 1970).
289
7.3 APPLICATION OF RATE LAWS
4.50
I:..
~
.----,
-0-
0
~
~
C\J
0
c:
~
4.25
~
r
C\J
~
c:
~
~
c:
...J
o Mn02
~
0
4.00 r-
,
D.
q
b-Mn02
o MnOOH
4I
3.75
0
1.0
I
I
I
2.0
3.0
4.0
5.0
Time (min)
Figure 7.13. Pseudo first-order Mn-oxide reductive dissolution (from Sajwan et aI., 1994, with
permission).
Oxidative dissolution of metal-sulfides (e.g., pyrite, FeS 2) is a complex process
involving surface adsorption of the oxidant (Fe 3+, 02)' surface electron transfer, and
surface product formation and detachment. The overall oxidation process, without
considering the detailed mechanisms, is demonstrated below using pyrite (FeS 2)
(Evangelou, 1995b):
(7.53)
or
(7.54)
Both reactions (Reactions 7.53 and 7.54) oxidize pyrite and take place simultaneously,
while the reaction responsible for regenerating Fe 3+ is
(7.55)
Based on Reactions 7.53 and 7.54, the rate of pyrite oxidation can be expressed by
(7.56)
The parameters 02 and Fe3+ refer to partial pressure and concentration, respectively,
kj refers to rate constants, and S denotes surface area. The exponents Vj are experimentally determined (Daniels and Alberty, 1975). Considering that the rate of FeS 2
oxidation by 02 is slow relative to that by Fe3+, and Fe2+ oxidation by 02 is slower
than the rate ofFeS 2 oxidation by Fe3+, the latter (Fe2+ oxidation) is the pyrite oxidation
290
REACTION KINETICS IN SOIL-WATER SYSTEMS
rate-controlling process. This was demonstrated by Singer and Stumm (1970) and
Moses et al. (1987).
According to Reaction 7.55, the rate of Fe2+ oxidation is given by
(7.57)
Singer and Stumm (1970) demonstrated that at pH less than 3.5, Equation 7.57 takes
the form of
(7.58)
where k' denotes apparent rate constant. Equation 7.58 reveals that the rate of Fe 2+
oxidation at pH less than 3.5 is independent of pH and first order with respect to Fe 2+
and O 2 (Fig. 7.14). Thus, under the conditions stated above, the rate of Fe 2+ oxidation
is directly related to its concentration and partial pressure of bimolecular oxygen.
However, at pH higher than 3.5, the rate expression for Fe 2+ oxidation, according to
Singer and Stumm (1970), is of the form
(7.59)
Equation 7.59 reveals that Fe 2+ oxidation is first order with respect to Fe 2+ and O2 and
second order with respect to OH- (Fig. 7.14).
Solution Fe3+ at pH higher than 3.5 would be controlled by the solubility of
Fe(OH)3s
(7.60)
The solubility of Fe(OH)3s is described by
Fe(OH)3s ¢::> Fe3+ + 30W
(7.61)
and
(7.62)
where Ksp is the solubility product constant of Fe(OH)3s' Introducing Equation 7.62
into Equation 7.56 gives
(7.63)
According to Equation 7.63, abiotic FeS 2 oxidation is controlled by pH. As pH
decreases (OH- decreases), free Fe 3+ in solution increases; consequently, pyrite
oxidation increases. At low pH (pH < 4), FeS 2 oxidation is catalyzed by bacteria
(Evangelou, 1995b) (see Chapter 6).
Experimental data show that no single model describes kinetics of pyrite oxidation
because of the large number of variables controlling such process. These variables
include crystallinity, particle size, mass to surface ratio, impurities, type and nature of
7.3
291
APPLICATION OF RATE LAWS
Or---~--~----~---r---.r---~
-1.0
-2.0
-3.0
.....
- d log [FIZ+]
k· •
dt
[02]. 0.20 Atm .
Temp • 25•C
~
I
c:
-4.0
- d log [FI2+]
E
~
tlO
,[
-~d:-"t"---- • k 02
~
]
-5.0
0
....J
o
-6.0
-7.0
-8.0
-9.0
2
3
4
5
6
7
pH
Figure 7.14. Relationship between Fe oxidation rate (k) and pH (from U.S. Government
Publication, 1969).
impurities, crystal imperfections, presence/absence of other minerals or organics, ionic
strength, pH, Fe3+lFe 2+ ratio, type of oxidant, presence or absence of potentially
determining ions, and nature of reaction products formed (Evangelou, 1995b).
7.3.3 Oxidative Precipitation or Reductive Precipitation
Oxidative Precipitation. This is a process that describes precipitation of metals, such
as Fe2+ or Mn2+, through oxidation. Oxidative precipitation is complex, involving
various mechanisms. In general, however, it can be viewed as a two-step process and
is demonstrated on Mn 2+ below using unbalanced equations. The first step involves a
slow reaction that generates a solid surface:
292
REACTION KINETICS IN SOIL-WATER SYSTEMS
(7.64)
The second step involves a faster surface-catalyzed reaction:
(7.65)
The following rate law has been suggested (Stumm and Morgan, 1981):
(7.66)
where
(7.67)
and
(7.68)
Quantifying Reactions 7.64 and 7.65 requires fixing the pH and partial pressure of 02
(p02) at some predetermined value and providing OH- upon demand. This is accomplished with a pH-stat technique. The technique utilizes a pH electrode as a sensor so
that as OH- is consumed, (during Mn 2+ oxidation), the instrument measures the rate
of OH- consumption and activates the autoburete to replace the consumed OH-. It is
assumed that for each OH- consumed, an equivalent amount of Mn2+ is oxidized.
The data in Figure 7.15 demonstrate kinetics of Mn 2+ oxidation using the pH-stat
technique. The data show at least two major slopes. The first slope (near the origin)
represents Reaction 7.64, whereas the second slope represents the autocatalytic part of the
reaction (Reaction 7.65). The data demonstrate that the reaction is pH-dependent. As pH
increases, the autocatalytic part of the reaction represents the mechanism by which
most Mn2+ oxidizes. Similar reactions for Fe2+ are shown in Figure 7.16. Note that
Fe 2+ oxidizes at a much lower pH than Mn 2+.
Reductive Precipitation. Reductive precipitation involves the production of reduced
species with limited solubility. An example of reductive precipitation in the environment involves the reduction of S04 to H 2S and the precipitation of metals as metalsulfides. In nature, the process of reductive precipitation is mostly microbiological!;
controlled. Production of H 2S is the rate-controlling reaction of metal-sulfide precipitate formation.
(7.69
since Reaction 7.69 is known to be faster than S04 reduction. Such reductive precipitation reactions are known to reach completion within minutes to hours, depending or:
the degree of diffusion needed for the reactants to meet.
7.3
293
APPLICATION OF RATE LAWS
1"',
0
--.
~
~.i.&
-0.5
2
--
C-
-' -1.5
Dc
•
0
•
~
•
~
a
•
a
a
•
a
a
•
~
•
•
•
•
•
8.75
a
•
0
8.24
a
•
0
8.24
• 8.50
.. 8.75
a
•
a
•
o 8.50
a
•
~
.~
6-
OJ
0
.~
.~
-1
pH
a 10
•••
1
.~
.
• i.
•
.
!~
C
\
a••
a
a
a
•
0
a
Minutes
Figure 7.15. Pseudo first-order Mn 2+ oxidation under various pH values at p02 of 0.2 in
duplicate using a pH-stat technique (from Evangelou, unpublished data).
o ~-,--"".....~P~H:.6~.6
pH 6.9
-1
pH 7.2
o
40 50
Time (min)
Figure 7.16. Pseudo first-order Mn 2+ oxidation under various pH values at p02 of 0.2 in
duplicate using a pH-stat technique (from Stumm and Morgan, 1970, with permission).
294
REACTION KINETICS IN SOIL-WATER SYSTEMS
7.3.4 Effect of Ionic Strength on Kinetics
Reaction kinetics are known to be affected by ionic strength via two mechanisms. One
mechanism is physical in nature and is related to the magnitude of ionic strength,
whereas the second mechanism is considered chemical and is related to the charge of
the ions. The two mechanisms affecting reaction rate can be explained by considering
that
(7.70)
and
(7.71)
where kexp denotes experimental rate constant under a given ionic strength, kid denotes
rate constant at infinite dilution, and YA' YB denote activity coefficients of ions A and
B, respectively. Taking logarithms on both sides of Equation 7.71 and using the
Debuy-Huckle limiting law to express activity coefficients,
(7.72)
then
(7.73)
Considering that
ZAB
=ZA + ZB
(7.74)
by substituting Equation 7.74 into Equation 7.73,
log (kex/kid ) = A(l)ll2{
-zi - z~ + (ZA + ZB)2}
(7.75)
Collecting terms, and replacing A with 0.5, gives
log(kex/kid) =
1.0ZAZB(l)1I2
(7.76)
A plot of log(kex/kid ) versus (/)112 would produce a straight line with slope ZAZE'
Benson (1982) pointed out that when one of the Zi values in Equation 7.76 is zero, the
ionic strength would not have any influence on the reaction rate. When one of the z.
values is negative and the other is positive, the influence of ionic strength on the
reaction rate should be negative, whereas when both Zi values are positive or negative.
the influence of ionic strength on reaction rates should be positive. It follows that two
factors (with respect to z) control the role of ionic strength on reaction rate constants.
The first factor is the absolute magnitude of Zi' and the second factor is the sign of z:
The statements above are demonstrated in Figure 7.17.
Millero and Izaguirre (1989) examined the effect various anions have on the abiotic
oxidation rate of Fe 2+ at constant ionic strength (/ = 1.0) and found that this effect was
on the order of HC03" > Br- > N0 3 - > CIOc > Cl- > SO~- > B(OH); (see also Fig.
7.18). Strong decrease in the rate of Fe2+ oxidation due to the addition of S02- and
7.3
295
APPLICATION OF RATE LAWS
0.6
0.4
.:2
-3
"
-{
)(
0.2
01
IV
0
-0.2
-0.4
-0.6 '--_ _ _...I..-_ _ _- L -_ _ _-'----J
0.1
o
0.2
0.3
rl/2
I: [Co(NH3)sBr)]2+ + Hg2+ ~ [Co(NH 3)s(H 20)]3+ + (HgBr)+
II: S203 + 1- ~ ?[IS0 4 + SOa-] ~ 13 + 2S0a- (not balanced)
III: [02N-N-COOEt]- + OW ~ N20 + CO~- + EtOH
IV: cane sugar + H+ ~ invert sugar (hydrolysis reaction)
V: H 20 2 + Be ~ H20 + 1/2Br2 (not balanced)
VI: [Co(NH3)sBr)]2+ + OH- ~ [Co(NH3)S(OH)]2+ + BrVII: Fe2+ CO(C 20 4 ~ Fe 3+ + CO(C204)1-
)t
Figure 7.17. The effect of ionic strength on the rates of some ionic reactions (from Benson,
1982, with permission).
B(OH)c pairs was attributed to the formation ofFeSO~ and Fe[B(04H)4t pairs which
they assumed were difficult to oxidize. They also reported that the oxidation of Fe 2+
is first-order with respect to HC03. This HC03dependence of Fe 2+ oxidation could
be related to the formation of an FeHCO; pair which has a faster rate of oxidation than
the Fe(OH)~ pair.
7.3.5 Determining Reaction Rate Order
An approach to establish rate order for an experimental data set is as follows: Consider
the generalized reaction
A~
products
(7.77)
296
REACTION KINETICS IN SOIL-WATER SYSTEMS
16.5
•
•
16.0
15.5
•
.:a:
c>
.3
0
0
•
•
0
•
0
•
15.0
NoBr
NoN03
+ N02S04
NoHC03
t:::. NOB(OH}4
0
+
•
•
+
14.5
+
14.0
0
0.2
0.4
0.6
0.8
1.0
[X]
Figure 7.18. The effect of anions (X) on the oxidation of Fe(II) in NaCI-NaX solutions at I
1 and 25°C (from Millero and Izaguirre, 1989, with permission).
=
The rate function is given by
-dNdt = k[A]n
(7.78)
Taking logarithms on both sides of the equation,
10g[-dNdt] = log k + 10g[A]n
(7.79)
=log k + nlog[A]
(7.80)
or
10g[-dNdt]
If a plot of log [-dNdt] versus 10g[A] is a straight line, the slope of the line is the
reaction order with respect to A. Figure 7.19 represents Mn2+ oxidation at pH 8.5 and
p02 0.2 obtained by pH-stat technique. The technique utilizes a pH electrode as a
sensor so that as OH- is consumed (during Mn 2+ oxidation), the instrument measures
the rate of OH- consumption and activates the autoburete to replace the consumed
OH-. It is assumed that for each OH- consumed, an equivalent amount of Mn2+ is
oxidized. These pH-stat data clearly show that the first part of the oxidation of
manganese is zero-order, whereas the second part is first-order. Keep in mind, however,
that these particular reaction orders are strictly empirical and without necessarily any
mechanistic meaning.