SI r10 ch28
Bạn đang xem bản rút gọn của tài liệu. Xem và tải ngay bản đầy đủ của tài liệu tại đây (591.97 KB, 13 trang )
This file is licensed to Abdual Hadi Nema (). License Date: 6/1/2010
Related Commercial Resources
CHAPTER 28
METHODS OF PRECOOLING FRUITS,
VEGETABLES, AND CUT FLOWERS
Product Requirements ..............................................................
Calculation Methods................................................................
COOLING METHODS ............................................................
Hydrocooling ...........................................................................
Forced-Air Cooling ..................................................................
Forced-Air Evaporative Cooling..............................................
28.1
28.1
28.3
28.3
28.6
28.8
Package Icing ........................................................................... 28.8
Vacuum Cooling ....................................................................... 28.9
Selecting a Cooling
Method................................................................................ 28.11
Cooling Cut Flowers .............................................................. 28.11
Symbols .................................................................................. 28.11
RECOOLING is the rapid removal of field heat from freshly
harvested fruits and vegetables before shipping, storage, or processing. Prompt precooling inhibits growth of microorganisms that
cause decay, reduces enzymatic and respiratory activity, and reduces
moisture loss. Thus, proper precooling reduces spoilage and retards
loss of preharvest freshness and quality (Becker and Fricke 2002).
Precooling requires greater refrigeration capacity and cooling
medium movement than do storage rooms, which hold commodities
at a constant temperature. Thus, precooling is typically a separate
operation from refrigerated storage and requires specially designed
equipment (Fricke and Becker 2003). Precooling can be done by
various methods, including hydrocooling, vacuum cooling, air cooling, and contact icing. These methods rapidly transfer heat from the
commodity to a cooling medium such as water, air, or ice. Cooling
times from several minutes to over 24 hours may be required.
Commercially important fruits that need immediate precooling
include apricots; avocados; all berries except cranberries; tart cherries; peaches and nectarines; plums and prunes; and tropical and
subtropical fruits such as guavas, mangos, papayas, and pineapples.
Tropical and subtropical fruits of this group are susceptible to chilling injury and thus need to be cooled according to individual temperature requirements. Sweet cherries, grapes, pears, and citrus fruit
have a longer postharvest life, but prompt cooling is essential to
maintain high quality during holding. Bananas require special ripening treatment and therefore are not precooled. Chapter 21 lists
recommended storage temperatures for many products.
PRODUCT REQUIREMENTS
The refrigeration capacity needed for precooling is much
greater than that for holding a product at a constant temperature or
for slow cooling. Although it is imperative to have enough refrigeration for effective precooling, it is uneconomical to have more than
is normally needed. Therefore, heat load on a precooling system
should be determined as accurately as possible.
Total heat load comes from product, surroundings, air infiltration, containers, and heat-producing devices such as motors, lights,
fans, and pumps. Product heat accounts for the major portion of
total heat load, and depends on product temperature, cooling rate,
amount of product cooled in a given time, and specific heat of the
product. Heat from respiration is part of the product heat load, but
it is generally small. Chapter 24 discusses how to calculate the
refrigeration load in more detail.
Product temperature must be determined accurately to calculate
heat load accurately. During rapid heat transfer, a temperature gradient develops in the product, with faster cooling causing larger gradients. This gradient is a function of product properties, surface heat
transfer parameters, and cooling rate. Initially, for example, hydrocooling rapidly reduces the temperature of the exterior of a product,
but may not change the center temperature at all. Most of the product mass is in the outer portion. Thus, calculations based on center
temperature would show little heat removal, though, in fact, substantial heat has been extracted. For this reason, the product massaverage temperature must be used for product heat load calculations
(Smith and Bennett 1965).
The product cooling load can then be calculated as
Licensed for single user. © 2010 ASHRAE, Inc.
P
During postharvest handling and storage, fresh fruits and vegetables lose moisture through their skins through transpiration. Commodity deterioration, such as shriveling or impaired flavor, may
result if moisture loss is high. To minimize losses through transpiration and increase market quality and shelf life, commodities must
be stored in a low-temperature, high-humidity environment. Various skin coatings and moisture-proof films can also be used during
packaging to significantly reduce transpiration and extend storage
life (Becker and Fricke 1996a).
Metabolic activity in fresh fruits and vegetables continues for a
short period after harvest. The energy required to sustain this activity comes from respiration, which involves oxidation of sugars to
produce carbon dioxide, water, and heat. A commodity’s storage
life is influenced by its respiratory activity. By storing a commodity
at low temperature, respiration is reduced and senescence is delayed, thus extending storage life. Proper control of oxygen and
carbon dioxide concentrations surrounding a commodity is also
effective in reducing the respiration rate (Becker and Fricke 1996a).
Product physiology, in relation to harvest maturity and ambient
temperature at harvest time, largely determines precooling requirements and methods. Some products are highly perishable and must
begin cooling as soon as possible after harvest; examples include
asparagus, snap beans, broccoli, cauliflower, sweet corn, cantaloupes, summer squash, vine-ripened tomatoes, leafy vegetables,
globe artichokes, brussels sprouts, cabbage, celery, carrots, snow
peas, and radishes. Less perishable produce, such as white potatoes,
sweet potatoes, winter squash, pumpkins, and mature green tomatoes, may need to be cured at a higher temperature. Cooling of these
products is not as important; however, some cooling is necessary if
ambient temperature is high during harvest.
The preparation of this chapter is assigned to TC 10.9, Refrigeration Application for Food and Beverages.
CALCULATION METHODS
Heat Load
Q = mcp(ti – tma)
where m is the mass of product being cooled, cp is the product’s specific heat, ti is the product’s initial temperature, and tma is the product’s final mass average temperature. Specific heats of various fruits
and vegetables can be found in Chapter 19.
28.1
Copyright © 2010, ASHRAE
(1)
This file is licensed to Abdual Hadi Nema (). License Date: 6/1/2010
28.2
2010 ASHRAE Handbook—Refrigeration (SI)
Precooling Time Estimation Methods
Efficient precooler operation involves (1) proper sizing of refrigeration equipment to maintain a constant cooling medium temperature, (2) adequate flow of the cooling medium, and (3) proper product
residence time in the cooling medium. Thus, to properly design a
precooler, it is necessary to estimate the time required to cool the
commodities from their initial temperature (usually the ambient temperature at harvest) to the final temperature, just before shipping and/
or storage. For a specified cooling medium temperature and flow rate,
this cooling time dictates the residence time in the precooler that is required for proper cooling (Fricke and Becker 2003).
Accurate estimations of precooling times can be obtained by
using finite-element or finite-difference computer programs, but the
effort required makes this impractical for the design or process engineer. In addition, two- and three-dimensional simulations require
time-consuming data preparation and significant computing time.
Most research to date has been in the development of semianalytical/
empirical precooling time estimation methods that use simplifying
assumptions, but nevertheless produce accurate results.
Licensed for single user. © 2010 ASHRAE, Inc.
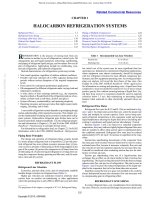
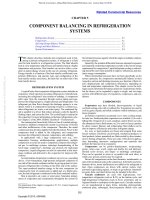
Fractional Unaccomplished Temperature Difference
All cooling processes exhibit similar behavior. After an initial
lag, the temperature at the food’s thermal center decreases exponentially (see Chapter 20). As shown in Figure 1, a cooling curve
depicting this behavior can be obtained by plotting, on semilogarithmic axes, the fractional unaccomplished temperature difference Y
[Equation (2)] versus time (Fricke and Becker 2004).
t – tm
tm – t
Y = -------------- = -------------tm – ti
ti – tm
(2)
where tm is the cooling medium temperature, ti is the initial commodity temperature, and t is the commodity final mass average temperature. This semilogarithmic temperature history curve consists
of an initial curvilinear portion, followed by a linear portion. Simple
empirical formulas that model this cooling behavior, such as halfcooling time and cooling coefficient, have been proposed for estimating the cooling time of fruits and vegetables.
Half-Cooling Time
A common concept used to characterize the cooling process is the
half-cooling time, which is the time required to reduce the temperature difference between the commodity and the cooling medium by
half (Becker and Fricke 2002). This is also equivalent to the time
Fig. 1
Typical Cooling Curve
required to reduce the fractional unaccomplished temperature difference Y by half.
The half-cooling time is independent of initial temperature and
remains constant throughout the cooling period as long as the cooling medium temperature remains constant (Becker and Fricke 2002).
Therefore, once the half-cooling time has been determined for a
given commodity, cooling time can be predicted regardless of the
commodity’s initial temperature or cooling medium temperature.
Product-specific nomographs have been developed, which, when
used in conjunction with half-cooling times, can provide estimates
of cooling times for fruits and vegetables (Stewart and Couey 1963).
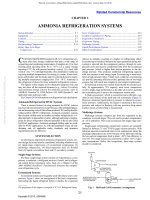
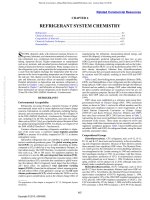
In addition, a general nomograph (Figure 2) was constructed to
calculate hydrocooling times of commodities based on their halfcooling times (Stewart and Couey 1963). In Figure 2, product temperature is plotted along the vertical axis versus time measured in
half-cooling periods along the horizontal axis. At zero time, the
product temperature is the initial commodity temperature; at infinite
time, product temperature equals water temperature. To use Figure
2, draw a straight line from the initial commodity temperature at
zero time (left axis) to the commodity temperature at infinite time
[i.e., the water temperature (right axis)]. Then draw a horizontal line
at the final commodity temperature (left and right axes). The intersection of these two lines determines the number of half-cooling
periods required (bottom axis). Multiply the half-cooling time for
the particular commodity by the number of half-cooling periods to
obtain the hydrocooling time.
The following example illustrates the use of the general nomograph for determining hydrocooling time.
Example 1. Assume that topped radishes with a half-cooling time of 2.2
min are to be hydrocooled using 0°C water. How long would it take to
hydrocool the radishes from 27°C to 10°C?
Solution. Using the general nomograph in Figure 2, draw a straight line
from 27°C on the left to 0°C on the right. Then draw a horizontal line at
the final commodity temperature, 10°C. These lines intersect at 1.4
half-cooling periods. Multiply this by the half-cooling time (2.2 min) to
obtain the total hydrocooling time of 3.1 min.
Using nomographs can be time consuming and cumbersome,
however. Cooling time of fruits and vegetables may be determined
without the use of nomographs by using the half-cooling time Z:
– Z ln Y
= --------------------ln 2
(3)
Values of half-cooling times for the hydrocooling of numerous
commodities have been reported (Bennett 1963; Dincer 1995;
Dincer and Genceli 1994, 1995; Guillou 1958; Nicholas et al. 1964;
O’Brien and Gentry 1967; Stewart and Couey 1963). Tables 1 to 3
summarize half-cooling time data for a variety of commodities.
Fig. 2
ods
General Nomograph to Determine Half-Cooling Peri-
Fig. 2 General Nomograph to Determine Half-Cooling Periods
Fig. 1 Typical Cooling Curve
(Stewart and Couey 1963)
This file is licensed to Abdual Hadi Nema (). License Date: 6/1/2010
Methods of Precooling Fruits, Vegetables, and Cut Flowers
Table 1 Half-Cooling Times for Hydrocooling of
Various Commodities
Commodity
Artichoke
Asparagus
Broccoli
Brussels
sprouts
Cabbage
Licensed for single user. © 2010 ASHRAE, Inc.
Carrots,
topped
Cauliflower,
trimmed
Celery
Sweet corn,
in husks
Peas,
in pod
Potatoes
Radishes
topped
Tomatoes
Commodity
Size
Container
None (completely exposed)
Crate, lid off, paper liner
Medium Completely exposed
Lidded pyramid crate,
spears upright
Completely exposed
Crate with paper liner, lid off
Crate without liner, lid off
Completely exposed
Carton, lid open
Jumble stack (230 mm deep)
Completely exposed
Carton, lid open
Jumble stack (four layers)
Large
Completely exposed
23 kg mesh bag
Completely exposed
2 Dozen Completely exposed
Crate, lidded, paper liner
5 Dozen Completely exposed
Wirebound corn crate, lidded
Completely exposed (flood)
35 L basket, lid off (flood)
35 L basket, lidded
(submersion)
Completely exposed
Jumble stack
(five layers, 230 mm deep)
Completely exposed
Crate, lid off, three layers of
bunches, 230 mm deep
Carton, lid open, three layers of
bunches, 230 mm deep
Completely exposed
Jumble stack (230 mm deep)
Completely exposed
Jumble stack, five layers,
255 mm deep
Half-Cooling
Time, min.
8
12
1.1
2.2
linear portion of the semilogarithmic cooling curve to the ln(Y ) axis;
the intersection is the lag factor j.
By substituting Y = 0.5 into Equation (4), which corresponds to
the half-cooling time, cooling coefficient C can be related to halfcooling time Z as follows:
ln 2 j
Z = ---------------C
(5)
Cooling coefficients have been reported by Dincer (1995, 1996),
Dincer and Genceli (1994, 1995), Henry and Bennett (1973), and
Henry et al. (1976) for hydrocooling and hydraircooling (see the
Cooling Methods section for discussion of these methods) various
commodities, as summarized in Tables 2 to 4.
2.1
2.2
3.1
4.4
4.8
6.0
69
81
81
3.2
4.4
7.2
Other Semianalytical/Empirical Precooling Time
Estimation Methods
Chapter 20 discusses various semianalytical/empirical methods
for predicting cooling times of regularly and irregularly shaped
foods. These cooling time estimation methods are grouped into two
main categories: those based on (1) f and j factors (for either regular
or irregular shapes), and (2) equivalent heat transfer dimensionality.
5.8
9.1
20
28
1.9
2.8
3.5
Numerical Techniques
Becker and Fricke (1996b, 2001) and Becker et al. (1996a,
1996b) developed a numerical technique for determining cooling
rates as well as latent and sensible heat loads caused by bulk refrigeration of fruits and vegetables. This computer model can predict
commodity moisture loss during refrigerated storage and the temperature distribution within the refrigerated commodity, using a
porous media approach to simulate the combined phenomena of
transpiration, respiration, airflow, and convective heat and mass
transfer. Using this numerical model, Becker et al. (1996b) found
that increased airflow decreases moisture loss by reducing cooling
time, which quickly reduces the vapor pressure deficit between the
commodity and surrounding air, thus lowering the transpiration
rate. They also found that bulk mass and airflow rate were of primary importance to cooling time, whereas relative humidity had little effect on cooling time.
11
11
1.1
1.9
1.4
1.6
2.2
10
11
COOLING METHODS
The principal methods of precooling are hydrocooling, forcedair cooling, forced-air evaporative cooling, package icing, and vacuum cooling. Precooling may be done in the field, in central cooling
facilities, or at the packinghouse.
Source: Stewart and Couey (1963).
Cooling Coefficient
Cooling time may also be predicted using the cooling coefficient
C. As shown in Figure 1, the cooling coefficient is minus the slope
of the ln(Y ) versus time curve, constructed on a semilogarithmic
axis from experimental observations of time and temperature
(Becker and Fricke 2002). The cooling coefficient indicates the
change in the fractional unaccomplished temperature difference per
unit cooling time (Dincer and Genceli 1994). The cooling coefficient depends on the commodity’s specific heat and thermal conductance to the surroundings (Guillou 1958). Using the cooling
coefficient for a particular cooling process, cooling time may be
estimated as
Y
1- ln -- = – --- -
C j
28.3
(4)
The lag factor j is a measure of the time between the onset of
cooling and the point at which the slope of the ln(Y ) versus curve
becomes constant [i.e., the time required for the ln(Y ) versus curve
to become linear]. The lag factor j can be found by extending the
HYDROCOOLING
In hydrocooling, commodities are sprayed with chilled water, or
immersed in an agitated bath of chilled water. Hydrocooling is effective and economical; however, it tends to produce physiological and
pathological effects on certain commodities; therefore, its use is limited (Bennett 1970). In addition, proper sanitation of the hydrocooling water is necessary to prevent bacterial infection of commodities.
Commodities that are often hydrocooled include asparagus, snap
beans, carrots, sweet corn, cantaloupes, celery, snow peas, radishes,
tart cherries, and peaches. Cucumbers, peppers, melons, and early
crop potatoes are sometimes hydrocooled. Apples and citrus fruits
are rarely hydrocooled. Hydrocooling is not popular for citrus fruits
because of their long marketing season; good postharvest holding
ability; and susceptibility to increased peel injury, decay, and loss of
quality and vitality after hydrocooling.
Hydrocooling is rapid because the cold water flowing around the
commodities causes the commodity surface temperature to essentially equal that of the water (Ryall and Lipton 1979). Thus, the
resistance to heat transfer at the commodity surface is negligible.
This file is licensed to Abdual Hadi Nema (). License Date: 6/1/2010
28.4
2010 ASHRAE Handbook—Refrigeration (SI)
Table 2 Lag Factors, Cooling Coefficients, and Half-Cooling Times for Hydrocooling Various Fruits and Vegetables
Commodity
and Size
Cucumbers
l = 0.16 m
d = 0.038 m
Temperature, °C
Initial
Final
22
4
Water
Licensed for single user. © 2010 ASHRAE, Inc.
21.5
Peaches
d = 0.056 m
21
4
Pears
d = 0.06 m
22.5
4
1.0
Cooling
Half-Cooling
Coefficient C,
Time
–1
s
Z, s
Reference
Crate
Load, kg
Lag Factor
j
5
10
15
20
5
10
15
20
1.291
1.177
1.210
1.251
1.037
1.228
1.222
1.237
0.001 601
0.001 567
0.001 385
0.001 243
0.001 684
0.001 675
0.001 629
0.001 480
546.6
592.3
638.2
737.6
432.9
536.4
548.5
612.1
Dincer and Genceli 1994
50
5
10
15
20
1.077
1.109
1.195
1.206
0.000 822
0.000 794
0.000 870
0.000 770
933.9
1003
1011
1143
Dincer 1995
50
5
20
1.067
1.113
0.001 585
0.001 201
50
5
10
15
20
5
20
1.119
1.157
1.078
1.366
1.076
1.366
0.001 434
0.001 419
0.001 296
0.001 151
0.001 352
0.001 151
50
0.5
Eggplant
l = 0.142 m
d = 0.045 m
Water
Flow Rate,
mm/s
50
2
50
2
0
5
20
1.122
1.171
0.003 017
0.002 279
Dincer 1995
Dincer 1996
561.6
591.0
592.8
873.1
Dincer and Genceli 1995
Dincer 1996
Plums
d = 0.037 m
22
Squash
l = 0.155 m
d = 0.046 m
21.5
0.5
50
5
10
15
20
1.172
1.202
1.193
1.227
0.001 272
0.001 186
0.001 087
0.001 036
669.6
739.8
799.9
866.6
Dincer 1995
Tomatoes
d = 0.07 m
21
0.5
50
5
10
15
20
5
20
1.209
1.310
1.330
1.322
1.266
1.335
0.001 020
0.000 907
0.000 800
0.000 728
0.000 953
0.000 710
865.4
1062
1222
1336
Dincer 1995
4
50
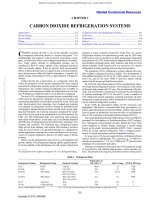
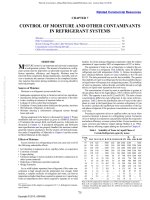
Fig. 3 Schematic of Shower Hydrocooler
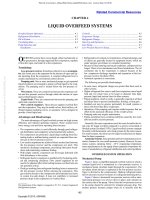
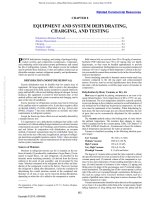
Fig. 4
Dincer 1996
Dincer 1996
Schematic of Immersion Hydrocooler
Fig. 4 Schematic of Immersion Hydrocooler
Fig. 3
Schematic of Shower Hydrocooler
(USDA 2004)
(USDA 2004)
The rate of internal cooling of the commodity is limited by the rate
of heat transfer from the interior to the surface, and depends on the
commodity’s volume in relation to its surface area, as well as its
thermal properties. For example, Stewart and Lipton (1960) showed
a substantial difference in half-cooling time for sizes 36 and 45 cantaloupes. A weighted average of temperatures taken at different
depths showed that 20 min was required to half-cool size 36 melons
and only 10 min for size 45.
Hydrocooling also has the advantage of causing no commodity
moisture loss. In fact, it may even rehydrate slightly wilted product
(USDA 2004). Thus, from a consumer standpoint, the quality of
hydrocooled commodities is high; from the producer’s standpoint,
the salable mass is high. In contrast, other precooling methods such
as vacuum or air cooling may lead to significant commodity moisture loss and wilting, thus reducing product quality and salable
mass.
Commodities may be hydrocooled either loose or in packaging
(which must allow for adequate water flow within and must tolerate
contact with water without losing strength). Plastic or wood containers are well suited for use in hydrocoolers. Corrugated fiberboard
containers can be used in hydrocoolers, if they are wax-dipped to
withstand water contact (USDA 2004).
Types of Hydrocoolers
Hydrocooler designs can generally be divided into two categories: shower-type and immersion. In a shower hydrocooler, the
commodities pass under a shower of chilled water (Figure 3), which
This file is licensed to Abdual Hadi Nema (). License Date: 6/1/2010
Methods of Precooling Fruits, Vegetables, and Cut Flowers
28.5
Table 3 Cooling Coefficients and Half-Cooling Times for Hydraircooling Sweet Corn and Celery
Commodity Crate Type
Sweet corn
Spray Nozzle
Type
Water Flow
Rate, m 3/s
Airflow Rate,
m 3/s
Cooling
Coefficient C, s –1
Coarse
0.340
0.340
0.208
0.378
0.303
0.190
0.190
0.378
0.378
0.378
0.378
0.378
0.946
1.513
0.378
0.303
0.378
0.378
0.378
0.151
0
0
0
0
0
0
—
0
—
28
45
78
0
0
0
0
28
45
78
0
0.000 347
0.000 444
0.000 642
0.000 336
0.000 406
0.000 406
0.000 414
0.000 492
0.000 542
0.000 447
0.000 486
0.000 564
0.000 464
0.000 567
0.173
0.173
0.173
0.173
0.173
0.173
0.173
0.173
0.173
57
119
183
51
99
142
51
113
145
Wirebound
Medium
Flood pan
Coarse
Medium
Licensed for single user. © 2010 ASHRAE, Inc.
Flood pan
Celery
Vacuum-cooling
Hydrocooling
Well-ventilated
Table 4 Cooling Coefficients for Hydrocooling Peaches
Hydrocooling
Method
Water Flow
Flood, peaches 12.2 m3/(h·m2)
in 26.5 L
24.4 m3/(h·m2)
baskets
36.7 m3/(h·m2)
Immersion
4.54 m3/h
9.09 m3/h
4.54 m3/h
9.09 m3/h
13.6 m3/h
Water
Temp.,
°C
Fruit Temp., °C
Initial
Final
Cooling
Coefficient,
s –1
1.67
1.67
4.44
7.22
1.67
7.22
12.8
1.67
1.67
7.22
7.22
7.22
31.1
29.4
27.8
27.8
32.5
31.7
31.2
29.4
29.4
31.2
30.0
30.0
8.22
6.44
9.28
9.50
4.11
10.5
14.4
6.39
5.56
9.67
9.33
10.4
0.001 05
0.001 11
0.000 941
0.001 44
0.001 83
0.001 74
0.001 39
0.001 23
0.001 37
0.001 68
0.001 72
0.001 30
Source: Bennett (1963).
is typically achieved by flooding a perforated pan with chilled
water. Gravity forces the water through the perforated pan and over
the commodities. Shower hydrocoolers may have conveyors for
continuous product flow, or may be operated in batch mode. Water
flow rates typically range from 6.8 to 13.6 L/s per square metre of
cooling area (Bennett et al. 1965; Boyette et al. 1992; Ryall and Lipton 1979). Immersion hydrocoolers (Figure 4) consist of large,
shallow tanks that contain agitated, chilled water. Crates or boxes of
commodities are loaded onto a conveyor at one end of the tank,
travel submerged along the length of the tank, and are removed at
the opposite end. For immersion hydrocooling, a water velocity of
75 to 100 mm/s is suggested (Bennett 1963; Bennett et al. 1965).
In large packing facilities, flooded ammonia refrigeration systems are often used to chill hydrocooling water. Cooling coils are
Half-Cooling
Time, s
Reference
Henry and Bennett 1973
2170
1730
1570
1440
1220
1290
Henry et al. 1976
3710
2360
2310
1890
1790
1390
2170
1490
1050
Henry et al. 1976
placed directly in a tank through which water is rapidly circulated.
Refrigerant temperature inside the cooling coils is typically –2°C,
producing a chilled-water temperature of about 1°C. Because of the
high cost of acquiring and operating mechanical refrigeration units,
they are typically limited to providing chilled water for medium- to
high-volume hydrocooling operations.
Smaller operations may use crushed ice rather than mechanical
refrigeration to produce chilled water. Typically, large blocks of ice
are transported from an ice plant to the hydrocooler, and then
crushed and added to the hydrocooler’s water reservoir. The initial
cost of an ice-cooled hydrocooler is much less than that of one using
mechanical refrigeration. However, for an ice-cooled hydrocooler
to be economically viable, a reliable source of ice must be available
at a reasonable cost (Boyette et al. 1992).
Variations on Hydrocooling
Henry and Bennett (1973) and Henry et al. (1976) describe
hydraircooling, in which a combination of chilled water and chilled
air is circulated over commodities. Hydraircooling requires less water for cooling than conventional hydrocooling, and also reduces the
maintenance required to keep the cooling water clean. Cooling rates
equal to, and in some cases better than, those obtained in conventional unit load hydrocoolers are possible.
Robertson et al. (1976) describe a process in which vegetables are
frozen by direct contact with aqueous freezing media. The aqueous
freezing media consists of a 23% NaCl solution. Freezing times of
less than one minute were reported for peas, diced carrots, snow peas,
and cut green beans, and a cost analysis indicated that freezing with
aqueous freezing media was competitive to air-blast freezing.
Lucas and Raoult-Wack (1998) note that immersion chilling and
freezing using aqueous refrigerating media have the advantage of
shorter process times, energy savings, and better food quality compared to air-blast chilling or freezing. The main disadvantage is
This file is licensed to Abdual Hadi Nema (). License Date: 6/1/2010
28.6
absorption of solutes from the aqueous solution by food. Immersion
chilling or freezing with aqueous refrigerating media can be applied
to a broad range of foods, including pork, fish, poultry, peppers,
beans, tomatoes, peas, and berries.
As an alternative to producing chilled water with mechanical refrigeration or ice, well water can be used, provided that the water
temperature is at least 5.6 K lower than that of the product to be
cooled. However, the well water must not contain chemicals and biological pollutants that could render the product unsuitable for human consumption (Gast and Flores 1991).
Hydrocooler Efficiency
Licensed for single user. © 2010 ASHRAE, Inc.
Hydrocooling efficiency is reduced by heat gain to the water
from surrounding air. Other heat sources that reduce effectiveness
include solar loads, radiation from hot surfaces, and conduction
from the surroundings. Protection from these sources enhances efficiency. Energy can also be lost if a hydrocooler operates at less than
full capacity or intermittently, or if more water than necessary is
used (Boyette et al. 1992).
To increase hydrocooler energy efficiency, consider the following factors during design and operation (Boyette et al. 1992):
• Insulate all refrigerated surfaces and protect the hydrocooler from
wind and direct sunlight.
• Use plastic strip curtains on both the inlet and outlet of conveyor
hydrocoolers to reduce infiltration heat gain.
• Operate the hydrocooler at maximum capacity.
• Consider using thermal storage, in which chilled water or ice is
produced and stored during periods of low energy demand and is
subsequently used along with mechanical refrigeration to chill
hydrocooling water during periods of peak energy demand. Thermal storage reduces the size of the required refrigeration equipment and may decrease energy costs.
• Use an appropriately sized water reservoir. Because energy is
wasted when hydrocooling water is discarded after operation, this
waste can be minimized by not using an oversized water reservoir.
On the other hand, it may be difficult to maintain consistent hydrocooling water temperature and flow rate with an undersized
water reservoir.
Hydrocooling Water Treatment
The surface of wet commodities provides an excellent site for
diseases to thrive. In addition, because hydrocooling water is recirculated, decay-producing organisms can accumulate in the hydrocooling water and can easily spread to other commodities being
hydrocooled. Thus, to reduce the spread of disease, hydrocooling
water must be treated with mild disinfectants.
Typically, hydrocooling water is treated with chlorine to minimize the levels of decay-producing organisms (USDA 2004). Chlorine (gaseous, or in the form of hypochlorous acid from sodium
hypochlorite) is added to the hydrocooling water, typically at the
level of 50 to 100 ppm. However, chlorination only provides a surface treatment of the commodities; it is not effective at neutralizing
an infection below the commodity’s surface.
The chlorine level in the hydrocooling water must be checked at
regular intervals to ensure that the proper concentration is maintained. Chlorine is volatile and disperses into the air at a rate that
increases with increasing temperature (Boyette et al. 1992). Furthermore, if ice cooling is used, melting in the hydrocooling water
dilutes the chlorine in solution.
The effectiveness of chlorine in the hydrocooling water strongly
depends on the water’s pH, which should be maintained at 7.0 for
maximum effectiveness (Boyette et al. 1992).
To minimize debris accumulation in the hydrocooling water, it
may be necessary to wash commodities before hydrocooling. Nevertheless, hydrocooling water should be replaced daily, or more often if
necessary. Take special care when disposing of hydrocooling water,
2010 ASHRAE Handbook—Refrigeration (SI)
because it often contains high concentrations of sediment, pesticides,
and other suspended matter. Depending on the municipality, hydrocooling water may be considered an industrial wastewater and, thus,
a hydrocooler owner may be required to obtain a wastewater discharge permit (Boyette et al. 1992). In addition to daily replacement
of hydrocooling water, shower pans and/or debris screens should be
cleaned daily, or more often if necessary, for maximum efficiency.
FORCED-AIR COOLING
Theoretically, air cooling rates can be comparable to hydrocooling under certain conditions of product exposure and air temperature. In air cooling, the optimum value of the surface heat transfer
coefficient is considerably smaller than in cooling with water.
However, Pflug et al. (1965) showed that apples moving through a
cooling tunnel on a conveyer belt cool faster with air at 6.7°C
approaching the fruit at 3 m/s than they would in a water spray at
1.7°C. For this condition, they calculated an average film coefficient
of heat transfer of 41 W/(m2 ·K). They noted that the advantage of
air is its lower temperature and that, if water were reduced to 1°C,
the time for water cooling would be less. Note, however, that air
temperatures could be more difficult to manage without specifically
fine control below 1°C.
In tests to evaluate film coefficients of heat transfer for anomalous shapes, Smith et al. (1970) obtained an experimental value of
37.8 W/(m2 ·K) for a single Red Delicious apple in a cooling tunnel
with air approaching at 8 m/s. At this airflow rate, the logarithmic
mean surface temperature of a single apple cooled for 0.5 h in air at
6.7°C is approximately 1.7°C. The average temperature difference
across the surface boundary layer is, therefore, 8.4 K and the rate of
heat transfer per square metre of surface area is
q/A = 37.8 8.4 = 318 W/m2
For these conditions, the cooling rate compares favorably with that
obtained in ideal hydrocooling. However, these coefficients are
based on single specimens isolated from surrounding fruit. Had the
fruit been in a packed bed at equivalent flow rates, the values would
have been less because less surface area would have been exposed to
the cooling fluid. Also, the evaporation rate from the product surface significantly affects the cooling rate.
Because of physical characteristics, mostly geometry, various
fruits and vegetables respond differently to similar treatments of airflow and air temperature. For example, in a packed bed under similar conditions of airflow and air temperature, peaches cool faster
than potatoes.
Surface coefficients of heat transfer are sensitive to the physical
conditions involved among objects and their surroundings. Soule
et al. (1966) obtained experimental surface coefficients ranging from
50 to 68 W/(m2 ·K) for bulk lots of Hamlin oranges and Orlando
tangelos with air approaching at 1.1 to 1.8 m/s. Bulk bins containing
450 kg of 72 mm diameter Hamlin oranges were cooled from 27°C
to a final mass-average temperature of 8°C in 1 h with air at 1.7 m/s
(Bennett et al. 1966). Surface heat transfer coefficients for these tests
averaged slightly above 62 W/(m2 ·K). On the basis of a log mean air
temperature of 6.7°C, the calculated half-cooling time was 970 s.
By correlating data from experiments on cooling 70 mm diameter oranges in bulk lots with results of a mathematical model, Baird
and Gaffney (1976) found surface heat transfer coefficients of 8.5
and 51 W/(m2 ·K) for approach velocities of 0.055 and 2.1 m/s,
respectively. A Nusselt-Reynolds heat transfer correlation representing data from six experiments on air cooling of 70 mm diameter
oranges and seven experiments on 107 mm diameter grapefruit,
with approach air velocities ranging from 0.025 to 2.1 m/s, gave the
relationship Nu = 1.17Re0.529, with a correlation coefficient of
0.996.
Ishibashi et al. (1969) constructed a staged forced-air cooler that
exposed bulk fruit to air at a progressively declining temperature
This file is licensed to Abdual Hadi Nema (). License Date: 6/1/2010
Methods of Precooling Fruits, Vegetables, and Cut Flowers
Licensed for single user. © 2010 ASHRAE, Inc.
Fig. 5 Serpentine Forced-Air Cooler
Fig. 5 Serpentine Forced-Air Cooler
(10, 0, and 10°C) as the fruit was conveyed through the cooling
tunnel. Air approached at 3.6 m/s. With this system, 65 mm diameter citrus fruit cooled from 25°C to 5°C in 1 h. Their half-cooling
time of 0.32 h compares favorably with a half-cooling time of 0.30 h
for similarly cooled Delicious apples at an approach air velocity of
2 m/s (Bennett et al. 1969). Perry and Perkins (1968) obtained a
half-cooling time of 0.5 h for potatoes in a bulk bin with air
approaching at 1.3 m/s, compared to 0.4 h for similarly treated
peaches and 0.38 h for apples. Optimum approach velocity for this
type of cooling is in the range of 1.5 to 2 m/s, depending on conditions and circumstances.
Commercial Methods
Produce can be satisfactorily cooled (1) with air circulated in
refrigerated rooms adapted for that purpose, (2) in rail cars using
special portable cooling equipment that cools the load before it is
transported, (3) with air forced through the voids of bulk products
moving through a cooling tunnel on continuous conveyors, (4) on
continuous conveyors in wind tunnels, or (5) by the forced-air
method of passing air through the containers by pressure differential. Each of these methods is used commercially, and each is suitable for certain commodities when properly applied. Figure 5 shows
a schematic of a serpentine forced-air cooler.
In circumstances where air cannot be forced directly through
the voids of products in bulk, using a container type and load pattern that allow air to circulate through the container and reach a
substantial part of the product surface is beneficial. Examples of
this are (1) small products such as grapes and strawberries that
offer appreciable resistance to airflow through voids in bulk lots,
(2) delicate products that cannot be handled in bulk, and (3) products that are packed in shipping containers before precooling.
Forced-air or pressure cooling involves definite stacking patterns
and baffling of stacks so that cooling air is forced through, rather
than around, individual containers. Success requires a container
with vent holes in the direction air will move and a minimum of
packaging materials that would interfere with free air movement
through the containers. Under these conditions, a relatively small
pressure differential between the two sides of the containers results
in good air movement and excellent heat transfer. Differential pressures in use are about 60 to 750 Pa, with airflows ranging from 1 to
3 L/s per kilogram of product.
28.7
Because cooling air comes in direct contact with the product
being cooled, cooling is much faster than with conventional room
cooling. This gives the advantage of rapid product movement
through the cooling plant, and the size of the plant is one-third to
one-fourth that of an equivalent cold room type of plant.
Mitchell et al. (1972) noted that forced-air cooling usually cools
in one-fourth to one-tenth the time needed for conventional room
cooling, but it still takes two to three times longer than hydrocooling
or vacuum cooling.
A proprietary direct-contact heat exchanger cools air and maintains high humidities using chilled water as a secondary coolant and
a continuously wound polypropylene monofilament packing. It
contains about 24 km of filament per cubic metre of packing section. Air is forced up through the unit while chilled water flows
downward. The dew-point temperature of air leaving the unit equals
the entering water temperature. Chilled water can be supplied from
coils submerged in a tank. Build-up of ice on the coils provides an
extra cooling effect during peak loads. This design also allows an
operator to add commercial ice during long periods of mechanical
equipment outage.
In one portable, forced-air method, refrigeration components are
mounted on flatbed trailers and the warm, packaged produce is
cooled in refrigerated transport trailers. Usually the refrigeration
equipment is mounted on two trailers: one holds the forced-air evaporators and the other holds compressors, air-cooling condensers, a
high-pressure receiver, and electrical gear. The loaded produce
trailers are moved to the evaporator trailer and the product is cooled.
After cooling, the trailer is transported to its destination.
Effects of Containers and Stacking Patterns
Accessibility of the product to the cooling medium, essential to
rapid cooling, may involve both access to the product in the container and to the individual container in a stack. This effect is evident in the cooling rate data of various commodities in various types
of containers reported by Mitchell et al. (1972). Parsons et al. (1972)
developed a corrugated paperboard container venting pattern for
palletized unit loads that produced cooling rates equal to those from
conventional register stacked patterns. Fisher (1960) demonstrated
that spacing apple containers on pallets reduced cooling time by
50% compared to pallet loads stacked solidly. A minimum of 5%
sidewall venting is recommended.
Palletization is essential for shipment of many products, and
pallet stability improves if cartons are packed closely together.
Thus, cartons and packages should be designed to allow ample airflow though the stacked products. Amos et al. (1993) and Parsons
et al. (1972) showed the importance of vent sizes and location to
obtain good cooling in palletized loads without reducing container
strength. Some operations wrap palletized products in polyethylene to increase stability. In this case, the product may need to be
cooled before it is palletized.
Moisture Loss in Forced-Air Cooling
The information in this section is drawn from Thompson et al.
(2002).
Moisture loss in forced-air cooling ranges from very little to
amounts significant enough to damage produce. Factors that affect
moisture loss include product initial temperature and transpiration
coefficient, humidity, exposure to airflow after cooling, and whether
waxes or moisture-resistant packaging is used.
High initial temperature results in high moisture loss; this can be
minimized by harvesting at cooler times of day (i.e., early morning
or night), and cooling (or at least shading) products immediately
after harvest. Keep reheat during packing to a minimum.
The primary advantage of high humidity during cooling is that
product packaging can absorb moisture, which reduces the packaging’s absorption of moisture from the product itself.
This file is licensed to Abdual Hadi Nema (). License Date: 6/1/2010
28.8
2010 ASHRAE Handbook—Refrigeration (SI)
Licensed for single user. © 2010 ASHRAE, Inc.
Fig. 6 Engineering-Economic Model Output
for a Forced-Air Cooler
Fig. 6
Engineering-Economic Model Output for Forced-Air Cooler
High transpiration coefficients also increase moisture loss. For
example, carrots, with a high transpiration rate, can lose 0.6 to 1.8%
of their original, uncooled weight during cooling. Polyethylene
packaging has reduced moisture loss in carrots to 0.08%, although
cooling times are about five times longer. Film box liners, sometimes
used for packing products with low transpiration coefficients (e.g.,
apples, pears, kiwifruit, and grapes), are also useful in reducing
moisture loss, but they also increase the time required to cool products. Some film box liners are perforated to reduce condensation; liners used to package grapes must also include an SO2-generating pad
to reduce decay.
To prevent exposing product to unnecessary airflow, forced-air
coolers should reduce or stop airflow as soon as the target product
temperature is reached. Otherwise, moisture loss will continue unless
the surrounding air is close to saturation. One method is to link cooler
fan control to return air plenum temperature, slowing fan speeds as
the temperature of the return air approaches that of the supply air.
Computer Solution
Baird et al. (1988) developed an engineering economic model for
designing forced-air cooling systems. Figure 6 shows the type of
information that can be obtained from the model. By selecting a set
of input conditions (which varies with each application) and varying
approach air velocity, entering air temperature, or some other variable, the optimum (minimum-cost) value can be determined. The
curves in Figure 6 show that selection of air velocity for containers
is critical, whereas selection of entering air temperature is not as
critical until the desired final product temperature of 4°C is approached. The results shown are for four cartons deep with a 4%
vent area in the direction of airflow, and they would be quite different if the carton vent area was changed. Other design parameters
that can be optimized using this program are the depth of product in
direction of airflow and the size of evaporators and condensers.
FORCED-AIR EVAPORATIVE COOLING
This approach cools air with an evaporative cooler, passing air
through a wet pad before it comes into contact with product and
packaging, instead of using mechanical refrigeration. A correctly
designed and operated evaporative cooler produces air a few
degrees above the outside wet-bulb temperature, at high humidity
(about 90% rh), and is more energy-efficient than mechanical refrigeration (Kader 2002). In most of California, for instance, product
temperatures of 16 to 21°C can be achieved. This method is suited
for products that are best held at moderate temperatures, such as
tomatoes, or for those that are marketed soon after harvest.
For more information on evaporative cooling equipment and
applications, see Chapter 51 of the 2007 ASHRAE Handbook—
HVAC Applications, and Chapter 40 of the 2008 ASHRAE Handbook—HVAC Systems and Equipment.
PACKAGE ICING
Finely crushed ice placed in shipping containers can effectively
cool products that are not harmed by contact with ice. Spinach, collards, kale, brussels sprouts, broccoli, radishes, carrots, and green
onions are commonly packaged with ice (Hardenburg et al. 1986).
Cooling a product from 35 to 2°C requires melting ice equal to 38%
of the product’s mass. Additional ice must melt to remove heat leaking into the packages and to remove heat from the container. In addition to removing field heat, package ice can keep the product cool
during transit.
Pumping slush ice or liquid ice into the shipping container
through a hose and special nozzle that connect to the package is
used for cooling some products. Some systems can ice an entire pallet at one time.
Top icing, or placing ice on top of packed containers, is used occasionally to supplement another cooling method. Because corrugated
containers have largely replaced wooden crates, use of top ice has
decreased in favor of forced-air and hydrocooling. Wax-impregnated
corrugated containers, however, allow icing and hydrocooling of
products after packaging.
Flaked or crushed ice can be manufactured on site and stored in
an ice bunker for later use; for short-season cooling requirements
with low ice demands (e.g., a few tonnes a day), it may be more
economical to buy block ice and crush it on site. Another option is
to rent liquid ice equipment for on-site production.
The cooling capacity of ice is 335 kJ/kg; 1 kg of ice will reduce the
temperature of 3 kg of produce by approximately 28 K. However,
commercial ice-injection systems require significantly more ice
beyond that needed for produce cooling. For example, 20 kg of broccoli requires about 32 kg of manufactured ice (losses occur in product
This file is licensed to Abdual Hadi Nema (). License Date: 6/1/2010
Methods of Precooling Fruits, Vegetables, and Cut Flowers
cooling, transport, and equipment heat gain; also, a remainder of ice
is required in the box on delivery to the customer). The high ice
requirement makes liquid icing energy-inefficient and expensive
(Thompson et al. 2002). Other disadvantages of ice cooling include
(1) mass of the ice, which decreases the net product mass in a vehicle;
(2) the need for water-resistant packaging to prevent water damage to
other products; and (3) safety hazards during storage. These disadvantages can be minimized if ice is used for temperature maintenance
in transit rather than for cooling, or by using gel-pack ice (often used
for flowers), which is sealed in a leakproof bag.
Licensed for single user. © 2010 ASHRAE, Inc.
VACUUM COOLING
Vacuum cooling of fresh produce by rapid evaporation of water
from the product works best with vegetables having a high ratio of
surface area to volume and a high transpiration coefficient. In vacuum refrigeration, water, as the primary refrigerant, vaporizes in a
flash chamber under low pressure. Pressure in the chamber is lowered to the saturation point corresponding to the lowest required
temperature of the water.
Vacuum cooling is a batch process. The product to be cooled is
loaded into the flash chamber, the system is put into operation, and
the product is cooled by reducing the pressure to the corresponding
saturation temperature desired. The system is then shut down, the
product removed, and the process repeated. Because the product is
normally at ambient temperature before it is cooled, vacuum cooling
can be thought of as a series of intermittent operations of a vacuum
refrigeration system in which water in the flash chamber is allowed
to come to ambient temperature before each start. The functional
relationships for determining refrigerating capacity are the same in
each case.
Cooling is achieved by boiling water, mostly off the surface of the
product to be cooled. The heat of vaporization required to boil the
water is furnished by the product, which is cooled accordingly. As
pressure is further reduced, cooling continues to the desired temperature level. The saturation pressure for water at 100°C is 101.3 kPa;
at 0°C, it is 0.610 kPa. Commercial vacuum coolers normally operate in this range.
Although the cooling rate of lettuce could be increased without
danger of freezing by reducing the pressure to 0.517 kPa, corresponding to a saturation temperature of –2°C, most operators do not
reduce the pressure below that which freezes water because of the
extra work involved and the freezing potential.
28.9
the product, physical characteristics of the product, and amount of
product surface water available. Although it is possible for some
vaporization to occur in intercellular spaces beneath the product surface, most water is vaporized off the surface. The heat required to
vaporize this water is also taken off the product surface, where it flows
by conduction under the thermal gradient produced. Thus, the rate of
cooling depends on the relation of surface area to volume of product
and the rate at which the vacuum is drawn in the flash chamber.
Because water is the sole refrigerant, the amount of heat removed from the product depends on the mass of water vaporized mv
and its latent heat of vaporization L. Assuming an ideal condition,
with no heat gain from surroundings, total heat Q removed from the
product is
Q = mv L
(6)
The amount of moisture removed from the product during vacuum
cooling, then, is directly related to the product’s specific heat and the
amount of temperature reduction accomplished. A product with a
specific heat capacity of 4 kJ/(kg·K) theoretically loses 1% moisture
for each 6 K reduction in temperature. In a study of vacuum cooling
of 16 different vegetables, Barger (1963) showed that cooling of all
products was proportional to the amount of moisture evaporated from
the product. Temperature reductions averaged 5 to 5.5 K for each 1%
of mass loss, regardless of the product cooled. This mass loss may
reduce the amount of money the grower receives as well as the turgor
and crispness of the product. Some vegetables are sprayed with water
before or during cooling to reduce this loss.
Commercial Systems
The four types of vacuum refrigeration systems that use water as
the refrigerant are (1) steam ejector, (2) centrifugal, (3) rotary, and
Fig. 7 Pressure, Volume, and Temperature in a Vacuum
Cooler
Cooling Product from 30 to 0°C
Pressure, Volume, and Temperature
In vacuum cooling, the thermodynamic process is assumed to
take place in two phases. In the first phase, the product is assumed
to be loaded into the flash chamber at ambient temperature, and the
temperature in the flash chamber remains constant until saturation
pressure is reached. At the onset of boiling, the small remaining
amount of air in the chamber is replaced by the water vapor, the first
phase ends, and the second phase begins simultaneously. The second phase continues at saturation until the product has cooled to the
desired temperature.
If the ideal gas law is applied for an approximate solution in a
commercial vacuum cooler, the pressure/volume relationships are
Phase 1 pv
= 8.697 (kN·m)/kg
Phase 2 pv1.056 = 16.985 (kN·m)/kg
where p is absolute pressure and v is specific volume.
The pressure/temperature relationship is determined by the value
of ambient and product temperature. Based on 30°C for this value, the
temperature in the flash chamber theoretically remains constant at
30°C as the pressure reduces from atmospheric to saturation, after
which it declines progressively along the saturation line. These relationships are illustrated in Figure 7. Product temperature responds
similarly, but varies depending on where temperature is measured in
Fig. 7 Pressure, Volume, and Temperature in Vacuum Cooler
Cooling Product from 30 to 0°C
This file is licensed to Abdual Hadi Nema (). License Date: 6/1/2010
28.10
2010 ASHRAE Handbook—Refrigeration (SI)
Fig. 9 Comparative Cooling of Vegetables Under
Similar Vacuum Conditions
Licensed for single user. © 2010 ASHRAE, Inc.
Fig. 8 Schematic Cross Sections of Vacuum-Producing
Mechanisms
Fig. 8
Schematic Cross Sections of Vacuum-Producing
Mechanisms
(4) reciprocating. A schematic of the vacuum-producing mechanism of each is illustrated in Figure 8.
Of these, the steam ejector type is best suited for displacing the
extremely high volumes of water vapor encountered at the low pressures needed in vacuum cooling. It also has the advantage of having
few moving parts, thus requiring no compressor to condense the
water vapor. High-pressure steam is expanded through a series of
jets or ejectors arranged in series and condensed in barometric condensers mounted below the ejectors. Cooling water for condensing
is accomplished by means of an induced-draft cooling tower. In
spite of these advantages, few steam ejector vacuum coolers are
used today, because of the inconvenience of using steam and the
lack of portability. Instead, vacuum coolers are mounted on semitrailers to follow seasonal crops.
The centrifugal compressor is also a high-volume pump and can
be adapted to water vapor refrigeration. However, its use in vacuum cooling is limited because of inherent mechanical difficulties
at the high rotative speeds required to produce the low pressures
needed.
Both rotary and reciprocal vacuum pumps can produce the low
pressures needed, and they also have the advantage of portability.
Being positive-displacement pumps, however, they have low volumetric capacity; therefore, vacuum coolers using rotary or reciprocating pumps have separate refrigeration systems to condense much
of the water vapor that evaporates off the product, thus substantially
reducing the volume of water vapor passing through the pump. Ideally, when it can be assumed that all water vapor is condensed, the
required refrigeration capacity equals the amount of heat removed
from the product during cooling.
The condenser must contain adequate surface to condense the
large amount of vapor removed from the produce in a few minutes.
Refrigeration is furnished from cold brine or a direct-expansion
system. A very large peak load occurs from rapid condensing of so
much vapor. Best results are obtained if the refrigeration plant is
equipped with a large brine or ice-making tank having enough
stored refrigeration to smooth out the load. A standard three-tube
plant, with capacity to handle three cars per hour, has a peak refrigeration load of at least 900 kW.
Fig. 9 Comparative Cooling of Vegetables Under
Similar Vacuum Conditions
To increase cooling effectiveness and reduce product moisture
loss, the product is sometimes wetted before cooling begins. However, iceberg lettuce is rarely prewetted. A modification of vacuum
cooling circulates chilled water over the product throughout the
cooling process. Among the chief advantages are increased cooling
rates and residual refrigeration that is stored in the chilled water
after each vacuum process. It also prevents water loss from products
that show objectionable wilting after conventional vacuum cooling.
Applications
Because vacuum cooling is generally more expensive, particularly in capital cost, than other cooling methods, its use is primarily
restricted to products for which vacuum cooling is much faster or
more convenient. Lettuce is ideally adapted to vacuum cooling. The
numerous individual leaves provide a large surface area and the
tissues release moisture readily. It is possible to freeze lettuce in a
vacuum chamber if pressure and condenser temperatures are not
carefully controlled. However, even lettuce does not cool entirely uniformly. The fleshy core, or butt, releases moisture more slowly than
the leaves. Temperatures as high as 6°C have been recorded in core
tissue when leaf temperatures were down to 0.5°C(Barger 1961).
Other leafy vegetables such as spinach, endive, escarole, and
parsley are also suitable for vacuum cooling. Vegetables that are less
suitable but adaptable by wetting are asparagus, snap beans, broccoli, brussels sprouts, cabbage, cauliflower, celery, green peas,
sweet corn, leeks, and mushrooms. Of these vegetables, only cauliflower, celery, cabbage, and mushrooms are commercially vacuum
cooled in California. Fruits are generally not suitable, except some
berries. Cucumbers, cantaloupes, tomatoes, dry onions, and potatoes cool very little because of their low surface-to-mass ratio and
relatively impervious surface. The final temperatures of various
vegetables when vacuum cooled under similar conditions are illustrated in Figure 9.
The rate of cooling and final temperature attained by vacuum
cooling are largely affected by the commodity’s ratio of surface area
to its mass and the ease with which it gives up water from its tissues.
Consequently, the adaptability of fruits and vegetables varies tremendously for this method of precooling. For products that have a low
surface-to-mass ratio, high temperature gradients occur. To prevent
This file is licensed to Abdual Hadi Nema (). License Date: 6/1/2010
Methods of Precooling Fruits, Vegetables, and Cut Flowers
the surface from freezing before the desired mass-average temperature is reached, the vacuum pump is switched off and on (“bounced”)
to keep the saturation temperature above freezing.
Mechanical vacuum coolers have been designed in several sizes.
Most installations use cylindrical or rectangular retorts. For portability, some vacuum coolers and associated refrigeration equipment
have been placed on flatbed trailers.
Licensed for single user. © 2010 ASHRAE, Inc.
SELECTING A COOLING METHOD
Packing house size and operating procedures, response of product to the cooling method, and market demands largely dictate the
cooling method used. Other factors include whether the product is
packaged in the field or in a packing house, product mix, length of
cooling season, and comparative costs of dry versus water-resistant
cartons. In some cases, there is little question about the type of cooling to be used. For example, vacuum cooling is most effective on lettuce and other similar vegetables. Peach packers in the southeastern
United States and some vegetable and citrus packers are satisfied
with hydrocooling. Air (room) cooling is used for apples, pears, and
citrus fruit. In other cases, choice of cooling method is not so clearly
defined. Celery and sweet corn are usually hydrocooled, but they
may be vacuum cooled as effectively. Cantaloupes may be satisfactorily cooled by several methods. Note: sweet cherries are often
hydrocooled in packing houses but are air cooled if orchard packed.
When more than one method can be used, cost becomes a major
consideration. Although rapid forced-air cooling is more costly than
hydrocooling, if the product does not require rapid cooling, a
forced-air system can operate almost as economically as hydrocooling. In a study to evaluate costs of hypothetical precooling systems
for citrus fruit, Gaffney and Bowman (1970) found that the cost for
forced-air cooling in bulk lots was 20% more than that for hydrocooling in bulk and that forced-air cooling in cartons costs 45%
more than hydrocooling in bulk.
Table 5 summarizes precooling and cooling methods suggested
for various commodities.
COOLING CUT FLOWERS
Because of their high rates of respiration and low tolerance for
heat, deterioration in cut flowers is rapid at field temperatures.
Refrigerated highway vans do not have the capacity to remove the
field heat in sufficient time to prevent some deterioration from
occurring (Farnham et al. 1979). Forced-air cooling is common. As
with most fruits and vegetables, the cooling rate of cut flowers varies substantially among the various types. Rij et al. (1979) found
that the half-cooling time for packed boxes of gypsophila was about
3 min compared to about 20 min for chrysanthemums at airflows
ranging from 38 to 123 L/s per box. Within this range, cooling time
was proportional to the reciprocal of airflow but varied less with airflow than with flower type.
SYMBOLS
A
cp
C
j
L
m
mv
p
q
Q
t
ti
tm
tma
to
v
=
=
=
=
=
=
=
=
=
=
=
=
=
=
=
=
product surface area, m2
specific heat of product, kJ/kg·K
cooling coefficient, reciprocal of hours
lag factor
heat of vaporization, kJ/kg
mass of product, kg
mass of water vaporized, kg
pressure, Pa
cooling load or rate of heat transfer, W
total heat, kJ
temperature of any point in product, °C
initial uniform product temperature, °C
temperature of cooling medium, °C
mass-average temperature, °C
surrounding temperature, °C
specific volume of water vapor, m3/kg
28.11
Table 5 Cooling Methods Suggested for Horticultural
Commodities
Size of Operation
Commodity
Tree fruits
Citrus
Deciduous a
Subtropical
Tropical
Berries
Grapes b
Leafy vegetables
Cabbage
Iceberg lettuce
Kale, collards
Leaf lettuces, spinach, endive,
escarole, Chinese cabbage,
bok choy, romaine
Root vegetables
With tops c
Topped
Irish potatoes, sweet potatoes d
Stem and flower vegetables
Artichokes
Asparagus
Broccoli, Brussels sprouts
Cauliflower
Celery, rhubarb
Green onions, leeks
Mushrooms
Pod vegetables
Beans
Peas
Bulb vegetables
Dry onions e
Garlic
Fruit-type vegetables f
Cucumbers, eggplant
Melons
Cantaloupes, muskmelons,
honeydew, casaba
Crenshaw
Watermelons
Peppers
Summer squashes, okra
Sweet corn
Tomatillos
Tomatoes
Winter squashes
Fresh herbs
Not packaged g
Packaged
Cactus
Leaves (nopalitos)
Fruit (tunas or prickly pears)
Ornamentals
Cut flowers h
Potted plants
Large
Small
R
FA, R, HC
FA, R
FA, R
FA
FA
R
FA
FA
FA
FA
FA
VC, FA
VC
VC, R, WV
VC, FA, WV, HC
FA
FA
FA
FA
HC, PI, FA
HC, FA
HC, PI
HC, PI, FA
R w/evap. coolers, HC R
HC, PI
HC
HC, FA, PI
FA, VC
HC, WV, VC
PI, HC
FA, VC
FA, PI
HC
FA, PI
FA
HC, FA
PI
FA
HC, FA
FA, PI, VC
FA
FA, PI
R
R
R, FA
R, FA, FA-EC
FA, FA-EC
HC, FA, PI
FA, FA-EC
FA, R
FA, HC
R, FA, FA-EC, VC
R, FA, FA-EC
HV, VC, PI
R, FA, FA-EC
R, FA, FA-EC
R
FA, FA-EC
FA, R
FA, FA-EC
FA, FA-EC
HC, FA, PI
FA, FA-EC
HC, FA
FA
FA, R
FA, R
R
R
FA
FA
FA, R
R
FA
R
R
R = Room cooling
WV = Water spray vacuum cooling
HC = Hydrocooling
PI = Package icing
FA = Forced-air cooling
FA-EC = Forced-air evaporative cooling
VC = Vacuum cooling
aApricots cannot be hydrocooled.
bGrapes require rapid cooling facilities adaptable to sulfur dioxide fumigation.
cCarrots can be vacuum cooled.
dWith evaporative coolers, facilities for potatoes should be adapted to curing.
eFacilities should be adapted to curing onions.
fFruit-type vegetables are sensitive to chilling but at varying temperatures.
gFresh herbs can be easily damaged by water beating in hydrocooler.
hWhen cut flowers are packaged, only use forced-air cooling.
Reprinted with permission from A.A. Kader (2001).
This file is licensed to Abdual Hadi Nema (). License Date: 6/1/2010
28.12
V
Y
Z
2010 ASHRAE Handbook—Refrigeration (SI)
= air velocity, m/s
= temperature ratio (t – to)/(ti – to)
= half-cooling time, h
= cooling time, h
Licensed for single user. © 2010 ASHRAE, Inc.
REFERENCES
Amos, N.D., D.J. Cleland, and N.H. Banks. 1993. Effect of pallet stacking
arrangement on fruit cooling rates within forced-air pre-coolers. Refrigeration Science and Technology 3:232-241.
Baird, C.D. and J.J. Gaffney. 1976. A numerical procedure for calculating
heat transfer in bulk loads of fruits or vegetables. ASHRAE Transactions
82(2):525.
Baird, C.D., J.J. Gaffney, and M.T. Talbot. 1988. Design criteria for efficient
and cost effective forced air cooling systems for fruits and vegetables.
ASHRAE Transactions 94(1):1434-1454.
Barger, W.R. 1961. Factors affecting temperature reduction and weight loss
of vacuum-cooled lettuce. USDA Marketing Research Report 469.
Barger, W.R. 1963. Vacuum precooling—A comparison of cooling of different vegetables. USDA Marketing Research Report 600.
Becker, B.R. and B.A. Fricke. 1996a. Transpiration and respiration of fruits
and vegetables. In New Developments in Refrigeration for Food Safety
and Quality, pp. 110-121. International Institute of Refrigeration, Paris.
Becker, B.R. and B.A. Fricke. 1996b. Simulation of moisture loss and heat
loads in refrigerated storage of fruits and vegetables. In New Developments in Refrigeration for Food Safety and Quality, pp. 210-221. International Institute of Refrigeration, Paris.
Becker, B.R. and B.A. Fricke. 2001. A numerical model of commodity
moisture loss and temperature distribution during refrigerated storage. In
Applications of Modelling as an Innovative Technology in the Agri-Food
Chain, M.L.A.T.M. Hertog and B.R. MacKay, eds., pp. 431-436. International Society for Horticultural Science, Leuven, Belgium.
Becker, B.R. and B.A. Fricke. 2002. Hydrocooling time estimation methods. International Communications in Heat and Mass Transfer 29(2):
165-174.
Becker, B.R., A. Misra, and B.A. Fricke. 1996a. Bulk refrigeration of fruits
and vegetables, part I: Theoretical considerations of heat and mass transfer. International Journal of HVAC&R Research (now HVAC&R Research) 2(2):122-134.
Becker, B.R., A. Misra, and B.A. Fricke. 1996b. Bulk refrigeration of fruits
and vegetables, part II: Computer algorithm for heat loads and moisture
loss. International Journal of HVAC&R Research (now HVAC&R Research) 2(3):215-230.
Bennett, A.H. 1963. Thermal characteristics of peaches as related to hydrocooling. U.S. Department of Agriculture, Technical Bulletin 1292.
Bennett, A.H. 1970. Principles and equipment for precooling fruits and vegetables. ASHRAE Symposium Bulletin SF-4-70. Symposium on Precooling of Fruits and Vegetables, San Francisco.
Bennett, A.H., R.E. Smith, and J.C. Fortson. 1965. Hydrocooling peaches—
A practical guide for determining cooling requirements and cooling
times. USDA Agriculture Information Bulletin 298 (June).
Bennett, A.H., J. Soule, and G.E. Yost. 1966. Temperature response of citrus
to forced-air precooling. ASHRAE Journal 8(4):48.
Bennett, A.H., J. Soule, and G.E. Yost. 1969. Forced-air precooling for Red
Delicious apples. USDA, Agricultural Research Service ARS 52-41.
Boyette, M.D., E.A. Estes, and A.R. Rubin. 1992. Hydrocooling. Postharvest Technology Series AG-414-4. North Carolina Cooperative Extension Service, Raleigh.
Dincer, I. 1995. An effective method for analysing precooling process
parameters. International Journal of Energy Research 19(2):95-102.
Dincer, I. 1996. Convective heat transfer coefficient model for spherical
products subject to hydrocooling. Energy Sources 18(6):735-742.
Dincer, I. and O.F. Genceli. 1994. Cooling process and heat transfer parameters of cylindrical products cooled both in water and in air. International
Journal of Heat & Mass Transfer 37(4):625-633.
Dincer, I. and O.F. Genceli. 1995. Cooling of spherical products: Part I—
Effective process parameters. International Journal of Energy Research
19(3):205-218.
Farnham, D.S., F.J. Marousky, D. Durkin, R. Rij, J.F. Thompson, and A.M.
Kofranek. 1979. Comparison of conditioning, precooling, transit method, and use of a floral preservative on cut flower quality. Proceedings,
Journal of American Society of Horticultural Science 104(4):483.
Fisher, D.V. 1960. Cooling rates of apples packed in different bushel containers and stacked at different spacing in cold storage. ASHRAE Journal
(July):53.
Fricke, B.A. and B.R. Becker. 2003. Comparison of hydrocooling time estimation methods. Proceedings of the 21st IIR International Congress of
Refrigeration: Serving the Needs of Mankind, August 17-22, 2003,
Washington, D.C. Paper ICR0432.
Gaffney, J.J. and E.K. Bowman. 1970. An economic evaluation of different
concepts for precooling citrus fruits. ASHRAE Symposium Bulletin SF-470. Symposium on Precooling Fruits and Vegetables, San Francisco
(January).
Gast, K.L.B. and R.A. Flores. 1991. Precooling produce: Fruits and vegetables. Postharvest management of commercial horticultural crops,
MF1002. Kansas State University Cooperative Extension Service, Manhattan.
Guillou, R. 1958. Some engineering aspects of cooling fruits and vegetables.
Transactions of the ASAE 1(1):38, 39, 42.
Hardenburg, R.E., A.E. Watada, and C.Y. Wang. 1986. The commercial storage of fruits, vegetables, and florist and nursery stocks. USDA Agricultural Handbook 66.
Henry, F.E. and A.H. Bennett. 1973. “Hydraircooling” vegetable products in
unit loads. Transactions of the ASAE 16(4):731-733.
Henry, F.E. A.H. Bennett, and R.H. Segall. 1976. Hydraircooling—A new
concept for precooling pallet loads of vegetables. ASHRAE Transactions
82(2):541.
Ishibashi, S., R. Kojima, and T. Kaneko. 1969. Studies on the forced-air
cooler. Journal of the Japanese Society of Agricultural Machinery 31(2).
Kader, A.A. 2001. Post Harvest Technology of Horticultural Crops. University of California, Division of Agriculture and Natural Resources.
Lucas, T. and A.L. Raoult-Wack. 1998. Immersion chilling and freezing in
aqueous refrigerating media: Review and future trends. International
Journal of Refrigeration 21(6):419-429.
Mitchell, F.G., R. Guillou, and R.A. Parsons. 1972. Commercial cooling of
fruits and vegetables. Manual 43. University of California, Division of
Agricultural and Natural Resources.
Nicholas, R.C., K.E.H. Motawi, and J.L. Blaisdell. 1964. Cooling rates of
individual fruit in air and in water. Michigan State University Agricultural Experiment Station Quarterly Bulletin 47:51-64.
O’Brien, M. and J.P. Gentry. 1967. Effect of cooling methods on cooling
rates and accompanying desiccation of fruits. Transactions of the ASAE
10(5):603-606.
Parsons, R.A., F.G. Mitchell, and G. Mayer. 1972. Forced-air cooling of palletized fresh fruit. Transactions of the ASAE 15(4):729.
Perry, R.L. and R.M. Perkins. 1968. Hydrocooling sweet corn. Paper 68800. American Society of Agricultural Engineering, St. Joseph, MI.
Pflug, I.J., J.L. Blaisdell, and I.J. Kopelman. 1965. Developing temperaturetime curves for objects that can be approximated by a sphere, infinite
plate, or infinite cylinder. ASHRAE Transactions 71(1):238.
Rij, R.E., J.F. Thompson, and D.S. Farnham. 1979. Handling, precooling,
and temperature management of cut flower crops for truck transportation. USDA-SEA Western Series 5 (June).
Robertson, G.H., J.C. Cipolletti, D.F. Farkas, and G.E. Secor. 1976. Methodology for direct contact freezing of vegetables in aqueous freezing
media. Journal of Food Science 41(4):845-851.
Ryall, A.L. and W.J. Lipton. 1979. Handling, transportation and storage of
fruits and vegetables. AVI Publishing, Westport, CT.
Smith, R.E. and A.H. Bennett. 1965. Mass-average temperature of fruits and
vegetables during transient cooling. Transactions of the ASAE 8(2):249.
Smith, R.E., A.H. Bennett, and A.A. Vacinek. 1970. Convection film coefficients related to geometry for anomalous shapes. Transactions of the
ASAE 13(2).
Soule, J., G.E. Yost, and A.H. Bennett. 1966. Certain heat characteristics of
oranges, grapefruit and tangelos during forced-air precooling. Transactions of the ASAE 9(3):355.
Stewart, J.K. and H.M. Couey. 1963. Hydrocooling vegetables—A practical
guide to predicting final temperatures and cooling times. USDA Marketing Research Report 637.
Stewart, J.K. and W.J. Lipton. 1960. Factors influencing heat loss in cantaloupes during hydrocooling. USDA Marketing Research Report 421.
Thompson, J.F., T.R. Rumsey, R.F. Kasmir, and C.H. Crisosto. 2002. Commercial cooling of fruits, vegetables, and flowers. Publication 21567.
University of California, Division of Agricultural and Natural Resources.
USDA. 2004. The commercial storage of fruits, vegetables, and florist and
nursery stocks. Agricultural Research Service, U.S. Department of Agriculture, Washington, D.C.
This file is licensed to Abdual Hadi Nema (). License Date: 6/1/2010
Methods of Precooling Fruits, Vegetables, and Cut Flowers
Licensed for single user. © 2010 ASHRAE, Inc.
BIBLIOGRAPHY
Ansari, F.A. and A. Afaq. 1986. Precooling of cylindrical food products.
International Journal of Refrigeration 9(3):161-163.
Arifin, B.B. and K.V. Chau. 1988. Cooling of strawberries in cartons with
new vent hole designs. ASHRAE Transactions 94(1):1415-1426.
Bennett, A.H. 1962. Thermal characteristics of peaches as related to hydrocooling. USDA Technical Bulletin 1292.
Bennett, A.H., W.G. Chace, Jr., and R.H. Cubbedge. 1969. Heat transfer
properties and characteristics of Appalachian area Red Delicious apples.
ASHRAE Transactions 75(2):133.
Bennett, A.H., W.G. Chace, Jr., and R.H. Cubbedge. 1970. Thermal properties and heat transfer characteristics of marsh grapefruit. USDA Technical Bulletin 1413.
Beukema, K.J., S. Bruin, and J. Schenk. 1982. Heat and mass transfer during cooling and storage of agricultural products. Chemical Engineering
Science 37(2):291-298.
Burton, K.S., C.E. Frost, and P.T. Atkey. 1987. Effect of vacuum cooling
on mushroom browning. International Journal of Food Science &
Technology 22(6):599-606.
Chau, K.V. 1994. Time-temperature-humidity relations for the storage of
fresh commodities. ASHRAE Transactions 100(2):348-353.
Chuntranuluck, S., C.M. Wells, and A.C. Cleland. 1998. Prediction of chilling times of foods in situations where evaporative cooling is significant—Part 1: Method development. Journal of Food Engineering 37:
111-125.
Chuntranuluck, S., C.M. Wells, and A.C. Cleland. 1998. Prediction of chilling times of foods in situations where evaporative cooling is significant—Part 2: Experimental testing. Journal of Food Engineering 37:
127-141.
Chuntranuluck, S., C.M. Wells, and A.C. Cleland. 1998. Prediction of chilling times of foods in situations where evaporative cooling is significant—Part 3: Applications. Journal of Food Engineering 37:143-157.
Flockens, I.H. and H.F.T. Meffert. 1972. Biophysical properties of horticultural products as related to loss of moisture during cooling down.
Journal of the Science of Food and Agriculture 23:285-298.
Fricke, B.A. 2006. Precooling fruits and vegetables using hydrocooling.
ASHRAE Journal 48(2):20-28.
28.13
Gan, G. and J.L. Woods. 1989. A deep bed simulation of vegetable cooling. Land and Water Use: Proceedings of the 11th International Congress on Agricultural Engineering, Dublin, pp. 2301-2308.
Gariepy, Y., G.S.V. Raghavan, and R. Theriault. 1987. Cooling characteristics of cabbage. Canadian Agricultural Engineering 29(1):45-50.
Grizell, W.G. and A.H. Bennett. 1966. Hydrocooling stacked crates of celery
and sweet corn. U.S. Department of Agriculture, Agricultural Research
Service, ARS 52-12.
Hackert, J.M., R.V. Morey, and D.R. Thompson. 1987. Precooling of fresh
market broccoli. Transactions of the ASAE 30(5):1489-1493.
Harvey, J.M. 1963. Improved techniques for vacuum cooling vegetables.
ASHRAE Journal 5(1):41-44.
Hayakawa, K. 1978. Computerized simulation for heat transfer and moisture loss from an idealized fresh produce. Transactions of the ASAE
21(5):1015-1024.
Hayakawa, K. and J. Succar. 1982. Heat transfer and moisture loss of spherical fresh produce. Journal of Food Science 47(2):596-605.
Isenberg, F.M.R., R.F. Kasmire, and J.E. Parson. Vacuum cooling vegetables. Information Bulletin 186. Cornell University Cooperative Extensive Service, Ithaca, NY.
Kader, A.A., R.F. Kasmire, and J.F. Thompson. 1992. Cooling horticultural
commodities. Publication 3311. University of California, Division of
Agricultural and Natural Resources.
Rohrbach, R.P., R. Ferrell, E.O. Beasley, and J.R. Fowler. 1984. Precooling
blueberries and muscadine grapes with liquid carbon dioxide. Transactions of the ASAE 27(6):1950-1955.
Smith, W.L. and W.H. Redit. 1968. Postharvest decay of peaches as affected
by hot-water treatments, cooling methods, and sanitation. USDA Marketing Research Report 807.
Smith, R.E., G.L. Nelson, and R.L. Henrickson. 1967. Analyses on transient heat transfer from anomalous shapes. Transactions of the ASAE
10(2):236.
Smith, R.E., G.L. Nelson, and R.L. Henrickson. 1968. Applications of
geometry analysis of anomalous shapes to problems in transient heat
transfer. Transactions of the ASAE 11(2):296.
Thompson, J.F., Y.L. Chen, and T.R. Rumsey. 1987. Energy use in vacuum
coolers for fresh market vegetables. Applied Engineering in Agriculture
3(2):196-199.
Woods, J.L. 1990. Moisture loss from fruits and vegetables. Postharvest News
and Information 1(3):195-199.
Related Commercial Resources