Báo cáo cập nhật hằng quý PVD – Khuyến nghị: Mua – Giá mục tiêu: 58.784
Bạn đang xem bản rút gọn của tài liệu. Xem và tải ngay bản đầy đủ của tài liệu tại đây (522.48 KB, 8 trang )
Date: 11 June.2013
QUARTERLY EARNINGS UPDATE – 1Q13
Petro Vietnam Drilling (PVD – HOSE)
Sector: Energy
High earnings growth outweighs the dilution risk in 2013,
stable earnings outlook in the longer term
BUY RECOMMENDATION, 1Y TARGET PRICE VND 58,784
The stock has reached our previous target set on 6 May 2013 (Companies AGM note_06 05
2013_SSIResearch), equating to a 32% capital gain in one month. We reiterate our BUY
recommendation for the stock based on a revised Target PER of 8x, predicated on the
followings:
Thuy Nguyen
+84-4 3 936 6321 ext 526
Current price (VND)
51,500
Target Price (12M):
58,784
Recommendation (12M):
BUY
Short-term Rating (<3M):
OVERWEIGHT
Sector Rating:
OVERWEIGHT
Date of Report:
High earnings growth in 2013 could temper fear of the dilution risk from private placement,
thanks to two main factors: (i) Full operation of PVD’s rig fleet in 2013; (ii) Higher drilling day rate.
Our estimates revealed that net income attributable to shareholders in 2013 would reach VND
1,770 bn (+34% YoY), translating to 2013 EPS of VND 7,066 (+12.3% YoY).
Earnings outlook continues to be sound in 2014: The contract for PV Drilling I, II, III is almost
fixed until August 2014, which could help PVD avoid the risk of decrease in international oil price.
Change in CAPEX plan – Trade - off between cash flow and earnings growth: The premium
jack up project this year has been cancelled, PVD plans to build 2 jack up in 2013 and 2014, in
which PVD will contribute 90% and 70% respectively. These 2 jack ups are expected to commence
operation in 2015 and 2016. Even though these CAPEX plan will affect PVD’s cash flow in the short
term, we think that it is a necessary mean in the long term to trade off with the earnings growth. The
commencement of 2 new rigs in 2015 and 2016 will help PVD to increase its drilling market share
and maintain stable growth in the long term
The private placement is expected to be completed at the end of 2Q13, which will
increase PVD’ share capital to satisfy its capital demand while still improving its D/E ratio. The
bidding list was finalized last week. Concern over dilution risk will soon subside, which will lead
to stable performances
2012 dividend (10% in cash, 10% in stock bonus) generate upside catalysts in the short
term: 2012 dividend is expected to be paid in 3Q13.
Potential impressive earnings results for 2Q13: in 2Q12, PV Drilling I had 35 days of
periodic maintenance, therefore, in 2Q13, with the full operation of PV Drilling I, earnings
results will steamroll as expected. In addition, there is a possibility that the profit from the
Baker Hughes joint venture of approx. VND 100bn could be recorded in 2Q13. In such case, it
could create an earnings surprise for PVD in 2Q13. High earnings growth is also expected
in 2H13: Drilling day rate in 2H13 will increase approx. 15% as compared to 1H13; drilling
operation will also amplify thanks to the increase in the number of leased rigs
Net revenue
NI attributable to PVD’s
shareholders
EPS (VND)
ROA
ROE
Dividend (VND)
PE
PB
EV/EBITDA
www.ssi.com.vn
Key figures
Market Cap. (USD mil):
523
Market Cap. (VND bn):
10,997
Outstanding shares (mn)
210
52-week high/low (000s, VND)
52.5/30.9
Average 3-month volume
313,942
Foreign ownership (%)
37.26%
State ownership (%)
50.38%
Management ownership (%)
Na
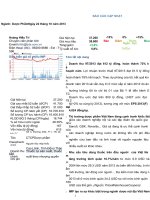
Stock performance
Short-term positive catalysts
Bn VND
11 June 2013
2010A
2011A
2012A
2013E
2014E
7,572
9,210
11,859
14,918
15,271
882
1,067
1,318
1,770
1,929
4,235
6.6%
18.6%
2000
12.5
2.13
8.77
5,088
6.5%
18.3%
1500
6.5
1.13
6.44
6,269
7.7%
21.6%
1000
6.0
1.1
4.5
7,066
9.3%
24.1%
1000
7.3
1.4
4.2
7,701
9%
21.6%
1000
6.7
1.2
3.9
Source: Bloomberg
Company Snapshot
PVD was established in 2001, based on the
strategy of PetroVietnam to focus on building
and developing oil & gas technology. In
February 2006, PVD was equitized and in
December 2006, it began trading on HOSE
with an initial charter capital of VND 680 bn.
More than 50% of PVD's revenue comes
from drilling service, with revenue from jack
up rigs accounting for the majority. PVD
owns three jack up drilling rigs (PV
DRILLING I, II, III), one land rig and one semi
submersible tender assist drilling rig – TAD
Visit SSI Research on Bloomberg at SSIV<GO>
1
QUARTERLY EARNINGS UPDATE – 1Q13
Date: June.2013
COMMENTS ON 1Q13 FINANCIAL RESULTS
(bn VND)
1Q13
1Q12
YoY
4Q12
QoQ
Net sales
3,178.9
2,360.1
34.7%
3,605.7
-11.8%
Gross profit
787.2
636.5
23.7%
725.3
EBIT
579.0
519.7
11.4%
403.1
EBITDA
843.4
727.3
16.0%
696.7
21.1%
Pretax profit
517.0
448.7
15.2%
333.5
55.0%
Net income
NI attributable to
shareholders
452.8
380.3
19.0%
257.4
75.9%
421.1
370.3
13.7%
216.8
94.2%
Completion
of 2013
target
28.2%
Margin
1Q13
1Q12
4Q12
2012
8.5%
24.8%
27.0%
20.1%
22.5%
43.6%
18.2%
22.0%
11.2%
16.8%
26.5%
30.8%
19.3%
25.4%
16.3%
19.0%
9.3%
14.2%
14.2%
16.1%
7.1%
12.1%
13.2%
15.7%
6.0%
11.1%
32.0%
31.0%
1Q13 high earnings results, in line with our expectation: PVD has announced its 1Q13
earnings results in which net revenue totaled VND 3,179 bn (+34.7% YoY) and net income
attributable to shareholders totaled VND 421 bn (+13.7% YoY), which were driven by three
main factors: (i) TAD was in full operation in 1Q13 (In 1Q12, TAD commenced operation since
mid Feb 2012); (ii) 10% increase YoY in day rate; (iii) Operation expansion thanks to the
increase in leased rigs (from 1 in 1Q12 to 3 leased rigs in 1Q13)
Slight decrease in gross margin (from 27% in 1Q12 to 24.8% in 1Q13), which is normal
along with the increase in leased rigs. It should be noted that the margin of PVD’s leased rigs
is much smaller than the margin of PVD’s owned rigs. However, the high revenue from the
increase in leased rigs could more than offset the slight decrease in gross margin
Sharp increase in G&A expense hindered profit growth of PVD in 1Q13 (+67% YoY; G&A
as % of revenue increased from 4.7% in 1Q12 to 5.9% in 1Q13). This significant increase is
mainly due to the allocation for the scientific and technological fund (In 2012, the scientific and
technological fund was booked in 2Q12). Hence, we assume that the G&A expense in 2Q13
could decreased YoY.
UPDATE ON THE PRIVATE PLACEMENT
PVD plans to increase its share capital to satisfy its capital demand while still improving its D/E
ratio. In 2013, the company plans to issue an additional 40 million shares, in which 38 million
shares are issued through private placement and 2 million shares are issued through ESOP.
The private placement is expected to be completed at the end of 2Q13.
In the ESOP, issuance price will be VND 10,000/share, the lock – period will be 2 years. In the
private placement, PVN will purchase 20,152 million shares to safeguard its majority
www.ssi.com.vn
Visit SSI Research on Bloomberg at SSIV<GO>
2
QUARTERLY EARNINGS UPDATE – 1Q13
Date: June.2013
shareholder position; hence the 17,848 million shares will be sold to strategic and/or financial
partners.
For PVN, the issuance price corresponds with the BVPS on 30 June 2012, which is
approx. VND 32,355, 38% discount as compared to the current market price of VND
52,500 on 10 June 2013; the lock period is 3 years.
For other investors, the issuance price is set under negotiation and will be no less than the
BVPS on the issuance date.
The bidding list was finalized last week. Therefore, concerns over dilution risk will soon
subside, which lead to stable performances.
CATALYSTS TO WATCH IN THE NEXT 3-6 MONTHS
The private placement is expected to be completed at the end of 2Q13. Chartered capital
would increase to VND 2,756 bn after the private placement and the stock dividend, making
20% dilution risk. The D/E ratio will be improved, decreases from 0.97 in 2012 to 0.81 in 2013
in our estimates. If we were to based on an average issue price of VND 38,000 in the private
placement, PVD could raise VND 1,444 bn (~$68.5 mn, approx. 30% total investment of one
new jack up),
Expectation of impressive earnings growth in 2Q13: It should be noted in 2Q12, PV
Drilling I had 35 days of periodic maintenance, therefore, in 2Q13, with the full operation of PV
Drilling I, earnings results will steamroll as expected. In addition, there is a possibility that the
profit from the Baker Hughes joint venture of approx. VND 100bn could be recorded in 2Q13.
In such case, it could generate earnings surprise for PVD in 2Q13. High earnings growth in
2H13 is also expected thanks to 15% increase in day rate as compared to 1H13 and
operation expansion (number of leased rigs increased from 3 in 1H13 to 4 in 2H13).
2012 dividend (10% in cash, 10% in stock bonus) could create upside in short term:
2012 dividend is expected to be paid in 3Q13.
Change in CAPEX plan: The premium jack up project (joint venture with FEG), which is
planned to commence operation in October 2013 has been cancelled. In the updated CAPEX
plan, the company planned to build a jack up this year in the form of a joint venture, in which
PVD will contribute 90%. This rig is expected to commence operation in 2015. In 2014, PVD
plans to build another rig, which is expected to commence operation in 2016.
www.ssi.com.vn
Visit SSI Research on Bloomberg at SSIV<GO>
3
QUARTERLY EARNINGS UPDATE – 1Q13
Date: June.2013
INVESTMENT OPINION: BUY, 1 year target price of VND
58,784/share
Investment Rationale
The stock has reached our previous target set at 6 May 2013 (Companies AGM note_06
05 2013_SSIResearch), making 32% capital gain in one month, mainly thanks to the
expectation of 2013 high earnings results (increase in drilling day rate in 2H13 and the
recognition of profit from Baker Hughes joint venture in 2013) and the expectation on the
accomplishment of the private placement.
High earnings growth in 2013 could temper fear of dilution risks, thanks to two main
factors: (i) Full operation of PVD’s rig fleet in 2013; (ii) Higher drilling day rate. Our estimates
revealed that net income attributable to shareholders in 2013 would reach VND 1,770 bn
(+34% YoY), translating to 2013 EPS of VND 7,066 (+12.3% YoY) after taken into account
20% dilution risk this year.
Earnings outlook continues to be sound in 2014: The contract for PV Drilling I, II, III is
almost fixed until August 2014, which could help PVD avoid the risk of decrease in
international oil price. In our estimates, 2014 net income attributable to shareholders will reach
VND 1,929 bn (+9% YoY), translating to 2014 EPS of VND 7,701 (+9% YoY). At today price of
51,500, PVD is traded at 1 year forward PE of 7.0x.
The trade - off between cash flow and earnings growth will still make PVD an attractive
stock. Even though the CAPEX plan will negatively affect PVD’s cash flow in the short term,
we think that it is a necessary mean in the long term for earnings growth. The commencement
of 2 new rigs in 2015 and 2016 will help PVD to increase its drilling market share and maintain
stable growth in the long term (It should be noted that the demand for new jack up rigs has
increased: According to Rigzone, rig utilization rates have improved over the past 12 months,
as of 28 March 2013, rig utilization rates was 84.7%, which is an increase from 81.4% six
months ago and 78.1% one year ago). It should be noted that the margin of PVD’s owned rigs
is much higher than the margin of PVD’s leased rigs, hence, the increase of owned rigs could
also improve PVD’s gross margin.
Investment risk
www.ssi.com.vn
Decrease in international oil price could influence the drilling day rate in the long term
Fluctuation of international drilling day rate
CAPEX plan will affect PVD’s cash flow in the short term
Visit SSI Research on Bloomberg at SSIV<GO>
4
QUARTERLY EARNINGS UPDATE – 1Q13
Date: June.2013
In conclusion, we reiterate our BUY recommendation for the stock with 1 year target price of
VND 58,784 based on a revised 1 year forward PE of 8x, The revision of target PE is mainly
due to the expectation of the accomplishment of the private placement, the stable earnings
outlook in the long term and the uptrend of the stock market (the market PE stood at 10.45x
on 4 June 2013 – SSI Research).
Sensitivity analysis
Sensitivity Analysis
Target price (1Y)
www.ssi.com.vn
6.5
7.0
7.5
8.0
8.5
9.0
9.5
47,762
51,436
55,110
58,784
62,458
66,132
69,806
Visit SSI Research on Bloomberg at SSIV<GO>
5
QUARTERLY EARNINGS UPDATE – 1Q13
Date: June.2013
APPENDIX 1: ANNUAL FINANCIAL STATEMENTS
VND Billion
Balance Sheet
+ Cash & Cash equivalent
+ Short-term investments
+ Account receivables
+ Inventories
+ Other current assets
Total Current Assets
+ LT Receivables
+ Net Fixed Assets
+ Investment properties
2011
2012
2013F
2014F
668
0
2,178
1,003
65
3,915
0
1,068
0
3,117
788
106
5,079
0
1,165
0
4,095
1,152
124
6,537
0
2,073
0
4,192
1,157
126
7,548
0
14,105
13,318
15,018
15,507
0
0
0
0
310
458
458
458
+ Goodwill
+ Other LT Assets
Total Long-Term Assets
2
204
14,620
2
227
14,005
2
225
15,703
2
227
16,195
Total Assets
18,535
19,084
22,240
23,742
+ Current Liabilities
In which: short-term debt
+ Non-current Liabilities
In which: long-term debt
Total Liabilities
+ Contributed capital
+ Share premium
+ Retained earnings
+ Other capital/fund
Owners' Equity
NCI
Total Liabilities & Equity
5,039
2,050
7,078
5,852
12,117
2,105
1,382
1,382
1,529
6,399
20
18,535
5,691
1,941
6,376
4,868
12,066
2,105
1,382
2,030
1,475
6,992
25
19,084
6,323
2,284
6,840
4,961
13,163
2,756
1,382
3,011
1,756
8,905
173
22,240
6,025
2,202
7,108
5,214
13,133
2,756
1,382
4,105
2,045
10,288
321
23,742
Cash Flow
CF from operating activities
CF from investing activities
CF from financing activities
Net increase in cash
Beginning cash
Ending cash
2,342
-2,693
75
-276
855
668
2,218
-412
-1,406
400
668
1,068
2,274
-3,003
827
98
1,068
1,165
2,936
-1,922
-106
907
1,165
2,073
0.78
0.56
0.13
2.97
5.60
75.74
90.82
34.33
0.89
0.74
0.19
2.14
6.62
75.89
82.50
35.35
1.03
0.83
0.18
1.53
8.04
84.19
71.76
30.68
1.25
1.04
0.34
1.36
8.44
93.81
71.02
36.37
0.35
0.65
1.89
1.23
0.32
0.37
0.63
1.73
0.97
0.28
0.40
0.59
1.48
0.81
0.26
0.43
0.55
1.28
0.72
0.21
+ LT Investments
Liquidity Ratios
Current ratio
Acid-test ratio
Cash ratio
Net debt / EBITDA
Interest coverage
Days of receivables
Days of payables
Days of inventory
Capital Structure
Equity/Total asset
Liabilities/Total Assets
Liabilities/Equity
Debt/Equity
ST Debt/Equity
www.ssi.com.vn
2011
2012
2013F
2014F
9,211
-7,153
2,057
152
-447
-31
-557
11,929
-9,247
2,683
54
-420
-38
-752
14,919
-11,538
3,381
75
-423
-48
-917
15,271
-11,587
3,684
79
-431
-49
-939
1,174
1,526
2,068
2,344
-17
110
15
15
72
61
161
67
1,229
1,073
6
1,697
1,448
126
2,243
1,918
148
2,427
2,077
148
1,067
1,322
1,770
1,929
Basic EPS (VND)
BPVS (VND)
Dividend (VND/share)
EBIT
EBITDA
5,088
30,307
1,500
1,497
2,207
6,290
33,380
1,000
1,999
3,030
7,066
35,695
1,000
2,562
3,866
7,701
41,241
1,000
2,753
4,186
Growth
Sales
EBITDA
EBIT
NI
Equity
Chartered Capital
Total assets
21.6%
13.7%
12.4%
21.1%
20.4%
0.0%
26.6%
29.5%
37.3%
33.6%
35.0%
9.3%
0.0%
3.0%
25.1%
27.6%
28.2%
32.5%
27.4%
30.9%
16.5%
2.4%
8.3%
7.4%
8.3%
15.5%
0.0%
6.8%
6.5
1.1
0.8
4.5%
6.4
1.5
6.0
1.1
0.7
2.7%
4.5
1.1
7.5
1.5
0.7
1.9%
4.3
1.1
6.9
1.3
0.7
1.9%
3.9
1.1
22.3%
15.2%
11.6%
0.3%
6.1%
6.5%
18.3%
9.9%
22.5%
15.1%
12.1%
0.3%
6.3%
7.7%
21.6%
12.2%
22.7%
15.7%
12.9%
0.3%
6.2%
9.3%
24.1%
14.6%
24.1%
17.2%
13.6%
0.3%
6.2%
9.0%
21.6%
13.9%
VND Billion
Income Statement
Net Sales
COGS
Gross Profit
Financial Income
Financial Expense
Selling Expense
Admin Expense
Income from
business operation
Net Other Income
Income from
associates
Profit Before Tax
Net Income
Minority interest
NI attributable to
shareholders
Valuation
PER
PBR
P/Sales
Dividend yield
EV/EBITDA
EV/Sales
Profitability Ratios
Gross Margin
Operating Margin
Net Margin
Selling exp./Net sales
Admin exp./Net sales
ROA
ROE
ROIC
Visit SSI Research on Bloomberg at SSIV<GO>
6
QUARTERLY EARNINGS UPDATE – 1Q13
Date: June.2013
APPENDIX 2: QUARTELY FINANCIAL STATEMENTS
VND Billion
Balance Sheet
1Q12
2Q12
3Q12
4Q12
+ Cash & Cash equivalent
+ Short-term investments
+ Account receivables
+ Inventories
+ Other current assets
Total Current Assets
910
0
1,992
833
49
3,785
888
0
2,798
915
112
4,714
1,105
0
3,514
926
103
5,648
1,068
0
3,117
788
106
5,079
0
0
0
0
+ Net Fixed Assets
+ Investment properties
+ LT Investments
+ Goodwill
+ Other LT Assets
Total Long-Term Assets
13,983
0
373
2
174
14,533
13,823
0
414
2
189
14,427
13,508
0
515
2
251
14,275
13,318
0
458
2
227
14,005
Total Assets
18,318
19,141
19,923
4,493
5,259
1,689
7,226
5,852
11,719
+ LT Receivables
+ Current Liabilities
In which: short-term
debt
+ Non-current Liabilities
In which: long-term debt
Total Liabilities
+ Contributed capital
+ Share premium
+ Retained earnings
+ Other capital/fund
Owners' Equity
NCI
Total Liabilities & Equity
1Q12
VND Billion
Income Statement
Net Sales
2Q12
3Q12
4Q12
2,360
2,635
3,329
3,606
-1,724
636
-2,006
629
-2,637
692
-2,880
725
Financial Income
Financial Expense
Selling Expense
Admin Expense
Income from business
operation
13
-93
-3
-111
20
-111
-6
-235
13
-93
-8
-195
7
-123
-21
-211
442
298
409
377
Net Other Income
Income from associates
Profit Before Tax
Net Income
2
4
449
380
6
24
329
287
64
113
587
523
38
-81
334
257
COGS
Gross Profit
10
44
31
41
19,084
Minority interest
NI attributable to
shareholders
370
243
492
217
5,567
5,691
Basic EPS (VND)
1,768
1,144
2,340
1,038
2,330
7,048
5,587
12,306
1,859
7,073
5,845
12,640
1,941
6,376
4,868
12,066
31,250
520
727
32,355
417
653
34,481
660
953
33,215
403
697
2,105
1,382
1,657
1,434
6,578
2,105
1,382
1,879
1,445
6,811
2,105
1,382
2,301
1,470
7,259
2,105
1,382
2,030
1,475
6,992
21
18,318
23
19,141
24
19,923
25
19,084
16.2%
26.5%
27.4%
28.7%
19.2%
0.0%
19.2%
24.3%
24.7%
22.8%
24.5%
19.4%
0.0%
23.9%
39.8%
60.9%
59.3%
65.0%
21.7%
0.0%
22.8%
34.6%
35.1%
20.1%
12.1%
13.1%
0.0%
3.6%
198
405
-361
241
580
-974
375
-19
355
359
-496
218
1,085
-202
-924
-41
668
910
910
888
888
1,105
1,105
1,068
27.0%
21.5%
16.1%
0.1%
4.7%
23.9%
14.3%
10.9%
0.2%
8.9%
20.8%
14.3%
15.7%
0.2%
5.8%
20.1%
12.2%
7.1%
0.6%
5.9%
0.84
0.65
0.20
9.12
7.32
0.90
0.70
0.17
10.76
4.72
1.01
0.83
0.20
6.92
9.03
0.89
0.74
0.19
8.24
5.79
0.36
0.64
1.78
1.15
0.26
0.36
0.64
1.81
1.16
0.34
0.36
0.63
1.74
1.06
0.26
0.37
0.63
1.73
0.97
0.28
BPVS (VND)
EBIT
EBITDA
Growth (YoY)
Sales
EBITDA
EBIT
NI
Equity
Chartered Capital
Total assets
Cash Flow
CF from operating activities
CF from investing activities
CF from financing activities
Net increase in cash
Beginning cash
Ending cash
Liquidity Ratios
Current ratio
Acid-test ratio
Cash ratio
Net debt / EBITDA
Interest coverage
Profitability Ratios
Gross Margin
Operating Margin
Net Margin
Selling exp./Net sales
Admin exp./Net sales
Capital Structure
Equity/Total asset
Liabilities/Total Assets
Liabilities/Equity
Debt/Equity
ST Debt/Equity
Source: Company data, SSI estimates
www.ssi.com.vn
Visit SSI Research on Bloomberg at SSIV<GO>
7
QUARTERLY EARNINGS UPDATE – 1Q13
Date: June.2013
1. RATING
Within 12-month horizon, SSIResearch rates stocks as either BUY, HOLD or SELL determined by the stock’s
expected return relative to the market required rate of return, which is 16% (*). A BUY rating is given when the
security is expected to deliver absolute returns of 16% or greater. A SELL rating is given when the security is
expected to deliver returns below or equal to negative - 8%, while a HOLD rating implies returns between negative
- 8% and 16%.
Besides, SSIResearch also provides Short-term rating where stock price is expected to rise/reduce within three
months because of a stock catalyst or event. Short-term rating may be different from 12-month rating.
Industry Rating: We provide the analyst’ industry rating as follows:
Overweight: The analyst expects the performance of the industry over the next 6-12 months to be attractive vs.
the relevant broad market
Neutral: The analyst expects the performance of the industry over the next 6-12 months to be in line with the
relevant broad market
Underweight: The analyst expects the performance of the industry over the next 6-12 months with caution vs.
the relevant broad market.
*The market required rate of return is calculated based on 1-year Vietnam government bond yield and market risk premium derived
from using Relative Equity Market Standard Deviations method. Our rating bands are subject to changes at the time of any significant
changes in the above two constituents.
2. DISCLAIMER
The information, statements, forecasts and projections contained herein, including any expression of opinion, are
based upon sources believed to be reliable but their accuracy completeness or correctness are not guaranteed.
Expressions of opinion herein were arrived at after due and careful consideration and they were based upon the
best information then known to us, and in our opinion are fair and reasonable in the circumstances prevailing at the
time. Expressions of opinion contained herein are subject to change without notice. This document is not, and
should not be construed as, an offer or the solicitation of an offer to buy or sell any securities. SSI and other
companies in the SSI and/or their officers, directors and employees may have positions and may affect
transactions in securities of companies mentioned herein and may also perform or seek to perform investment
banking services for these companies.
This document is for private circulation only and is not for publication in the press or elsewhere. SSI accepts no
liability whatsoever for any direct or consequential loss arising from any use of this document or its content. The
use of any information, statements forecasts and projections contained herein shall be at the sole discretion and
risk of the user.
3. CONTACT INFORMATION
Phuong Hoang
Director, Institutional Research & Investment Advisory
Thuy Nguyen
Research Analyst, Oil & Gas, Fertilizer
WWW.SSI.COM.VN
SAIGON SECURITIES
INC.
Member of the Ho Chi
Minh Stock Exchange,
Regulated
by the State Securities
Commission
HO CHI MINH CITY
HA NOI
72 Nguyen Hue Street,
District 1
Ho Chi Minh City
Tel: (848) 3824 2897
Fax: (848) 3824 2997
Email:
1c Ngo Quyen Street
Ha Noi City
Tel: (848) 3936 6321
Fax: (848) 3936 6311
(848) 3824 2997 Email: i