ĐÁNH GIÁ THÀNH TÍCH LỰC LƯỢNG BÁN HÀNG
Bạn đang xem bản rút gọn của tài liệu. Xem và tải ngay bản đầy đủ của tài liệu tại đây (900.68 KB, 10 trang )
Chương 6. Đánh giá thành tích Lực
lượng bán hàng
Chapter 6. Evaluating Sales Force Performance
NỘI DUNG
Phân
tích chi phí
giá thành tích dựa trên hành vi
Đánh giá thành tích dựa trên kết quả
Sử dụng các mô hình đánh giá thành tích
Đánh
2
ĐÁNH GIÁ THÀNH TÍCH - EVALUATING
PERFORMANCE
Đánh giá thành tích được định nghĩa như là sự so sánh các
mục đích và mục tiêu của LLBH với những thành tựu thực
tế tại hiện trường.
Đánh giá thành tích bán hàng thông qua:
3
Thành tích chung của LLBH
Thành tích của NVBH
Tại sao phải đánh giá thành tích?
To link compensation and rewards to performance.
To identify salespeople capable of promotion.
To identify training and counseling needs.
To identify criteria for recruitment and selection.
To clarify work expectations.
To motivate salespeople.
To help salespeople set career goals.
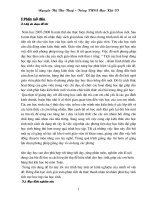
Một mô hình đánh giá Lực lượng BH
Thiết lập Mục đích và Mục tiêu
cho LLBH, bao gồm:
Doanh thu
Lợi nhuận gộp
Thị phần
Tỷ suất chi phí
Thiết kế Kế hoạch bán hàng
Thiết lập các tiêu chuẩn về năng suất cho:
Tổ chức
Các Nhân viên BH
Các Vùng
Các Khách hàng
Các Khu vực
Đo lường Kết quả
So với Tiêu chuẩn
Sửa lỗi
5
Các thước đo kết quả được sử dụng để đánh giá
LLBH
Doanh thu - Sales
Lợi nhuận - Profit
Sales volume dollars
Net profit
Sales volume previous year’s growth
Gross margin percentage
Sales to quota
Return on investment
Sales growth
Net profit as a percentage of sales
Sales volume by product
Gross margin dollars
Sales volume by customer
New account sales
Margin by product category
Khách hàng - Accounts
Sales volume in units
Number of new accounts
Sales volume to potential (market share)
Number of accounts lost
Đơn hàng - Orders
Number of orders
Average order size
Batting average (orders/calls)
Number of accounts sold
Number of accounts buying full line
Các thước đo kết quả được sử dụng để đánh giá
LLBH
Performance Measure
Sales
Sales volume dollars
Sales volume previous year’s sales
Sales to quota
Sales growth
Sales volume by product
Sales volume by customer
New account sales
Sales volume in units
Sales volume to potential
Accounts
Number of new accounts
Number of accounts lost
Number of accounts buying full line
Percent
Using Performance Measure
79%
76
65
55
48
44
42
35
27
69
33
27
Percent
Using
Profit
Net profit
Gross margin percentage
Return on investment
Net profit asa percentage of sales
Margin by product category
Gross margin dollars
69%
34
33
32
28
25
Orders
Number of orders
Average size of order
47
22
Thước đo Đầu vào hay Cơ sở Hành vi được sử
dụng để đánh giá LLBH
Chi phí - Expenses
Nỗ lực - Effort
Total expenses
Number of calls
Selling expenses to budget
Number of calls per day
Selling expenses as a percentage of sales
Number of calls to quota
Hoạt động phi bán hàng - Nonselling
Activities
Number of days worked
Advertising displays set up
Number of reports turned in
Number of service calls
Number of prospecting phone calls
Number of customer complaints
Selling time vs. non-selling time
Thước đo Đầu vào hay Cơ sở Hành vi được sử
dụng để đánh giá LLBH
Base
Percent
Using
Base
Percent
Using
Selling expenses to budget
55%
Number of calls per day
42%
Total expenses
53
Number of reports turned in
38
Selling expenses as a % of sales
49
Number of days worked
33
Number of calls
48
Selling time vs. nonselling time
27
Thông tin định tính được sử dụng để đánh giá
LLBH
Attitudinal and Personality Factors
Time management
Attitude
Ability to plan
Enthusiasm
Appearance and manner
Cooperation
Knowledge
Creativity and resourcefulness
Product knowledge
Initiative and aggressiveness
Pricing knowledge
Motivation
Knowledge of competition
Selling Skills
Ethical and moral behavior
Communication Skills
Team player
Thông tin định tính được sử dụng để đánh giá
LLBH
Percent
Using
Base
Percent
Using
Performance Measure
Communication skills
88%
Time management
63%
Product knowledge
85
Cooperation
62
Attitude
82
Judgment
62
Selling skills
79
Motivation
61
Initiative and aggressiveness
76
Ethical/Moral behavior
59
Appearance and manner
75
Planning ability
58
Knowledge of competition
71
Pricing knowledge
55
Team player
67
Report preparation and submission
54
Enthusiasm
66
Creativity
54
Dữ liệu bán hàng cho máy tính Con gấu
Sales Data for Bear Computer
Year
1
Company
Volume
($ millions)
2008
2007
2006
2005
26
24
21
17
2
Percentage
Change from
Previous Year
+ 8.3
+14.3
+23.5
---
3
Industry
Volume
($ millions)
4
Company
Market Share
(percent)
300
219
165
125
8.6
10.9
15.7
13.6
So sánh doanh thu và số lượng bán tại công ty
máy tính Con Gấu
----------2007 Sales---------Thousands
Avg Price
of Dollars
Units
Per Unit
Products
Computers
----------2008 Sales---------Thousands
Avg Price
Of Dollars
Units
Per Unit
$16,800
560
$30,000
$18,200
520
$35,000
Accessories
4,800
4,000
1,200
5,200
4,727
1,100
Software
2,400
1,200
2,000
2,600
1,280
2,031
Total
$24,000
5,760
$26,000
6,527
Phân tích chi phí theo dòng sản phẩm, Công ty
máy tính Con Gấu, 2008
2008 Sales
(000)
Products
Computers
CGS and
Commission
$
CGS as a
Percentage
Of Sales
Contribution
Margin
Contribution
Margin
Percentage
$18,200
$12,740
70
$5,460
30
Accessories
5,200
3,120
60
2,080
40
Software
2,600
520
20
2,080
80
Total
$26,000
$16,380
63%
$9,620
37%
Đánh giá hiệu suất LLBH: phân tích chi phí
Chi phí nào có liên quan?
Trừ Biến phí:
Bằng:
Trừ:
Bằng:
Doanh thu thuần
Giá vốn hàng bán
Hoa hồng bán hàng
Số dư đảm phí
Định phí bán hàng
Lợi nhuận gộp
Đánh giá hiệu suất LLBH: chi phí sản phẩm
CGS + Commissions higher for computers
paying too much for parts
competition has driven down selling prices
salespeople cutting computer prices to make deals -- possible
actions:
limit price negotiation capabilities
shift to a gross margin commission
change commission structure to emphasize
accessories and software
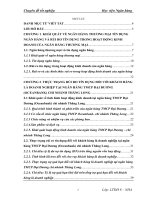
Một mô hình đánh giá nhân viên BH
Hệ thống
đầu vào
Hệ thống
đầu ra
Kết quả
Hành vi
Các lần tiếp
xúc KH
Các báo cáo
Các phàn nàn
Các thể hiện
Các cuộc gặp
nhà bán sỉ
Bố trí trưng bày
Chi phí du lịch/
giải trí
Doanh thu
Bán hàng
Tăng trưởng
Doanh thu
DT/Hạn ngạch
DT/Tiềm năng
Số khách hàng
mới
Số dư đảm phí
Tỷ lệ đóng góp
Đánh giá
NV
bán hàng
17
Ví dụ: Đo lường kết quả (doanh số) của LLBH tại
một công ty
1
2
Sales ‘05 Sales ‘06
Jan-Sept Jan-Sept
Territory
(000)
(000)
3
Dollar
Change
4
Sales
Growth
5
Market
Potential
index
(percent)
Sales
Quota
(000)
6
$ 943
7
8
Percentage Sales
of Quota Variance
Achieved
(000)
87.0% – $118
Jones
$ 750
$ 825
+ $75
10.0%
26.0%
Smith
500
570
+
70
14.0
15
543
105
+
Brown
1025
1110
+
85
8.3
32
1160
96
–
50
West
960
1000
+
40
4.2
27
977
102
+
23
$3235
$3505
18
+$270
8.3%
100.0%
$3623
27
Ví dụ: Đo lường kết quả (lợi nhuận) của
LLBH tại một công ty
Territory Performance (thousands)
Jones
Smith
Brown
West
$825
$570
$1100
$1000
Less CGS and Commissions
495
428
744
660
Contribution margin
330
142
356
340
Net Sales
CM as a percentage of sales
40%
25%
32%
34%
Sales force salaries
Travel
55.0
15.5
35.0
4.1
55.0
3.5
65.0
5.0
Food and lodging
Entertainment
12.5
11.4
4.0
0.3
3.2
0.5
4.5
1.0
4.5
2.3
2.0
4.5
$231.1
28%
$ 96.3
17%
$291.8
26%
$260.0
26%
Less direct selling costs
Home sales office expense
Profit contribution
PC as a percentage of sales
19
Ví dụ: Đánh giá thành tích sử dụng dữ liệu
về kết quả và hành vi
Performance factors
Pete Jones
Ann Smith
Sales (annual)
Days worked
Calls
Orders
Expenses
Calls per day
Batting average (orders per calls)
Sales per order
Expenses per call
Expenses per order
Expenses as % of sales
$1,400,000
210
1,200
480
$19,000
5.7
40%
$2,916
$15.83
$39.58
1.35%
$1,100,000
225
1,500
750
$14,900
6.7
50%
$1,466
$9.93
$19.86
1.35%
20
Xếp hạng NVBH dựa trên 10 yếu tố đầu vào/đầu
ra
Ranking Factors
Dollar Sales
Sales to Potential
Sales to Quota
Sales per Order
Number of Calls
Orders per call
Gross Margin Percent
Direct Selling Costs
New Accounts
Number of Reports Turned In
Total of Ranks
21
Ford
Bell
Shaw
Mann
Gold
5
5
5
2
4
5
4
4
36
2
3
4
5
2
3
4
3
28
3
4
2
4
5
3
5
2
30
4
2
3
3
3
4
5
5
31
5
3
2
4
2
2
3
2
25
Xếp hạng NVBH dựa trên 10 yếu tố đầu vào/đầu
ra
Performance factors
Pete Jones
Ann Smith
Sales (annual)
$1,400,000
$1,100,000
Days worked
Calls
Orders
Expenses
210
225
1,200
1,500
480
750
$19,000
$14,900
Calls per day
5.7
Batting average (orders per calls)
6.7
40%
50%
Sales per order
$2,916
$1,466
Expenses per call
$15.83
$9.93
Expenses per order
$39.58
$19.86
Expenses as % of sales
1.35%
1.35%
Xếp hạng NVBH dựa trên 10 yếu tố đầu vào/đầu
ra
Millions
$
3.87
3.66
3.44
S
A
L
E
S
3.23
Y
R
2
2.16
3.02
2.80
2.59
2.38
1.95
1.74
1.53
1.31
1.10
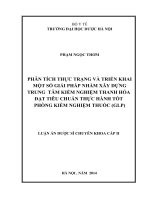
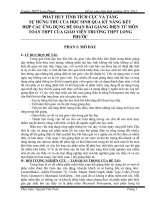
NGƯỜI THOẢ HIỆP –
COMPROMISERS
Avg sales
$3.17
Avg contribution
$1.13
Avg contribution %
35.8
Age
45
Calls
1122
Number of salespeople
18
Avg sales
$2.91
Avg contribution
$1.09
Avg contribution %
37.4
Age
37
Calls
888
Number of salespeople
11
Avg sales
$1.78
Avg contribution
$ .64
Avg contribution %
35.8
Age
44
Calls
958
Number of salespeople
11
Avg sales
$2.03
Avg contribution
$ .75
Avg contribution %
37.1
Age
35
Calls
921
Number of salespeople
16
NGÔI SAO - STARS
KẺ LỀ MỀ - SLOWPOKES
KẺ CHẬM CHẠP - LAGGARDS
34.8
35.1
36.0
36.6
37.2
37.8
38.7
Contribution Margin (%)
23
Hiệu suất thành tích tương đối của 22 đại diện
bán hàng
Variable Type
Output
Output
Output
Input
Input
Input
Input
Value
Measured
100
5
45,000
5
20,000
3
60,500
Variable name
Percent Quota Attained (%)
Supervisor Evaluation
Sales Volume ($)
Sales Training
Salary ($)
Management Ratio
Territory Potential ($)
Reference Set
Influence
Salesperson 7
0.49
Salesperson 20
0.43
Salesperson 45
0.08
Value of 100%
Efficient
120
5
50,500
5
18,000
2
50,000
Efficiency=0.85
Iterations=10
Slack
20
0
5,500
0
2,000
1
10,500
Điều kiện khi hệ thống đánh giá Đầu ra hoặc
Hành vi được lựa chọn
Outcome Systems(OS)
• Customers need
information
• Customers trust the
salesperson
• There are ways to close
the deal
• Sales environment is
competitive
Behavioral System(BS)
• Salespeople lack
experience
• No need to protect the
brand image
• Nonselling behaviors are
a priority
• Difficult to assign sales
credit
Một số chỉ tiêu đánh giá thành tích - Account
Related Ratios
DT bình quân 1 Khách hàng
Sales to Account
=
Dollar Sales
# Accounts
Độ lớn Đơn hàng bình quân
Average Order Size
=
Dollar Sales
# Orders
Tỷ lệ Tăng trưởng KH
Growth Ratio
=
# New Accounts
Total # Accounts
Tỷ lệ nắm giữ KH
Account Success
=
Accounts Sold
Total # Accounts
26
Một số chỉ tiêu đánh giá thành tích - Expense
Ratios
27
Tỷ lệ Chi phí bán hàng
Expense to Sales
=
Expenses
Sales
Chi phí 1 lần tiếp xúc KH
Cost per Call
=
Total Costs
# of Calls
Các mô hình kết hợp kiểm soát đầu vào và
đầu ra: thủ tục xếp hạng
Được sử dụng rộng rãi, dễ hiểu, dễ sử dụng.
Thêm tiêu chí xếp hạng cho việc đánh giá thành tích tổng
thể.
Các lựa chọn đối với NVBH/Doanh số
Sales to potential – độ bao phủ thị trường (hạn chế) tốt
Sales to quota – khả năng tăng doanh số
Sales per order – khả năng sinh lợi liên quan tới tầm cỡ khách hàng
Batting average – Hiệu quả của các lần tiếp xúc khách hàng
Gross margin percentage – Khả năng kiểm soát giá cả, bán một cơ
cấu sản phẩm hợp lý nhất
Mức chênh lệch (biến đổi) -- weight importance of each
criterion
28
Đánh giá thành tích LLBH: Chi phí phục vụ
khách hàng
Total Cost to Serve Account
Cost to Serve =
Revenue from Account
Chỉ tiêu này thường giảm dần theo doanh số
Giúp xác định được đâu là khách hàng tốt
29
Các mô hình kết hợp kiểm soát đầu vào và
đầu ra
Mô hình bốn yếu tố
$ Sales = Days worked x
$ Sales = Days worked x
30
Calls
Orders
Sales $
Days Worked
Calls
Orders
Call Rate
Batting
Average
Average
Order Size
Doanh thu tăng như thế nào?
Số lượng các cuộc tiếp xúc KH tối ưu để tối đa hoá lợi nhuận?
Ai làm việc tốt hơn? An hay Phương?
Chiến lược quản lý nào cho Phương? Cho An?