Phân tích cấu trúc hình học trang ảnh tài liệu dựa trên phương pháp ngưỡng thích nghi
Bạn đang xem bản rút gọn của tài liệu. Xem và tải ngay bản đầy đủ của tài liệu tại đây (2.18 MB, 26 trang )
MINISTRY OF EDUCATION AND
TRAINING
VIETNAM ACADEMY OF SCIENCE
AND TECHNOLOGY
GRADUATE UNIVERSITY OF SCIENCE AND TECHNOLOGY
.............***.............
HA DAI TON
DOCUMENT GEOMETRIC LAYOUT ANALYSIS BASED
ON ADAPTIVE THRESHOLD
Major: Mathematics for Informatics
Code: 62 46 01 10
SUMMARY OF PhD THESIS IN MATHEMATICS
Hanoi - 2018
The work was completed at: Graduate university of Science and
Technology – Vietnam Academy of Science and Technology
Supervisor: Prof. Dr Nguyen Duc Dung
Review 1: ...
Review 2: ...
Review 3: ....
The thesis will be protected on the PhD thesis defense, meeting at the Graduate
university of Science and Technology – Vietnam Academy of Science and
Technology on ... hour ..., date ... month ... 201 ... .
The dissertation can be found at:
- Library of the Graduate university of Science and Technology
- National Library of Vietnam
INTRODUCTION
Text recognition is a field that has been researched and applied for many years. Text recognition
process is performed through the following main steps: The input image page will go through the
preprocessing step, then the page analysis step, the output of the page analysis will be the input
of the recognition step, and finally post-processing. The result of a recognition system depends
on two main steps: page analysis and recognition. At this point, the problem of recognition on
printed text has been resolved almost completely (ABBYY's FineReader 12.0 commercial product
can recognize printed text in various languages, recognition software of Vietnamese words in
VnDOCR 4.0 of the Hanoi Information Technology Institute can recognize with accuracy over
98%). However, in the world as well as in Vietnam, the page analysis problem remains a major
challenge for researchers. Until now, page analysis is still receiving the attention of many
researchers. Every two years in the world there is an international page analysis contest to
promote the development of page analysis algorithms. These were the motivations for the
dissertation to try researching so that they can propose effective solutions to the page analysis
problem.
In recent years, there are many page analysis algorithms have been developed, especially are
hybrid-oriented approached development algorithms. The proposed algorithms show different
strengths and weaknesses, but in general most of them still suffer from two basic errors: an error
separating a correct text area into smaller that leads to mislead or miss the information of text
lines or paragraph (over-segmentation), the aggregation error of text areas in text columns or
paragraphs together (under-segmentation). Therefore, the objective of the dissertation is to
study and develop page analysis algorithms that simultaneously reduce both types of errors:
over-segmentation, under-segmentation. The issues in page analysis are very broad so the
dissertation limits the scale of the study within the scope of text image pages written in Latin
language which particularly is English and focuses on the analysis of the text areas. The
dissertation has not proposed the problem of detecting and analyzing the structure of table
spaces, detecting image areas and analyzing logical structures. With the objectives of the
dissertation have achieved the following results:
1. Propose a solution that speeds up the algorithm for detecting background images.
2. Proposed adaptive parameterization method reduces the effect of size and font type on
the results of page analysis.
3. Proposed a new solution for the problem of detecting and using separator objects in page
analysis algorithms.
4. Proposes a new solution that separates text areas into paragraphs based on context
analysis.
CHAPTER 1. OVERVIEW OF DOCUMENT LAYOUT ANALYSIS
In this chapter, I present an overview of the text recognition system, the page analysis
problem, the typical page analysis algorithms, the most basic errors of page analysis algorithms.
This leads to the research objectives and results of this dissertation.
1.1.
The main elements of the text recognition system
Basically, a text recognition system is usually done through the basic steps described in
Figure 1. Information is in the form of text such as books, newspapers, magazines, etc. after
scanning process, it will show us the result in the image file. These image files will be the input of
an recognition system, the output of the recognition system are text files that can be easily edited
and archived, such as files of * .doc, * .docx, * .excel, * .pdf, etc. The dissertation focuses on
studying the the page analysis steps, in which the focus is the analysis of the geometric structure
of the layout.
Document layout
Text file
Post-processing
Pre-processing
Recognize
Analysis of the geometric
structure
Analysis of the logical
structure
Figure 1: Illustration of basic processing steps of text recognition system
1.1.1. Pre-processing
The task of pre-processing a layout is usually binary, defines the components of connected
image, filters noise, and aligns the gradient. The output of the pre-processing step will be the
input of the page analysis process. As a result, the pre-processing results will also have significant
effects on the results of the page analysis.
1.1.2. Document layout analysis
Document layout analysis is one of the major components of text recognition systems
(OCR - System). Besides, it is also widely used in other fields of computing such as document
digitization, automatic data entry, computer vision, etc. The task of page analysis includes
automatically detecting image areas on a document layout (physical structure) and categorize
them into different data regions such as text area, image, table, header, footer, etc. (logical
structure). Page analysis results are used as an input to the recognition and automatic data entry
of document imaging processing systems.
1.1.3. Recognition of optical characters
This is the most important stage, this stage determines the accuracy of the recognition
system. There are many different classification methods applied to word recognition systems,
such as: matching method, direct approach method, grammar method, graph method, neural
network, statistic method, and support vector machine.
1.1.4. Post-processing
This is the final stage of the recognition process. Maybe post-processing is a step to joint
the recognized characters into words, sentences, and paragraphs to reconstitute text while
detecting false recognized errors by checking spelling based on structure and semantics of words,
sentences or paragraphs of text. The discovery of errors, mistakes in recognition at this stage
significantly contributed to improving the quality of recognition.
1.2.
The typical algorithms for analyzing page’s geometric structure
Over the decades of development so far, there are a lot of page analysis algorithms have
been published. Based on the order of algorithms’ execution, document layout analyzing
algorithms can be divided into three different directions of approach: top-down, bottom-up and
Hybrid methods.
1.2.1. Top-down direction of approach
Typical top-down algorithms such as XY Cut, WhiteSpace, etc. These approach algorithms
perform page analysis by dividing the document layout into horizontal or vertical directions
under spaces in the page. These spaces are usually along the boundary of the column or border of
paragraphs. The strength of these algorithms is their low computational complexity, which
results in good analysis on rectangular pages, ie, layouts where the image areas can be
surrounded by rectangle does not cross. However, they cannot process pages which are nonrectangular image areas.
1.2.2. Bottom-up direction of approach
Typical bottom-up algorithms such as Smearing, Docstrum, Voronoi, etc. These approach
algorithms start with small areas of the image (pixels or characters) and in turn group the small
areas of the same type together to form the image area. The strength of this approach is that
algorithms can well process image pages with any structure (rectangle or non-rectangle). The
weakness of bottom-up algorithms is that memory is slow, because small areas are grouped
together based on distance parameters, which are typically estimated on the entire image page.
So these algorithms are often too sensitive to parameter values and over-segmentation of
textured image areas, especially font areas with differences in font size and style.
1.2.3. Hybrid direction of approach
From the above analysis, the advantage of the bottom-up direction of approach is the
disadvantage of the Top-down direction of approach and vice versa. Thus, in recent years there
have been many algorithms developed in the hybrid between top-down and bottom-up, one of
the typical algorithms such as RAST, Tab-Stop, PAL, etc. Algorithms developed in this direction
are often based on analytic objects such as clear space of rectangles, tab stops, etc. to infer the
structure of text columns. From there, the image areas are determined by the bottom-up method.
The results show that hybrid algorithms have overcome some of the limitations of top-down and
bottom-up algorithms, which can be implemented on any document layouts with any structure
and less restrictions on distance parameters. However, defining analytic objects is a difficult
problem for many reasons, such as having too closely spaced letters, the text area is aligned, left
and right are not aligned or the distance between connected components is too large, etc. This
has led to the fact that existing algorithms often suffer from forgotten errors or misidentification
of analytical paths leading to error analysis.
1.3.
Methods and data sets that evaluate the document layout analysis algorithms
1.3.1. Measure
Evaluating analysis algorithms for document layout is always a complex issue as it
depends on data sets, ground-truths, and evaluation methods. The issue of evaluating the quality
of page analysis algorithms has received a lot of attention. In this dissertation, three measures are
used: F-Measure, PSET-Measure and PRImA-Measure for all experimental assessments. PRImAMeasure has been successfully used at international page analysis events in 2009, 2011, 2013,
2015 and 2017.
1.3.2. Data
In this dissertation, I used three data sets of UW-III, a PRImA data set and a UNLV data set
for experimental assessment and comparison of document layout analysis algorithms. The UW-III
has 1600 images, PRImA has 305 images, and UNLV has 2000 images. These data sets have a
ground-truth at the paragraph level and text level, represented by non-intersecting polygons. The
layouts are scanned at 300 DPI resolution and have been re-adjusted the tilt. It contains a variety
of layouts on layout styles, which reflect many of the challenges of page analysis. The structure of
the layout contains a blend from simple to complex, consists of pictures with text around the
layouts, with a large change in font size. Therefore, these are very good data sets to perform
comparative analysis of page analysis algorithms.
1.4.
Conclusion of chapter
This chapter presents an overview of the field of text recognition, in which page analysis is
an important step. So far the problem of page analysis is still a problem that many domestic and
foreign research interest. There are many recommended page analysis algorithms, especially at
international page analysis competitions (ICDAR). However, the algorithms still suffer from two
basic errors: over-segmentation and under-segmentation. Therefore, the dissertation will focus
on the solutions for the problem of document layout analysis.
There are three main approaches for the problem of document layout analysis: top-down,
bottom-up and hybrid. In particular, the hybrid approach has been thriving in recent times as it
overcomes the disadvantages of both top-down and bottom-up approaches. For that reason, the
dissertation will focus more on hybrid algorithms, particularly the techniques for detecting and
using analytical objects of hybrid algorithms. The next chapter of the dissertation presents a
quick layout background detection technique, this technique will be used as a module in the
algorithm proposed in Chapter 3.
CHAPTER 2. QUICK ALGORITHM TO DECTECT THE BACKGROUND OF DOCUMENT LAYOUT
This chapter presents the advantages and disadvantages of a direction of approach based
on the background of layout background in document layout analysis, WhiteSpace page analysis
algorithms, fast layout background detection algorithms, and finally experimental results.
2.1. Advantages and disadvantages of the direction of approach based on the
background of layout background in document layout analysis
On the intuitive aspect, in many cases, the background layout can be detected more easily,
and at the same time based on the layout background can easily separate the page layout into
different areas. So early on, there were a lot of page analysis algorithms based on the layout
background developed, typical example such as X-Y Cut, WhiteSpace-Analysis, WhiteSpace-Cuts,
and etc. and recently there are also many algorithms based on the layout developed, for example,
Fraunhofer (winning at IC-DAR2009), Jouve (winning at ICDAR2011), PAL (winning at
ICDAR2013), etc. The direction of approach based on layout background is not only used in page
analysis, but also widely used in the problem of table detection, table structure analysis, and
logical structure analysis.
The above examples show that the direction of approach based on layout background has
many advantages. There are many different algorithms developed for layout background
detection, such as X-Y Cuts, WhiteSpace-Analysis, WhiteSpace-Cuts (hereinafter referred to as
WhiteSpace), etc. In which, WhiteSpace is known as a well-known geometric algorithm for layout
background detection, algorithms are included in the OCROpus open code-source so it is widely
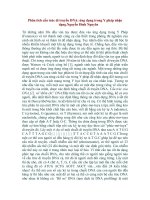
used as a basic step to develop algorithm. However, the WhiteSpace algorithm has a very limited
execution time which is quite slow, as shown in Figure 2. Thus, acceleration of the WhiteSpace
algorithm has many real meanings.
2.2. Layout background detection algorithms (WhiteSpace) for the problem of page
analysis
Figure 2. Illustration of average execution time of each algorithm.
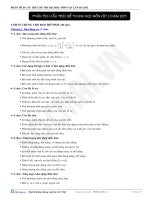
2.2.1. Definition
The largest white space in a layout is defined as the largest rectangle located in the
envelope of the layout and does not have any characters, as shown in Figure 3.
Figure 3. Blue rectangle represents the largest white space found.
2.2.2. The algorithm for finding the largest white space
The algorithm for finding the largest white space (hereinafter referred to as
MaxWhitespace) can be applied to objects that are points or rectangles. The key idea of the
algorithm is the branch and bound method and the Quicksort algorithm. Figure. 5 a) and 4
illustrate the fake code of algorithm and the step of dividing the rectangle into sub rectangles.
In the repository of this dissertation, the input of the algorithm is a set of rectangles (the
envelope of characters), the bound rectangle (envelope of whole layout) and the quality function
(rectangle), return to area of each rectangle, see Figure 4.a). The algorithm defines a state
consisting of a rectangle r, a set of obstacles rectangles (envelope of characters) that reside in the
rectangle r and the area of the rectangle r (q = quality (r)). State statei is defined as greater than
state statej if quality (ri)> quality (rj). The queue priority is used to store the state.
Each algorithm loop will derive state = (q, r, obstacles) as the beginning of the priority
queue, which is the state in which the rectangle r has the largest area. If no rectangular obstacles
are contained in r then r is the largest rectangular white area found and the algorithm terminates.
In contrast, the algorithm will select one of the rectangle obstacles to make pivot, the best choice
is as close to the center of the rectangle as possible, see Figure 4.b). We know that the largest
white space will not contain any rectangular obstacles so it will not contain the pivot either.
Therefore, there are four possibilities which may happens for the largest white space: is the left
and the right of the pivot, see Figure 4.c), or the top and bottom of the pivot, see Figure 4.d). Next,
the algorithm will identify the rectangle obstacles intersected with each of these sub rectangles,
with four sub rectangles r0, r1, r2, r3 generated from the rectangle r, see Figure 5 and calculate the
upper bound of the largest possible white space in each newly sub created rectangle, the upper
bound mainly selected is the area of each sub rectangle. The sub rectangle along with the
obstacles in it and the upper bound corresponding to it are pushed into the priority queue and
the above steps are repeated until the state appears with a rectangular r which does not contain
any obstacles. This rectangle is the overview solution of the problem to find the largest white
space.
Figure 4: Describes the step divided layout into four sub-regions of algorithm to find the largest white space, (a)
envelope and rectangles, (b) findable pivots, (c, d) left/right and above/below sub-regions.
def find_whitespace(bound,rectangles):
queue.enqueue(quality(bound),bound,rectangles)
while not queue.is_erapty():
(q,r,obstacles) = queue.dequeue_max0
if obstacles==[]:
return r
pivot = pick(obstacles)
r0 = (pivot.xl,r.yG,r.xl,r.yl)
rl = (r.x0,r.y0,pivot.x0,r.yl)
r2 = (r.x0,pivot.yl,r.xl,r.yl)
r3 = (r.x0,r.y0,r.xl,pivot.y0)
subrectangles = [r0,rl,r2,r3]
for sub_r in subrectangles:
sub_q = quality(sub_r)
sub_obstacles =
[list of u in
overlapslu,sub_r)]
obstacles
if
not
queue.enqueue(sub_q,sub_r,sub_obStacies}
Figure 5: Illustrates the fake code of algorithm to find the largest white space.
2.2.3. Layout background detection algorithm
To detect the layout background, algorithm is proposed as a module of the WhiteSpace
algorithm applying the MaxWhitespace algorithm to find m-Whitespace (with m - Whitespace of
about 300 is sufficient to well describe the layout background), the following background
detection algorithm is called WhiteSpaceDetection. Diagram of the algorithm is shown in Figure 5
b).
2.3. Acceleration of layout background detection algorithm
To find the white space which cover the layout background, white space detection
algorithm recursively divides the layout into sub areas so that the sub area does not contain any
characters. When each repeat algorithm will divide each sub area of the layout into four different
sub-regions, See Figure 6. This process will form a quadrilateral tree, so if the loop is large then
the number of regions that need to be considered will be very large. Therefore, the execution
time of the algorithm is very slow. Therefore, in order to accelerate the layout background
detection algorithm, it is necessary to minimize the number of subspaces which need to be
considered, by limiting the arising of unnecessary sub branch of the quadrilateral tree.
Figure 6 shows that the ZG region (the grandparents region) is divided into four sub
regions: ZPT sub-region, ZPB sub-region, ZPL left sub-region, and ZPR right sub-region. Continuing to
divide the ZPT region, the sub-region must be ZCTR in the ZPR region, so when considering the ZPR
region, also consider the ZCTR region, or the ZCTR region to be reconsidered. The example
illustrated in Figure 6 shows that the sub-region on the ZCRT of the ZPR region reconsider the ZCTR
region. This division process will form a quadrilateral tree and the further downs, the more subregions will be reconsidered.
In this chapter, the dissertation proposes a solution that minimizes the number of subregions being reconsidered. The proposed algorithm (hereinafter referred to as FastWhiteSpaceDetection) will not generate sub-regions that lie fully in previous sub-regions, based
on the relative position of the pivot of region considering with the pivot of father region. As the
example in Figure 6, the ZCTR sub-region will not be generated because it is in the region (ZPR).
However, only consider to remove sub-regions in pairs, or left / right sub-regions or above /
below sub-regions, in all considered regions. That means, if we consider removing the left / right
sub-regions, we will not consider removing the above / below sub-regions, and vice versa,
because if we consider the elimination of all four sub-regions, then there will be a space which is
never considered, resulting in the omission of some white spaces. For example, in Figure 6, if all
the four sub-regions are removed, the ZCTR and ZCRT regions are removed so that some parts of
the intersection will be never considered.
Thus, the improved Fast-WhiteSpaceDetection algorithm produces the following subregions (Figure 7):
• Produce above sub-region.
• Produce below sub-region.
• Produce left sub-region if the left coordinate of its pivot is greater than the left
coordinate of the Pivot of the father region and two non-vertical overlapping pivots
• Produce right sub-region if the right coordinate of its pivot is less than the right
coordinates of the Pivot of the father region and the two pivots are vertically overlapping.
2.4. WhiteSpace algorithm and Fast-WhiteSpace algorithm
2.4.1. WhiteSpace algorithm
Analyzing the background structure of the layout is an approach developed by many
authors. However, these approaches are difficult to experimentally install,
Figure 6: Drawback leading to the decreased speed of white spaces searching by WhiteSpaceDetection algorithm.
The ZCTR, ZcRT and its sub-domains will be reviewed multiple times.
a)
b)
Figure 7: Sub-domains generation by WhiteSpaceDection and the Fast-WhiteSpaceDetection algorithms. Figure a)
generation of 4 sub-domains by WhiteSpaceDetection algorithm. Figure b) results of sub-domains generation by
Fast-WhiteSpaceDetection algorithm.
requiring a large number of geometric and detailed data structures with many special
cases. Therefore, these methods have not been widely applied. The WhiteSpace algorithm
proposed by Breuel can be simply installed without considering special cases. The main steps of
the algorithm include:
Step 1 (Figure 8 b): Find and divide interconnected components into three groups based
on size: large group includes visual objects, lines, etc. medium group includes characters
(CCs) and small group includes interference objects.
Step 2 (Figure 8 c): Find rectangular white spaces.
Step 3: From the white spaces found, filter to obtain vertical white space (vspace)
segmenting columns and horizontal rectangle space (hspace) separating segments under
some criteria: the size and overlap of white spaces and the density of adjacent characters
of the white space.
Step (Figure 8 D): Find text areas by applying white space finding algorithm in step 2. At
this point, the CCs are replaced by vspaces and hspaces.
a)
b)
c)
d)
Figure 8: Steps of WhiteSpace algorithm. Figure a) envelopes of interconnected components (CCs), b) the rectangles
are white spaces covering the background of the layout, c) the rectangles are horizontal and vertical segmentation
objects used to segment a layout into areas, d) results of segmentation process.
2.4.2. Fast-WhiteSpace algorithm
For conducting experiments showing the efficiency (increased speed that does not affect
the results of layout background detection) of quick search on the layout. The thesis has applied
quick background search module to develop Fast-WhiteSpace and AOSM algorithms (AOSM will
be presented in chapter 3). Fast-WhiteSpace is a combination of WhiteSpace algorithm and quick
layout background search module.
2.5. Experiment and discussion
In this section, we present the results of speed and accuracy comparison between FastWhiteSpace and WhiteSpace algorithms on UW-III dataset. Figure 9 a) shows the average
execution time on each layout of WhiteSpace and Fast-WhiteSpace algorithms. Both algorithms
are tested concurrently on a PC with Intel Pentium 4 processor, 3.4 GHz CPU, 2 GB RAM memory
and Windows 7 Ultimate Service Pack 1 operating system. Experimental results show that FastWhiteSpace algorithm achieves extremely fast execution speed over the original WhiteSpace
algorithm.
Figure 9 b) presents the results of accuracy evaluation for algorithms on UW-III dataset
with PSET measure. The change in accuracy of Fast-WhiteSpace algorithm is insignificant
compared to that of the original algorithm, and shows relatively good results compared to those
of modern advanced algorithms, 91.87% of AdWhiteSpace algorithm compared to 93.84% of the
Tab-Stop and 79.45% of RAST algorithm.
2.6. Chapter conclusion
In this chapter, the advantages gained from layout-based approach have been presented
and concretized with evidences of developed powerful layout-based algorithms. In addition,
background search algorithm (WhiteSpaceDetection) and quick layout background search
algorithm (Fast-WhiteSpaceDetection) have also been illustrated. Experimental results have
shown that the improved WhiteSpace algorithm (using Fast-WhiteSpaceDetection as a module)
delivers remarkable execution speed and mostly unchanged accuracy in comparison with that of
the original algorithm.
a)
b)
Figure 9: Execution time and accuracy of Fast-WhiteSpace algorithm compared to those of WhiteSpace and typical
algorithms: a) execution time, b) accuracy.
CHAPTER 3. DOCUMENT LAYOUT SEGMENTATION ALGORITHMS HP2S AND AOSM
This chapter presents two document layout analysis algorithms: A hybrid paragraph-level
page segmentation - hereinafter referred to as HP2S algorithm and an adaptive over-split and
merge for page segmentation - hereinafter referred to as AOSM algorithm. The first part presents
the layout analysis models of both HP2S and AOSM algorithms. The second part presents the
phase of gathering phrases from interconnected components to form text areas of HP2S
algorithm. The third part presents the two phases of AOSM algorithm: phase 1: segmenting
layouts into candidate text areas, phase 2: gathering small segmented text areas to form text
areas. The phase of segmenting text areas into paragraphs is presented in the fourth section.
Finally, the experimental results on the data sets of page analysis competitions from 2009, 2015,
2017, UWIII and UNLV data sets will be.
3.1. Page analysis models of HP2S and AOSM algorithms
The algorithms analyze the pages in a hybrid approach which is a combination of topdown and bottom-up approaches. In recent years, many powerful algorithms have developed in
hybrid approach. The general idea of hybrid approach is to use low-level information (normally
interconnected components) to identify segmentation thereby infer column structure of the
layout, which means to figure out the number of text columns in the layout and that they will be
on different sides of the separators. Then, use gathering method to group low-level components
to form text areas. Finally, the text areas are segmented into paragraphs.
In this section, the thesis presents the page analysis models of both HP2S and AOSM
algorithms, see Figure 10. From model 10, it can be seen that HP2S and AOSM apply the same
method of segmenting the text areas into paragraphs. However, two algorithms use two different
approaches to identify the text areas, see Figure 11. HP2S uses bottom-up approach to group
interconnected components to form text areas while AOSM uses top-down approach to segment
the layouts into candidate text areas, then apply the adaptive parameter method to group small
segmented text areas. Details of both algorithms are presented in sections.
Figure 10: General models of HP2S and AOSM algorithms.
Figure 11: Algorithm diagram of both HP2S and AOSM algorithms: a) HP2S algorithm, b)
AOSMalgorithm.
3.2. HP2S algorithm
In this section, the thesis presents the main steps for determining text areas of HP2S
algorithm. This process consists of three main steps as illustrated in Figure 12. In step 1 the
algorithm will detect tab - lines between text columns. Step 2, the algorithm uses Hough
transform and tab - lines to identify text lines. Finally, the text lines are grouped to form text
areas. Details of these steps will be presented in sections , , .
3.2.1. Tab – lines detection
Figure 12: Main steps for determining text areas of HP2S algorithm.
Tab-Stop algorithm has presented the problem of detecting tab-lines as a sequence of
characters at the beginning or the end of each line (tab-stop) and vertically aligned. These
segmentation lines can be used to replace physical segmentations or rectangular white spaces in
detecting column structure of document layout. In this section, I would like to introduce a simple
method for detecting tab-lines. HP2S algorithm has a tab-line detection method which has fewer
step, is simpler and easier to experimentally install.
3.2.2. Text lines identification
Firstly, Hough transform is performed on the midpoints set of bottom edges of the
characters to find the sequence of horizontally aligned characters. The sequence of horizontally
aligned characters will be the best candidate to form text lines. Each of these characters sequence
is called a candidate text line, see Figures 13 and 14. For each candidate text line, the algorithm
will estimate the horizontal spacing of the characters and adjacent words, the spacing between
the words is denoted by dw. The dw spacing will be used along with segmentation lines to segment
the candidate text lines into text lines as follows: two horizontal adjacent characters are in the
same text line if they are not on two sides of a certain segmentation line, and their horizontal
spacing does not exceed two times of dw. The combination of segmentation lines and bottom-up
traditional method to identify the text lines has helped the algorithm segment the text lines in
very close text columns. In some cases the spacing between two columns is almost equal to the
spacing between the words in candidate text lines (13a). However, the existence of vertical
segmentation lines has helped the algorithm segment the candidate text lines into different text
lines in different columns, see Figure 13b). When the text columns are not aligned, there will be
no segmentation line and dw parameter will be useful for identifying text lines. In most of these
cases, the spacing between the text lines d is greater than the spacing between the words dw
(Figure 14).
Unlike the traditional bottom-up algorithms, our algorithm does not use just one dw
parameter for all candidate text lines. The dw parameter is estimated on each set of characters
with similar font size and in the same candidate text line. Thus, this has reduced the text line
fragmentation of the algorithm remarkably, especially the text lines in the header (Figure 13b).
a)
b)
Figure 13: Segmentation lines used in the process of identifying text lines. a) candidate text lines. Characters located
at different sides of a segmentation line will belong to different text lines. b) The text lines are the results identified
by the algorithm.
a)
b)
Figure 14: a) candidate text lines, b) in case of no segmentation line, dw is used to segment characters into text lines.
In some cases, for example, the text areas of the references or paragraphs beginning with
special characters, the text areas are often aligned and indented compared to special indices and
characters. Therefore, the segmentation line will remove the special indices and characters from
the text lines.
In order to fix this type of error, we first find more candidate tab-stop by applying the
same tab-stop search method as the section with the width of the right adjacent rectangle equal
to one of the width of the character being considered. Then, the newly found candidate tab-stops
which intersect with the left candidate tab-stops identified from the section will be updated as
reference tab-stops or special characters denoted by m_tabs. m_tabs are characters that have
been separated from the text line due to the appearance of segmentation line. Finally, the
algorithm will combine m_tabs with the right adjacent text lines and labeled them as
segmentation text lines. The segmentation text lines will be re-used in the section to identify the
paragraphs.
3.2.3. Group clusters of text lines into text areas
In this section, the process of grouping text lines into text areas will be presented. The
bottom-up approach is used to group adjacent text lines to form text areas with any envelope.
The set of text lines identified from the previous section is rearranged in order from left to
right, from top to bottom. A pair of lines (linei, linej) simultaneously satisfying the following
conditions will be grouped into a same text area.
a)
b)
c)
Figure 15: a) Original image, b) separation lines, c) defined text areas.
()
(
)
( )
(
)
( )
(
)
{ ( )|
|
(
)
Among the above conditions, DisHoriz (.,.) is the horizontal distance between the lines.
AvgHoriz is the horizontal average distance of the text lines. yi and yj are ordinates of the centers
of text lines linei and linej respectively. x - heightij is the smallest value of x - heighi and x - heighj.
CheckTabline (.,.) returns to the true value if two text lines are on two sides of the lines of any
separation line; if not, it will return to the false value. CheckRulling (.,.) returns to the true value if
two text lines are on two different sides of a horizontal line; if not, it will return to the false value.
Conditions (i) and (ii) ensure separating the lines into different columns. This is done by
using a combination of separation lines and strict grouping conditions. Condition (iv) allows
grouping only text lines of the similar font size and overlapping text lines vertically.
It`s worthwhile that the condition (iv) advocates text lines of similar font size and
becomes strict when font sizes are different. In another aspect, the distance between the centers
of two lines on the left of (iv) includes the large font size while the left side of (iv) includes the
small font size. The empirical results shown in Figure 26 show that HP2S is less sensitive to
values of parameter .... The most appropriate ... Value is between 1.4 and 1.6. Therefore, the
algorithm uses a default value of 1.5 for all experiments.
3.3.
AOSM algorithm
In this section, the dissertation presents the text area identifying process of the AOSM
algorithm. This process consists of two main phases as follows (Figure 16):
• Phase 1: Over splitting the image page into candidate text areas.
• Phase 2: Group over-split candidate text areas into text areas.
Phase 1: Oversegmentation
Filtering interconnected components
Detecting separators
Identifying candidate text areas
Phase 2: Grouping
Identifying text lines
Grouping text lines into text areas
Figure 16: Main steps of the text area identifying process of the AOSM algorithm.
3.3.1. Identifying candidate text areas
The most common separations applied by one of the leading hybrid algorithms at present are
whitespace rectangles, such as RAST algorithm, Fraunhofer algorithm, or strings of white zones,
such as PAL or strings of characters at the beginning or end of a line, such as Tab-Stop, ETIPA.
Methods based on these separators depend on two steps:
•
Step 1: extracting candidate separators,
•
Step 2: selecting and grouping candidate separators into the best separation lines.
Thus, hybird algorithms are often sensitive to the result of the process of detecting separation
objects. If identified as missing, the under-segmentation error will occur, which if misidentified,
the over-segmentation error will occur.
To overcome the disadvantages of separation identifying steps, we use a simple and effective
solution as follow:
•
Step 1: To extract candidate separators (white space) we use the WhiteSpace algorithm,
which is a simple and effective algorithm, especially this algorithm has had open source codes.
•
Step 2: The set of candidate white space areas detected in step 1 are used as separators to
divide the image page into candidate text areas.
With this approach, the AOSM algorithm can overcome the shortcomings, disadvantages
of the most powerful separation detection methods at present. Interestingly, the candidate text
areas are very easily determined by eliminating separable objects, see Figures. 17c) and 17d). At
the same time, the analysis results when using all white spaces will overcome almost completely
under-segmentation errors caused by the proximity of image pages or the page structure .
However, some text areas may be over-segmented, as shown in Figure 17. These over-segmented
text areas can be controlled and corrected in phase 2 of the AOSM algorithm.
Figure 17: Illustration of results of steps in the Phase 1: a) original image input; b) rectangles representing
detected white spaces; c) the results of “ink pouring” process; d) candidate text areas.
3.3.2. Grouping over-segmented text areas
Areas where the number of text lines is small are considered to get over-segmentation
error. All text lines in these text areas will be re-grouped together by the adaptive parameter
method that is stated as follows: Two text lines linei and linej (belonging to two adjacent text
areas) are considered for grouping into a region if the following conditions are satisfied (see
Figure 18).
{
(
|
|
)
(
)
and are ordinates of the center of text lines:
and
respectively,
is the
height of the most appearing characters in a text line,
is the smallest
of
two text lines. Parameter is used to determine the vertical adjacent distance vertically between
two text lines in the same image area.
These conditions mean that two text lines will be grouped in the same region if they are
close enough in the horizontal direction (i) or close enough in the vertical direction (ii). A very
worthwhile issue is that condition (ii) allows the algorithm not only to measure the vertical
distance between the lines, but also to evaluate the difference in font size between the the text
lines. Condition (ii) advocates grouping two text lines of similar font sizes and becomes stricter
fonts for text lines which are much different in the font sizes. Experimental results have shown
that the AOSM algorithm is less sensitive to parameter (Figure 26) and that the appropriate
values of are between 1.4 and 1.6. Therefore, the default value of 1.5 was chosen in all
experiments. The value 1.5 corresponds to the 1.5 line spacing for the height of text lines of many
text formats.
Figure 18: Illustration of the adaptive parameter method. The vertical distance between two text lines, linei,linej is
greater than the vertical distance between two lines, linej, linek. However, the two lines, linei,linej are considered in
)
the same group because |
| (
while two lines,
are not in a same group
)
because |
| (
Figure 19 shows an example of a group of text lines that are over-segmented into text
areas. Text lines in the header area are often over-segmented because of the large distance
between text lines. The AOSM algorithm will group these text lines into the same text area based
on the similarity of the height and the distance relationship between them. Text lines in the
header area and in the content section are not grouped together due to the large correlative
distance between the centers of text lines.
a)
b)
Figure 19 Illustrate the result of grouping over-segmentation text regions: a) over-segmentation; b) results after
clustering.
3.4.
Identifying paragraphs
3.4.1. Definition of separation text lines
To separate text areas into paragraphs, the HP2S and AOSM algorithms use five types of
separation text lines as illustrated in Figure 20.
Figure 20: The “dash line” rectangles present for the defined separation text lines.
3.4.2. Split plain text areas into paragraphs
Difficulties in analyzing text pages are not only the complex structure of the image page or
the change of font style or size, but also the too close distance between text areas. The distance
between text lines is sometimes smaller than the distance between the words on the same line.
This is a challenge for most page analyzing algorithms that rely on separation objects and the
analysis of interrelated components fails.
To overcome this difficulty, the HP2S and AOSM algorithms use a set of separation text
lines to segment text areas into paragraphs. The paragraph identifying process is as follows: the
algorithm browses each text area from top to bottom and from bottom to top so that it does not
break through the separating lines (Figure 20.b) or 20.c), and then subdivide each area into
smaller areas (Step 1 in Figure 21.d). And then the text lines in these subdivided areas are
rearranged in both vertical and horizontal orders, (step 2 in Figure 21.d). Finally, paragraphs are
identified by using the separation text lines in Figures 20.a), 20d) or 20.e) (step 3 in Figure 21.d).
As illustrated in Figure 21, separation text lines have shown the effectiveness in
separating text areas that are similar in the font size, very close together and structurally
complex. Traditional top-down and bottom-up algorithms almost fail in this case.
a)
b)
c)
d)
Figure 21: Splitting plain text areas into paragraphs: a) results of the separation with no use of separation
lines, b) “bold” text lines are separation lines, d) text areas are separated by the use of separation lines, e) final
separation result.
3.5.
Experiment and discussion
3.5.1. Algorithms, data sets, and mesurement
In this section, the dissertation presents the experimental results of the HP2S, AOSM and
Fast-AOSM algorithms (Fast-AOSM is the AOSM algorithm using the fast white space detecting
module as stated in Chapter 2) with the algorithms representing the approaches of top page
analyzing algorithms, page analyzing systems in ICDAR2009, ICDAR2015 and ICDAR2015
international page analyzing competitions, commercial products and famous systems of open
source codes. •
• Typical algorithms for to-down, bottom-up and hybrid approaches include : Docstrum,
Voronoi , WhiteSpace, Tab-Stop .
• Top systems in ICDAR2009, ICDAR2015 and ICDAR2017 international page analyzing
competitions.
• Famous commercial products: Fine Reader 8.1, 10, 11 and 12 hereafter are respectively
symbolized as: FRE 8.1, FRE 10, FRE 11, FRE 12.
3.04
• Famous Open Source Systems: OCRopus 0.3.1, Tesseract 3.02, Tesseract 3.03, Tesseract
Experimental results were performed on well known data sets: UWIII, UNLV, ICDAR2009
dataset, ICDAR2015 dataset and ICDAR2017 dataset. We used measurements including FMeasure, PSET and PRImA measurements in different assessment contexts to evaluate the
success of page analyzing algorithms at ICDA2009, ICDAR2011, ICDAR2013 and ICDAR2015
competitions.
3.5.2. Experimental results and discussion
Figure 22: The experimental result of the HP2S and AOSM algorithms on ICDAR2009 dataset compared to the top
algorithms of the competition in 2009, a) result with F-Measure, b) result with PRImA-measure.
Figure 23: The accuracy of the HP2S and Fast-AOSM algorithms compared to the top results published at the
ICDAR2015, ICDAR2017 competitions, which is performed on the context of PRImA-measure. a) the result on UNLV
dataset, b) result on ICDAR2017 dataset.
The accuracy of the Docstrum, Voronoi, WhiteSpace, Tab-Stop and AOSM algorithms on the two
datasets is shown in figure 25. Because pages of the UW-III dataset have fairly simple layout
(mostly rectangular layout), so most algorithms have fairly high accuracy results, in which the
accuracy of Docstrum is 92.87%, and of Tab-Stop is 90.42%. Most of these algorithms’ error is
over-segmentation of header with large font sizes. With adaptive parameter, the HP2S and AOSM
algorithm almost completely overcomes this error, and increase the algorithm accuracy up to
93.95% and 93.12% compared to 92.87% of Docstrum, illustrated in Figure 25.
a)
b)
Figure 24: The accuracy and error types of Fast-AOSM algorithm compared to the top algorithms in the 2015
competition when performed on ICDAR2015 dataset. a) the accuracy, b) the error types on OCR context
Figure 25: Comparison the accuracy and error types of HP2S and AOSM algorithms with typical algorithms with
PSET-measure. a) the accuracy of algorithms on two datasets UW-III and ICDAR2009. b) the different error types on
ICDAR2009 dataset.
The HP2S and AOSM algorithms can overcome almost all over-segmentation error that occurs in
header text region, which is an impressive result. However, the accuracy percentage increases
slightly compared to the Docstrum algorithm, this is due to the fact that the number of document
images having titles with the large font size in the UW-III image set is not many, at the same time,
the number of text lines in these region is usually fewer than the majority.
The ICDAR2009 dataset has a wide variety of pages’ layout, ranging from simple to complex, the
font sizes and theme fonts in the same page change frequently and there are many challenging
scenarios that most algorithms still cannot overcome. On a much harder dataset, the HP2S and
AOSM algorithms have shown great improvement over the rest of algorithms, in which: the
accuracy of the HP2S is 91.84% and of the AOSM is 86.43% compared to of Tab-Stop, second-best
algorithm, is 76.68% (Figure 25). The evaluation result with PRImA- measure also shows that
HP2S and AOSM outperformed other algorithms: 92.72% for HP2S and 92.63% for AOSM,
compared to 82.37% for the second-best algorithm, Fraunhofer. (Figure 22).
Figure 25 b) presents the typically error types that algorithms often encounter. The complexity of
ICDAR2009 dataset has made it difficult for the algorithm to detect threshold parameters as well
as to detect delimiters. Most algorithms fail to reduce both over-segmentation and undersegmentation errors, for example Docstrum has the lowest over-segmentation error (split) at
3.16% and the most serious under-segmentation (merge) at 26.02%, the corresponding numbers
of Tab-Stop are 6.11% of split error and 17.07% of merge error. The AOSM algorithm reduces the
merge, split errors to 9.17% and 4.28% respectively.
Figure 23 shows the accuracy of HP2S and Fast-AOSM algorithms against the top systems at the
International Document Layout Analysis competitions in 2015 and 2017. On the UNLV data set,
HP2S and Fast-AOSM algorithms stood in the fourth and second place respectively. AOSM
algorithm was third on ICDAR2017 dataset in “text” context. The MHS system ranked first in both
2015 and 2017 on all contexts.
Figure 24 illustrates the accuracy and error types: merge, miss/partial misses, misclassification
and false detection of Fast-AOSM algorithm with the results of the 2015 Document Layout
Analysis competition. The Fast- AOSM ranks third behind ISPL and MHS system. It can be seen
that Fast-AOSM algorithm reduces both types of error: over-segmentation and undersegmentation much better than other algorithms, which is 17.35% of merge errors and 5.18% of
split errors of Fast-AOSM algorithms compared to 18.5% of merge errors and 5.63% of split
errors of top system MHS. However, the accuracy of the Fast-AOSM algorithm is lower than the
MHS system. This is because MHS includes good modules that detect image region and table
region, so the miss/partial misses errors are very low, which is 0.26% of miss/partial misses
compared to 17.58% of miss/partial misses for Fast-AOSM algorithms.
For the adaptive threshold parameter θ used in combining the two lines together, which has been
presented in section. We performed experiments with θ values, ranging from 1.0 to 2.0, on the
ICDAR2009 dataset. As we can see in Figure 26, the results of HP2S and AOSM algorithm does not
change sensitively to the θ value:. The less sensitivity of parameter θ to group conditions is based
on the fact that the difference in font sizes was partly reflected in the calculation of the distance
between the center of the two lines and the threshold distance which is based on minimum xheight of the two lines. In other words, the HP2S and AOSM algorithms support grouping two
lines with the same font size and are strict in the opposite case, even if they are very close to each
other.
Figure 27 shows the average running time on each page of the Docstrum, Voronoi, WhiteSpace,
TabStop, HP2S, AOSM and Fast-AOSM algorithms on the ICDAR2009 dataset. The experiment was
performed on a personal Computer with specifications of Intel Core i5 Processor 3.2GHz. AOSM
takes an average of 1 second to process an image, is almost equivalent to the WhiteSpace
algorithm, faster than Voronoi and slower than Docstrum. HP2S has a faster average execution
time than the Voronoi, WhiteSpace, Tab-Stop and AOSM algorithms. Fast-AOSM algorithms have
a slower execution time than Docstrum and are faster than the rest of the algorithms.
a)
b)
Figure 26: Execution time of HP2S and AOSM algorithms on PSET-measure, ICDAR2009 dataset with different θ
values.
Figure 27: Average execution time of each algorithm on each page.
3.6.
Chapter’s conclusion
In this chapter, we have presented an AOSM algorithm (Adaptive Over-Split and Merge)
for analyzing document layout. The goal of the AOSM algorithm is to reduce at the same time both
the most common types of errors in document layout analysis algorithms: under-segmentation
and over-segmentation that are caused by changes in font sizes and theme fonts, close distance
between text regions and the complex layout of the page. First, AOSM uses the set of all white
areas covering background document as delimiters, which is an interesting and effective way
compared to other common separating methods, such as tab-stops or whitespaces to find out the
column layout of page. This strategy not only solved the problems of detecting delimiters, but
also effectively solved the problem of under-segmentation. Over-segmentation errors are often
caused by a large variation in font size, theme fonts and spacing between large text. The adaptive
parameter method of AOSM overcomes the problem of over-segmentation in text of the same
region and the over-segmentation problem occurs on the same line. Finally, the text only region
are separated into paragraphs using text delimiter lines.
CONCLUSION AND FURTHER RESEARCH
Conclusion
With the set objectives, the thesis has achieved the following main results:
1.
Evaluating, comparing typical document layout analysis algorithms on PRImA datasets
and Vietnamese datasets. The results provided the most comprehensive overview of layout
analysis, strengths and weaknesses of the approaches. This will serve as a guideline for future
research objectives.
This results are published in [4].
2.
Propose a solution for accelerating the background image detection algorithm by applying
Branch and Bound to limit the number of unnecessary branches to be considered thus speeding
up the execution of the algorithm.
This results are published in [3].
3.
Propose new solutions in the detection and use of delimiters. Propose adaptive parameter
method for the clustering process of the bottom-up approach. Define delimiter lines to
successfully separate the text region into paragraphs.
Related results are published in [1, 2, 5, 6].
Further research
Although the thesis has achieved certain results, the research results mainly focus on separating
the text region from the non-text region, separating the text region into paragraphs. Problems
such as: image region, table region, chart region, logical structure analysis, etc. are not mentioned
in the thesis. In the future, the thesis will continue to develop in the following directions:
1.
Detecting image region
2.
Analyzing logical structure
3.
Detecting and analyzing table layout